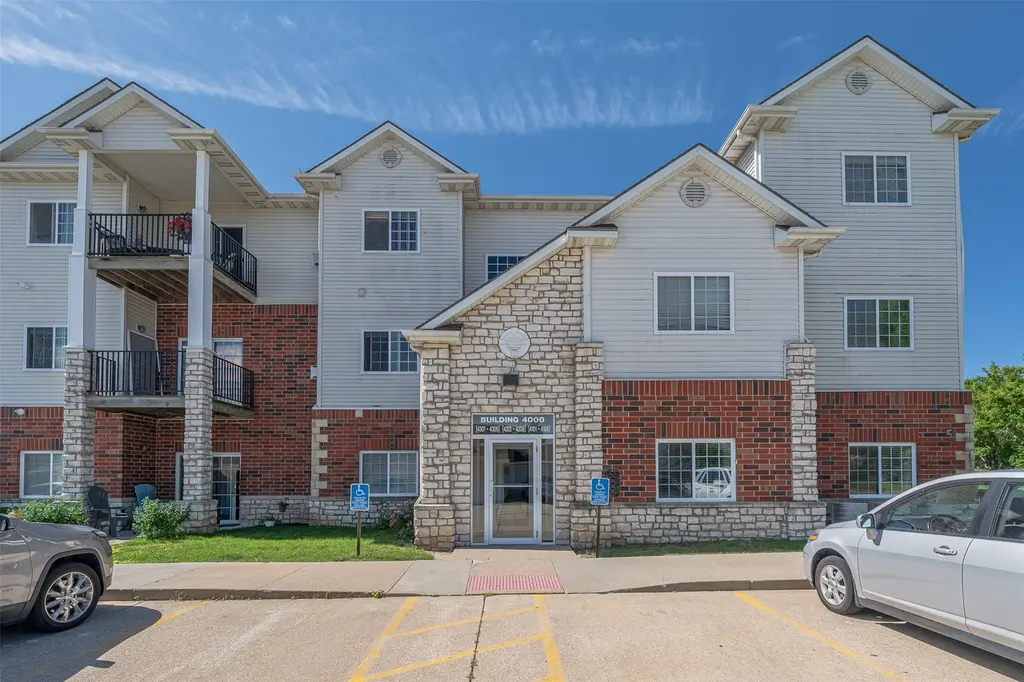
6255 Beechtree Dr #4205 · West Des Moines, IA
Flood risk 1/10 · Minimal
- FEMA flood zone
- X (unshaded)
- Chance of flooding over 30 yrs
- 0.0%
- Est. flood insurance / yr
- $507 – $1,088
Fire risk 1/10 · Minimal
- Est. fire insurance / yr
- $902 – $1,676
Heat risk 3/10 · Minor
- Hot days now (above 103°F)
- 7 days/yr
- Hot days in 30 yrs
- 15 days/yr
Wind risk 2/10 · Minimal
- Chance of severe wind over 30 yrs
- —
Air-quality risk 1/10 · Minimal
- Unhealthy air days now
- 0 days/yr
- Unhealthy air days in 30 yrs
- 0 days/yr
Risk factors via First Street. Map © Google.
Why this score? — see what drove the C- grade
The composite is a weighted blend of 9 inputs, each scored 0–100. Each bar is that input's sub-score; the figure is the points it added to the 100-point composite (weight × sub-score).
- Cash flow +14.9/30.0
- ARV discount +7.5/15.0
- Schools +7.1/10.0
- 1% rule +6.4/10.0
- DSCR +4.6/10.0
- Livability +4.4/5.0
- Rent growth +3.0/5.0
- Condition / age +2.5/5.0
- Appreciation +0.0/10.0
$169,900
🖨 Deal sheet 📄 Offer letter ✓ Due diligence
Listing remarks MLS
Great location for this condo in West Des Moines, close to Jordan Creek Mall! 3 bedrooms, 2 full baths, all appliances stay. Vaulted ceilings in the living room. Complex has a swimming pool for your summer fun. Pet restrictions 1 dog or 1 cat. Owner occupied only. Needs a little TLC home is a short sale and is sold as is. Buyer needs to recreate abstract at their expense. Price of home reflects this.
Key facts
- Private deck
- Bar-top counter
- In-unit laundry
Tags
Property features AI
Finance
- HOA & community: Homeowners association (Bella Centro, Conlin); Association fee $295 monthly; Association fee includes grounds and structure maintenance, and snow removal; Community pool
Exterior
- Parking: Detached one-car garage
- Security: Fire alarm
- Utilities: Public water; Public sewer
- Home design: Resale property; Zoned R
- Construction: Vinyl siding; Asphalt shingle roof; Poured slab foundation
- Exterior features: Concrete road surface; Fire alarm
Interior
- Kitchen: Cooktop; Dishwasher; Microwave; Refrigerator; Stove
- Bedrooms: 3 main-level bedrooms
- Flooring: Carpet; Tile
- Bathrooms: 2 full bathrooms
- Heating & cooling: Central air conditioning; Forced air heating; Natural gas heat
- Interior features: Dining area; See remarks
- Laundry & utility: Washer; Dryer; Laundry on main level
Neighborhood map
What this means for you Summary
Snapshot
- This is a 3-bed/2.0-bath condo listed at $170k.
Deal economics
- At list price, monthly cash flow is $51 ($615/yr) — positive.
- The deal already cash-flows at list — no discount required.
- Meets the 1% rule at list price ($2k rent vs $170k).
- Cap rate 6.7% vs local median 2.5% in West Des Moines — top-decile yield for the area; either an underpriced asset or a hidden risk that comps aren't pricing in. Stress-test before assuming the spread holds.
Location & tenants
- Location reads 87/100 on livability (#11 in IA, #336 nationally) — a professional / high-income tenant draw. Strengths: schools A+, amenities A+, cost of living A+; Watch: commute F.
- Waukee Community School District (suburban): math 80% / reading 79% proficiency, ranked #14 of 289 in IA (top 5%) — strong family-tenant draw, lease renewals of 3-5y typical; only 11% free/reduced lunch — higher-income household profile.
- Market conditions: Rents rising (+1.9%/yr); 583 active listings in the ZIP; 22 comparable units currently listed for rent nearby; rentals at typical pace (median 15d on market — plan ~3-4 weeks tenant-placement turnaround); solid renter incomes; 1,503 units permitted in Dallas County in 2024 (630 in 5+ unit buildings).
Forward outlook
- Local home prices are declining (-3.0%/yr); year-one equity from $1k of loan paydown is wiped out by about $5k of value loss. Plan a longer hold.
- Dallas County population projected at +74% by 2050 — long-run rental-demand tailwind backs the buy-and-hold thesis.
Negotiation context
- Only 1 days on market — expect competitive offers; lowballing is unlikely to land.
- 4 sale attempts since 19y ago with the ask held roughly flat each time — persistent listings suggest the price (not the market) is what's stuck; bring a comps-based counter.
- Current owner paid $90k; list at $170k implies a 89% gain — meaningful room to come down on a strong offer.
Questions for the listing agent
- What does the HOA fee cover, when was the last increase, and are there any pending special assessments or reserve-fund shortfalls?
- Any open or pending special assessments — roof, HVAC, plumbing, elevator, façade? What's the per-unit balance and payoff schedule, and is the seller paying it off at close or rolling it to the buyer?
- Is there a deadline driving the sale (1031 exchange, divorce, estate, relocation)? That informs how much negotiation room exists.
- Schools are A-rated — typically a magnet for longer-tenancy family renters. What's the average tenant stay here, and is there a school-zone premium baked into asking?
- What's the average days-on-market for RENTAL listings here right now (not sales)? A rising rental-DOM trend means longer vacancies and softer asking-rent achievability than the comps imply.
- What's the recent tenant-quality profile in this submarket — average credit score on applications, eviction rate, late-payment / NSF rate, and stable-employment percentage? A property-management company in the area should have these aggregated.
- How much new apartment / multifamily construction is in the pipeline within 1–3 miles? Heavy new supply (>2% of stock underway) typically softens rents 12–24 months out; light construction supports rent growth.
Investment metrics
- 1% rule
- 1.14% ✓
- Cap rate
- 6.66%
- Cash-on-cash
- 1.29%
- DSCR
- 1.06
- GRM
- 7.3
CMA / ARV
No comps found within radius.
Projected returns pro-forma
-3.0% appreciation · 1.94% rent growth · sell at horizon
- IRR
- -15.6%
- Equity multiple
- 0.45×
- Total profit
- $-26,092
- Equity at exit
- $25,333
- IRR
- -9.3%
- Equity multiple
- 0.46×
- Total profit
- $-25,843
- Equity at exit
- $14,690
Cash invested: $47,572 (down + closing). Projections, not guarantees.
Landlord ↔ Tenant lean methodology
- Overall (STATE)
- 83 Strongly Landlord-Friendly
- State Iowa
- 83 Strongly Landlord-Friendly · R+6
- County
- — inherits STATE
- City
- — inherits STATE
ZIP-level market 50266
- Home prices YoY
- -17.5%
- Rents YoY
- 1.9%
- Active inventory
- 583
- Price-to-rent
- 7.3×
Monthly cashflow live
- Estimated rent
- $1,935 high interval (Pro) →
- Mortgage (P&I)
- −$891
- Tax from tax record
- −$221 /mo · $2,650/yr
- Insurance
- −$71
- HOA
- −$295
- Vacancy / Maint / Mgmt
- −$406
- Net cashflow
- $51
Break-even live
UW: 25.0% down · 7.5% · 30yr · 1.5% tax · 5.0% vac · 8.0% maint · 8.0% mgmt
Financing live
Cash to close
- Down payment
- $42,475
- Closing costs
- $5,097
- Reserves months
- —
- Total cash needed
- —
Loan-product check · same deal, 3 products live
Conventional
25% down · 7.5% · 30yr
- Down + closing
- —
- Monthly P&I
- —
- Monthly cashflow
- —
- DSCR
- —
- Eligible?
- —
Personal DTI + credit; lowest rate.
DSCR
20% down · 8.5% · 30yr
- Down + closing
- —
- Monthly P&I
- —
- Monthly cashflow
- —
- DSCR
- —
- Eligible?
- —
No personal income docs; deal must DSCR.
Hard money
10% down · 12.0% · 12mo
- Down + closing
- —
- Monthly P&I
- —
- Monthly cashflow
- —
- DSCR
- —
- Eligible?
- —
Short-term bridge; refi at stabilization.
Rent comps 22 comps
| Address | Beds | Baths | Sqft | Rent | $/sqft | DOM | Units | Dist |
|---|---|---|---|---|---|---|---|---|
| 6565 Wistful Vista Dr West Des Moines, IA | 2.0 | 1.0–2.0 | 871 | $1,765 | $2.03 | 14d | 19 | 0.19mi |
| 204 S 64th St West Des Moines, IA | 1.0–3.0 | 1.0–2.5 | 1346 | $2,790 | $2.07 | 14d | 2 | 0.30mi |
| 6630 Cody Dr West Des Moines, IA | 2.0 | 2.5 | 1200 | $1,565 | $1.30 | 14d | 1 | 0.32mi |
| 6185 Village View Dr Unit 6245-201 West Des Moines, IA | 2.0 | 2.0 | 1165 | $2,000 | $1.72 | 14d | 1 | 0.54mi |
| 6375 Village View Dr West Des Moines, IA | 1.0–2.0 | 1.0–2.0 | 900 | $2,200 | $2.44 | 14d | 9 | 0.56mi |
| 6814 Meadow Ct West Des Moines, IA | 3.0 | 2.5 | 1462 | $2,495 | $1.71 | 21d | 1 | 0.62mi |
| 950 67th St #410 West Des Moines, IA | 2.0 | 2.0 | 999 | $1,295 | $1.30 | 23d | 1 | 0.78mi |
| 7425 Wistful Vista Dr #304 West Des Moines, IA | 2.0 | 2.0 | 1268 | $1,875 | $1.48 | 14d | 1 | 0.88mi |
| 7425 Wistful Vista Dr #802 West Des Moines, IA | 2.0 | 1.5 | 1276 | $1,475 | $1.16 | 44d | 1 | 0.88mi |
| 360 Bridgewood Dr West Des Moines, IA | 2.0 | 1.0–2.0 | 795 | $1,855 | $2.33 | 14d | 21 | 0.95mi |
| 950 Jordan Creek Pkwy West Des Moines, IA | 1.0–2.0 | 1.0–2.0 | 1082 | $3,546 | $3.28 | 14d | 37 | 0.98mi |
| 210 S Prairie View Dr West Des Moines, IA | 1.0–3.0 | 1.0–2.0 | 992 | $1,709 | $1.72 | 14d | 27 | 0.99mi |
| 7171 Woodland Ave West Des Moines, IA | 1.0–2.0 | 1.0–2.0 | 1085 | $1,825 | $1.68 | 14d | 1 | 1.06mi |
| 6455 Galleria Dr West Des Moines, IA | 1.0–3.0 | 1.0–2.0 | 1048 | $1,831 | $1.75 | 14d | 22 | 1.10mi |
| 811 Burr Oaks Dr #1206 West Des Moines, IA | 2.0 | 2.5 | 1279 | $1,700 | $1.33 | 23d | 1 | 1.11mi |
| 716 Knolls Ct West Des Moines, IA | 3.0 | 2.5 | 1448 | $2,095 | $1.45 | 44d | 1 | 1.16mi |
| 5901 Vista Dr West Des Moines, IA | 3.0 | 2.0 | 830 | $1,476 | $1.78 | 14d | 130 | 1.31mi |
| 5101 Hawthorne Dr West Des Moines, IA | 2.0–3.0 | 2.0 | 1201 | $1,539 | $1.28 | 14d | 4 | 1.32mi |
| 8350 Ep True Pkwy #3105 West Des Moines, IA | 2.0 | 2.0 | 1100 | $1,450 | $1.32 | 19d | 1 | 1.35mi |
| 5699 Vista Dr West Des Moines, IA | 3.0 | 2.5 | 1870 | $1,872 | $1.00 | 14d | 6 | 1.39mi |
| 6950 Stagecoach Dr West Des Moines, IA | 2.0–3.0 | 2.5–3.5 | 1785 | $2,585 | $1.45 | 14d | 20 | 1.40mi |
| 4700 Ep True Pkwy West Des Moines, IA | 1.0–2.0 | 1.0–2.0 | 852 | $1,707 | $2.00 | 14d | 25 | 1.49mi |
HOA detail condo
- Monthly dues
- $295 · $3,540/yr
- Likely covers
- pool
- Assessments
- None detected in remarks — confirm with the listing agent.
Listing history 2 events
-
2026-06-18remarks 699-char remark
-
2026-06-18$169,900 Active 1 DOM
ⓘ Source: listings_history table (triggers on properties + properties_extension) + one-shot
backfill from property_details.listing_events for pre-trigger history.
Tax reassessment forecast IA · Partial reset (capped growth)
- Current annual tax
- $2,650 · $221/mo
- Projected year-2 tax
- $2,659 · $222/mo
- Expected delta
- +$9/yr (+$1/mo · 0.3%)
ⓘ Screening estimate from a state-policy table — verify with the county assessor before closing.
Climate risk First Street
- Flood 1/10 Low FEMA zone X (unshaded) · 0% chance over 30 yrs
- Wildfire 1/10 Low
- Heat 3/10 Moderate 7 d/yr ≥103°F today · 15 d/yr by 30 yrs out
- Wind 2/10 Low
- Air quality 1/10 Low 0 unhealthy d/yr today · 0 by 30 yrs out
Nearby sold comps map
Loading sold comps map…
Walkable amenities ~0.75 mi
Loading nearby amenities…
Taxation est. · year 1
- Rental income
- $23,223
- − Mortgage interest
- −$9,517
- − Property taxes
- −$2,650
- − Insurance
- −$850
- − Repairs & maintenance
- −$1,858
- − Management
- −$1,858
- − HOA
- −$3,540
- − Depreciation
- −$4,943
- Taxable loss
- −$1,991
- Est. tax savings @ 24.0%
- +$478
- After-tax cash flow
- $1,093/yr
For passive investors: Depreciation is non-cash, so a rental often shows a tax loss while cash-flowing — sheltering income. Rental losses are passive: they offset passive income freely, and up to $25,000/yr can offset ordinary (W-2) income if you actively participate and your MAGI is under $100k (phasing out to $0 by $150k); unused losses carry forward. On sale, claimed depreciation is recaptured at up to 25%, and gains may owe capital-gains tax (a 1031 exchange can defer both). Figures are a year-1 estimate at your 24.0% rate — not tax advice; consult a CPA.
Schools (NCES district)
- District
- Waukee Community School District
- NCES district ID
- 1930510
- Math proficiency
- 80% ▼ -6.00%
- Reading proficiency
- 79% ▼ -5.00%
- Median HH income
- $88,580
- Composite
- 70.94/100
- National rank
- #245
- State rank
- #14 of 289 in IA
Livability — West Des Moines
- Score
- 87/100
- State rank
- #11
- US rank
- #336
Category grades
Schools grade is shown separately in the Schools card above.
Census & demographics
- Census place
- West Des Moines, IA
- County
- Dallas County · 77,082 people
- City population
- 71,011
- Metro
- Des Moines-West Des Moines, IA
- Population (ZIP)
- 37,523
- Household income
- $87,025
- Rent vs Own
- Severe rent burden
- 1561.0
Population outlook (Dallas County) Hauer SSP2
- Today (2025)
- 111,904 people
- By 2030
- 127,807 · +14.2%
- By 2040
- 160,576 · +43.5%
- By 2050
- 194,154 · +73.5%
- By 2075
- 271,895 · +143.0%
- By 2100
- 326,525 · +191.8%
Race, ethnicity, and origin ACS 2023
- Neighborhood character
- Predominantly White (80%)
- Race & ethnicity
- White 80% Asian 8% Two or more races 6% Hispanic / Latino 5% Black 3%
- Hispanic origin (detail)
- Mexican 3%
- Common ancestry
- Portuguese 5% Italian 3% Iranian 2%
- Foreign-born
- 12% · Canada, South Korea, Vietnam
- Languages at home
- 86% English-only · Spanish 4% Other Asian/Pacific 3% Other Indo-European 2%
Political lean MEDSL · Dallas
- 2024 margin
- Toss-up / Even · D 46.9% · R 51.7% · Other 1.4%
- 2008→2024 swing
- +0.8pp no change · 2008: -5.5pp · 2024: -4.8pp
- All cycles
- 2024: R+4.8 2020: R+2.0 2016: R+9.6 2012: R+11.8 2008: R+5.5
Not yet ingested
- Civics
- —
Market trends
- HPI YoY
- ▼ -43.24%
- Current HPI
- 203.6979
- Rent YoY
- ▲ 1.94%
- Metro
- Des Moines-West Des Moines, IA
- State GDP YoY
- ▲ 2.48%
- F500 in state
- 4
Industry mix (Fortune 500 HQ in IA)
| Industry | F500 HQs | Revenue |
|---|---|---|
| Financial Services | 1 | $16B |
|
||
| Retail / Convenience | 1 | $15B |
|
||
Price history
+33.3% since first listed8 events — show timeline
- 2026-06-18 Listed $169,900 DMMLS
- 2016-04-01 Listing Removed — DMMLS
- 2015-06-30 Listed $114,000 DMMLS
- 2014-06-19 Sold (MLS) $90,000 DMMLS
- 2014-02-21 Listed $89,000 DMMLS
- 2007-07-03 Sold (Public Records) $121,000 Public Records
- 2007-06-29 Sold (MLS) $121,000 DMMLS
- 2007-06-01 Listed $127,500 DMMLS
Property tax history
+3.0%/yrLatest (2025): $2,650 · +1.9% YoY. Source: county tax records.
Cash-flow waterfall
monthlySold comps — $/sqft
last 12 mo · ≤1 miLoading sold comps…