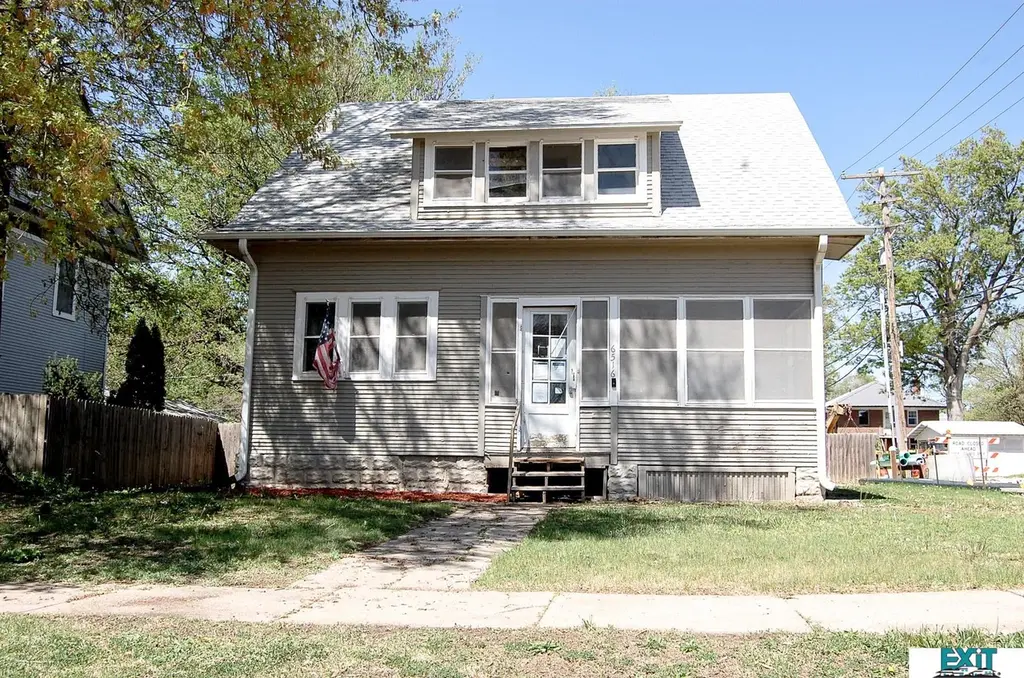
6516 Aylesworth Ave · Lincoln, NE
Flood risk 1/10 · Minimal
- FEMA flood zone
- X (unshaded)
- Chance of flooding over 30 yrs
- 0.0%
- Est. flood insurance / yr
- $473 – $860
Fire risk 1/10 · Minimal
- Est. fire insurance / yr
- $1,161 – $2,155
Heat risk 3/10 · Minor
- Hot days now (above 104°F)
- 7 days/yr
- Hot days in 30 yrs
- 16 days/yr
Wind risk 2/10 · Minimal
- Chance of severe wind over 30 yrs
- —
Air-quality risk 1/10 · Minimal
- Unhealthy air days now
- 0 days/yr
- Unhealthy air days in 30 yrs
- 0 days/yr
Risk factors via First Street. Map © Google.
Why this score? — see what drove the B+ grade
The composite is a weighted blend of 9 inputs, each scored 0–100. Each bar is that input's sub-score; the figure is the points it added to the 100-point composite (weight × sub-score).
- Cash flow +30.0/30.0
- ARV discount +15.0/15.0
- DSCR +10.0/10.0
- 1% rule +9.1/10.0
- Schools +4.4/10.0
- Livability +4.2/5.0
- Rent growth +3.5/5.0
- Condition / age +2.5/5.0
- Appreciation +0.0/10.0
$123,900
🖨 Deal sheet 📄 Offer letter ✓ Due diligence
Listing remarks MLS
Wonderful home in the Northeast Lincoln Area. Prior to my seller purchasing this home, it was owned by the same family for about 90 years. What a great location that is close to shopping, schools and churches. This home offer the new owners 4 bedrooms, 2 bathroom areas, enclosed front porch, second floor enclosed balcony, inside and outside painted in the last couple years. and a large kitchen. Outside you will see 12 new windows, alley access, street parking, large yard and a parking slab for your vehicles. Call and set up your appointment today!!!
Key facts
- Big backyard
- Second-floor office
- Large lot
Tags
Property features AI
Exterior
- Parking: No garage
- Utilities: Public water; Public sewer
- Home design: Single-family residence; One and one half stories; Built in 1920; Not new
- Construction: Block foundation
- Exterior features: Front porch; Lot approximately 0.24 acre (70 x 150)
Interior
- Bedrooms: Master bedroom on 2nd floor; Second bedroom on 2nd floor; Third bedroom on main floor
- Bathrooms: Two total bathrooms (one full, one half); One main-level bathroom
- Heating & cooling: Natural gas forced-air heating; Central air conditioning
- Interior features: Unfinished basement (partially below grade); No fireplaces
Neighborhood map
What this means for you Summary
Snapshot
- This is a 3-bed/2.0-bath single-family listed at $124k.
Deal economics
- At list price, monthly cash flow is $481 ($6k/yr) — positive.
- The deal already cash-flows at list — no discount required.
- Meets the 1% rule at list price ($2k rent vs $124k).
- Recommended offer: $120k (3.0% below list) — sets the bar for market timing.
- Cap rate 11.0% vs local median 3.0% in Lincoln — top-decile yield for the area; either an underpriced asset or a hidden risk that comps aren't pricing in. Stress-test before assuming the spread holds.
Location & tenants
- Location reads 85/100 on livability (#5 in NE, #545 nationally) — a professional / high-income tenant draw. Strengths: amenities A+, cost of living A+, housing A+; Watch: crime D+.
- Lincoln Public Schools (urban): math 50% / reading 53% proficiency, ranked #59 of 111 in NE (top 53%) — acceptable for families but not a draw, mixed tenant base, ~2y average lease.
- Zoned schools: Brownell Elementary School (math 37% / reading 52%, grade F, #289 of 502 statewide, top 63%, 337 students, 68% FRL); Mickle Middle School (math 53% / reading 55%, grade B-, #38 of 128 statewide, top 31%, 694 students, 46% FRL); Lincoln Northeast High School (math 34% / reading 36%, grade F, #207 of 261 statewide, top 79%, 1,812 students, 62% FRL) — zoned schools average 59% FRL vs 37% district-wide (22 pts higher); higher-poverty schools than district average — tighter screening recommended.
- Market conditions: Rents rising (+3.8%/yr); 78 active listings in the ZIP; 16 comparable units currently listed for rent nearby; rentals at typical pace (median 21d on market — plan ~3-4 weeks tenant-placement turnaround); 44% of comp listings sitting > 30 days — soft ceiling on asking rent; solid renter incomes; 1,940 units permitted in Lancaster County in 2024 (895 in 5+ unit buildings).
Forward outlook
- Local home prices are declining (-3.0%/yr); year-one equity from $857 of loan paydown is wiped out by about $4k of value loss. Plan a longer hold.
- Lancaster County population projected at +37% by 2050 — long-run rental-demand tailwind backs the buy-and-hold thesis.
- At projected returns (-3.0% appreciation + 3.8% rent growth), your $35k cash investment doubles in ~7 years — after that, you're playing with house money.
Negotiation context
- It's been on market 35 days — a 3% lower offer ($120k) is reasonable based on typical stale-listing flexibility.
- 2 sale attempts since 8y ago with the ask held roughly flat each time — persistent listings suggest the price (not the market) is what's stuck; bring a comps-based counter.
Risks & watch-outs
- Watch-outs: built in 1920 — expect roof / HVAC / electrical / plumbing capex.
Questions for the listing agent
- It's been on market 35 days. Have you received any prior offers? Is the seller open to a 3% concession, seller financing, or rate buy-down credit?
- Built in 1920 — when were the roof, HVAC, electrical panel, plumbing, and water heater last replaced?
- Is there a deadline driving the sale (1031 exchange, divorce, estate, relocation)? That informs how much negotiation room exists.
- Schools are A-rated — typically a magnet for longer-tenancy family renters. What's the average tenant stay here, and is there a school-zone premium baked into asking?
- Crime grade is D in this area — have there been break-ins, vandalism, or insurance claims at this property in the last 3 years? What carrier currently insures it and at what premium?
- What's the average days-on-market for RENTAL listings here right now (not sales)? A rising rental-DOM trend means longer vacancies and softer asking-rent achievability than the comps imply.
- What's the recent tenant-quality profile in this submarket — average credit score on applications, eviction rate, late-payment / NSF rate, and stable-employment percentage? A property-management company in the area should have these aggregated.
- How much new for-sale + rental construction is in the pipeline within 1–3 miles? Heavy new supply typically softens prices + rents 12–24 months out; constrained supply supports both.
Investment metrics
- 1% rule
- 1.41% ✓
- Cap rate
- 10.96%
- Cash-on-cash
- 16.65%
- DSCR
- 1.74
- GRM
- 5.9
CMA / ARV
- ARV (median comp)
- $242,915
- List price
- $123,900
- Delta
- -48.99%
- Verdict
- UNDERPRICED
- Comps
- 20 within 1.0 mi
Show comp detail 12 sales within ~0.75 mi
| Address | Dist | Beds/Ba | Sqft | Sold | Price | $/sf | Match |
|---|---|---|---|---|---|---|---|
| 908 N 65th St | 0.55mi | 3/2.0 | 1,686 (-1%) | 2mo | $272,000 | $161 | 71 |
| 7311 Garland St | 0.60mi | 3/2.0 | 1,669 (-2%) | 3mo | $250,000 | $150 | 66 |
| 1820 N 62nd St | 0.28mi | 3/2.0 | 1,500 (-12%) | 2mo | $226,000 | $151 | 65 |
| 6730 Y St | 0.45mi | 3/2.0 | 1,842 (+8%) | 2mo | $245,000 | $133 | 64 |
| 6120 Holdrege St | 0.35mi | 3/2.0 | 1,464 (-14%) | 1mo | $253,000 | $173 | 59 |
| 7211 Dudley Ave | 0.58mi | 3/2.0 | 1,843 (+8%) | 1mo | $316,000 | $171 | 58 |
| 1401 N 61st St | 0.41mi | 2/2.0 (-1) | 1,526 (-10%) | 1mo | $265,000 | $174 | 58 |
| 1617 Hays Dr | 0.57mi | 3/2.0 | 1,545 (-9%) | 1mo | $252,500 | $163 | 57 |
| 949 N 68th St | 0.56mi | 3/2.0 | 1,515 (-11%) | 2mo | $245,000 | $162 | 54 |
| 7320 Starr St | 0.61mi | 2/2.0 (-1) | 1,516 (-11%) | 2mo | $251,001 | $166 | 46 |
| 6018 Baldwin Ave | 0.68mi | 3/1.0 | 1,502 (-12%) | 2mo | $176,000 | $117 | 43 |
| 7350 Colby St | 0.62mi | 4/3.0 (+1) | 1,908 (+12%) | 2mo | $261,000 | $137 | 40 |
Match score weights: distance 35% · size 25% · config 20% · recency 20%. Top-matched comps best support the ARV.
Projected returns pro-forma
-3.0% appreciation · 3.81% rent growth · sell at horizon
- IRR
- 8.8%
- Equity multiple
- 1.35×
- Total profit
- $12,075
- Equity at exit
- $18,474
- IRR
- 18.7%
- Equity multiple
- 2.62×
- Total profit
- $56,207
- Equity at exit
- $10,713
Cash invested: $34,692 (down + closing). Projections, not guarantees.
Landlord ↔ Tenant lean methodology
- Overall (STATE)
- 83 Strongly Landlord-Friendly
- State Nebraska
- 83 Strongly Landlord-Friendly · R+13
- County
- — inherits STATE
- City
- — inherits STATE
ZIP-level market 68505
- Rents YoY
- 3.8%
- Active inventory
- 78
- Price-to-rent
- 5.9×
Monthly cashflow live
- Estimated rent
- $1,749 high interval (Pro) →
- Mortgage (P&I)
- −$650
- Tax from tax record
- −$199 /mo · $2,385/yr
- Insurance
- −$52
- HOA
- −$0
- Vacancy / Maint / Mgmt
- −$367
- Net cashflow
- $481
Break-even live
UW: 25.0% down · 7.5% · 30yr · 1.5% tax · 5.0% vac · 8.0% maint · 8.0% mgmt
Financing live
Cash to close
- Down payment
- $30,975
- Closing costs
- $3,717
- Reserves months
- —
- Total cash needed
- —
Loan-product check · same deal, 3 products live
Conventional
25% down · 7.5% · 30yr
- Down + closing
- —
- Monthly P&I
- —
- Monthly cashflow
- —
- DSCR
- —
- Eligible?
- —
Personal DTI + credit; lowest rate.
DSCR
20% down · 8.5% · 30yr
- Down + closing
- —
- Monthly P&I
- —
- Monthly cashflow
- —
- DSCR
- —
- Eligible?
- —
No personal income docs; deal must DSCR.
Hard money
10% down · 12.0% · 12mo
- Down + closing
- —
- Monthly P&I
- —
- Monthly cashflow
- —
- DSCR
- —
- Eligible?
- —
Short-term bridge; refi at stabilization.
Rent comps 16 comps
| Address | Beds | Baths | Sqft | Rent | $/sqft | DOM | Units | Dist |
|---|---|---|---|---|---|---|---|---|
| 2210 Mirwyn Ct Lincoln, NE | 3.0 | 3.0 | 1748 | $2,000 | $1.14 | 13d | 1 | 0.38mi |
| 2228 Mirwyn Ct Lincoln, NE | 3.0 | 3.0 | 1748 | $2,200 | $1.26 | 43d | 1 | 0.40mi |
| 1025 N 63rd St Lincoln, NE | 1.0–3.0 | 1.0–2.0 | 1157 | $1,590 | $1.37 | 13d | 7 | 0.56mi |
| 2840 N Cotner Blvd Unit 1 Lincoln, NE | 3.0 | 1.0 | 1450 | $1,425 | $0.98 | 43d | 1 | 0.76mi |
| 4904 Holdrege St Lincoln, NE | 2.0 | 1.0 | 1282 | $1,299 | $1.01 | 43d | 1 | 1.12mi |
| 1648 Sawyer St Lincoln, NE | 3.0 | 2.5 | 1547 | $1,899 | $1.23 | 43d | 1 | 1.14mi |
| 4910 Dudley St Unit 2 Lincoln, NE | 3.0 | 2.0 | 1073 | $1,250 | $1.16 | 21d | 1 | 1.14mi |
| 4800 Holdrege St Lincoln, NE | 2.0 | 1.0–2.0 | 806 | $1,625 | $2.01 | 13d | 88 | 1.18mi |
| 5101 Vine St Lincoln, NE | 1.0–2.0 | 1.0–2.0 | 886 | $1,370 | $1.55 | 13d | 18 | 1.18mi |
| 225 N Cotner Blvd Lincoln, NE | 2.0 | 1.0–2.0 | 791 | $1,895 | $2.39 | 13d | 25 | 1.19mi |
| 8229 Northwoods Dr Lincoln, NE | 1.0–2.0 | 1.0–2.0 | 935 | $1,649 | $1.76 | 3d | 5 | 1.23mi |
| 4630 Starr St Unit 4630 Lincoln, NE | 3.0 | 1.0 | 1460 | $1,250 | $0.86 | 43d | 1 | 1.30mi |
| 4529 Holdrege St Lincoln, NE | 3.0 | 2.0 | 1100 | $1,250 | $1.14 | 43d | 1 | 1.35mi |
| 4842 Adams St Unit 2 Lincoln, NE | 4.0 | 2.5 | 1764 | $2,095 | $1.19 | 43d | 1 | 1.44mi |
| 4602 Saint Paul Ave Unit 3 Lincoln, NE | 4.0 | 1.0 | 1344 | $1,550 | $1.15 | 13d | 1 | 1.47mi |
| 8600 Leighton Ave Lincoln, NE | 1.0–3.0 | 1.0–2.0 | 1144 | $1,300 | $1.14 | 1d | 1 | 1.50mi |
Listing history 17 events
-
2026-06-14status $123,900 Pending 35 DOM
-
2026-06-10days on market $123,900 Active 35 DOM
-
2026-06-09days on market $123,900 Active 34 DOM
-
2026-06-08days on market $123,900 Active 33 DOM
-
2026-06-07days on market $123,900 Active 32 DOM
-
2026-06-05days on market $123,900 Active 29 DOM
-
2026-06-03days on market $123,900 Active 28 DOM
-
2026-06-02days on market $123,900 Active 27 DOM
-
2026-06-01days on market $123,900 Active 26 DOM
-
2026-05-31days on market $123,900 Active 25 DOM
-
2026-05-30days on market $123,900 Active 24 DOM
-
2026-05-06$123,900 New 616-char remark
-
2021-10-28soldstatus $119,000
-
2018-09-05soldstatus $123,000
-
2018-08-31soldstatus $122,500 555-char remark
Show marketing remark (555 chars)
Wonderful home in the Northeast Lincoln Area. Prior to my seller purchasing this home, it was owned by the same family for about 90 years. What a great location that is close to shopping, schools and churches. This home offer the new owners 4 bedrooms, 2 bathroom areas, enclosed front porch, second floor enclosed balcony, inside and outside painted in the last couple years. and a large kitchen. Outside you will see 12 new windows, alley access, street parking, large yard and a parking slab for your vehicles. Call and set up your appointment today!!!
-
2018-07-21historical 555-char remark
Show marketing remark (555 chars)
Wonderful home in the Northeast Lincoln Area. Prior to my seller purchasing this home, it was owned by the same family for about 90 years. What a great location that is close to shopping, schools and churches. This home offer the new owners 4 bedrooms, 2 bathroom areas, enclosed front porch, second floor enclosed balcony, inside and outside painted in the last couple years. and a large kitchen. Outside you will see 12 new windows, alley access, street parking, large yard and a parking slab for your vehicles. Call and set up your appointment today!!!
-
2018-07-16$129,900 555-char remark
Show marketing remark (555 chars)
Wonderful home in the Northeast Lincoln Area. Prior to my seller purchasing this home, it was owned by the same family for about 90 years. What a great location that is close to shopping, schools and churches. This home offer the new owners 4 bedrooms, 2 bathroom areas, enclosed front porch, second floor enclosed balcony, inside and outside painted in the last couple years. and a large kitchen. Outside you will see 12 new windows, alley access, street parking, large yard and a parking slab for your vehicles. Call and set up your appointment today!!!
ⓘ Source: listings_history table (triggers on properties + properties_extension) + one-shot
backfill from property_details.listing_events for pre-trigger history.
Tax reassessment forecast NE · Resets to sale price
- Current annual tax
- $2,385 · $199/mo
- Projected year-2 tax
- $2,385 · $199/mo
- Expected delta
- $0/yr ($0/mo · 0.0%)
ⓘ Screening estimate from a state-policy table — verify with the county assessor before closing.
Climate risk First Street
- Flood 1/10 Low FEMA zone X (unshaded) · 0% chance over 30 yrs
- Wildfire 1/10 Low
- Heat 3/10 Moderate 7 d/yr ≥104°F today · 16 d/yr by 30 yrs out
- Wind 2/10 Low
- Air quality 1/10 Low 0 unhealthy d/yr today · 0 by 30 yrs out
Nearby sold comps map
Loading sold comps map…
Walkable amenities ~0.75 mi
Loading nearby amenities…
Taxation est. · year 1
- Rental income
- $20,985
- − Mortgage interest
- −$6,940
- − Property taxes
- −$2,385
- − Insurance
- −$620
- − Repairs & maintenance
- −$1,679
- − Management
- −$1,679
- − Depreciation
- −$3,604
- Taxable income
- $4,079
- Est. tax owed @ 24.0%
- −$979
- After-tax cash flow
- $4,798/yr
For passive investors: Depreciation is non-cash, so a rental often shows a tax loss while cash-flowing — sheltering income. Rental losses are passive: they offset passive income freely, and up to $25,000/yr can offset ordinary (W-2) income if you actively participate and your MAGI is under $100k (phasing out to $0 by $150k); unused losses carry forward. On sale, claimed depreciation is recaptured at up to 25%, and gains may owe capital-gains tax (a 1031 exchange can defer both). Figures are a year-1 estimate at your 24.0% rate — not tax advice; consult a CPA.
Schools (NCES district)
- District
- Lincoln Public Schools
- NCES district ID
- 3172840
- Math proficiency
- 50% ▼ -6.00%
- Reading proficiency
- 53% ▼ -3.00%
- Median HH income
- $50,273
- Composite
- 44.05/100
- National rank
- #2880
- State rank
- #59 of 111 in NE
Livability — Lincoln
- Score
- 85/100
- State rank
- #5
- US rank
- #545
Category grades
Schools grade is shown separately in the Schools card above.
Census & demographics
- Census place
- Lincoln, NE
- County
- Lancaster County · 291,509 people
- City population
- 291,509
- Metro
- Lincoln, NE
- Population (ZIP)
- 18,834
- Household income
- $75,980
- Rent vs Own
- Severe rent burden
- 436.0
Population outlook (Lancaster County) Hauer SSP2
- Today (2025)
- 352,806 people
- By 2030
- 377,899 · +7.1%
- By 2040
- 428,582 · +21.5%
- By 2050
- 483,103 · +36.9%
- By 2075
- 632,390 · +79.2%
- By 2100
- 759,513 · +115.3%
Race, ethnicity, and origin ACS 2023
- Neighborhood character
- Predominantly White (82%)
- Race & ethnicity
- White 82% Two or more races 7% Hispanic / Latino 6% Asian 4% Black 3% Native American 1%
- Hispanic origin (detail)
- Mexican 4%
- Common ancestry
- Romanian 2% Lithuanian 2% Iranian 1%
- Foreign-born
- 7% · Canada, Vietnam, China
- Languages at home
- 89% English-only · Spanish 3% Arabic 2% Vietnamese 2%
Political lean MEDSL · Lancaster
- 2024 margin
- Toss-up / Even · D 51.4% · R 47.1% · Other 1.5%
- 2008→2024 swing
- -0.7pp no change · 2008: 5.0pp · 2024: 4.3pp
- All cycles
- 2024: D+4.3 2020: D+7.8 2016: D+0.1 2012: R+1.0 2008: D+5.0
Not yet ingested
- Civics
- —
Market trends
- HPI YoY
- ▼ -160.23%
- Current HPI
- 246.1127
- Rent YoY
- ▲ 3.81%
- Metro
- Lincoln, NE
- State GDP YoY
- ▲ 0.68%
- F500 in state
- 2
Industry mix (Fortune 500 HQ in NE)
| Industry | F500 HQs | Revenue |
|---|---|---|
| Conglomerate | 1 | $371B |
|
||
Price history
-4.6% since first listed7 events — show timeline
- 2026-06-10 Pending — GPRMLS
- 2026-05-06 Listed $123,900 GPRMLS
- 2021-10-28 Sold (Public Records) $119,000 Public Records
- 2018-09-05 Sold (Public Records) $123,000 Public Records
- 2018-08-31 Sold (MLS) $122,500 GPRMLS
- 2018-07-21 Listing Removed — GPRMLS
- 2018-07-16 Listed $129,900 GPRMLS
Property tax history
+2.6%/yrLatest (2025): $2,385 · +7.0% YoY. Source: county tax records.
Cash-flow waterfall
monthlySold comps — $/sqft
last 12 mo · ≤1 miLoading sold comps…