27241 Long St · Patton Village, TX
Flood risk 3/10 · Minor
- FEMA flood zone
- X (unshaded)
- Chance of flooding over 30 yrs
- 0.2%
- Est. flood insurance / yr
- $507 – $1,088
Fire risk 4/10 · Minor
- Est. fire insurance / yr
- $1,222 – $2,270
Heat risk 8/10 · Major
- Hot days now (above 111°F)
- 7 days/yr
- Hot days in 30 yrs
- 24 days/yr
Wind risk 8/10 · Major
- Chance of severe wind over 30 yrs
- 99.0%
Air-quality risk 2/10 · Minimal
- Unhealthy air days now
- 1 days/yr
- Unhealthy air days in 30 yrs
- 2 days/yr
Risk factors via First Street. Map © Google.
Why this score? — see what drove the C grade
The composite is a weighted blend of 9 inputs, each scored 0–100. Each bar is that input's sub-score; the figure is the points it added to the 100-point composite (weight × sub-score).
- Cash flow +25.0/30.0
- ARV discount +8.5/15.0
- DSCR +8.2/10.0
- 1% rule +5.5/10.0
- Livability +3.1/5.0
- Rent growth +2.5/5.0
- Schools +2.5/10.0
- Condition / age +2.5/5.0
- Appreciation +1.8/10.0
$219,900
🖨 Deal sheet 📄 Offer letter ✓ Due diligence
Listing remarks MLS
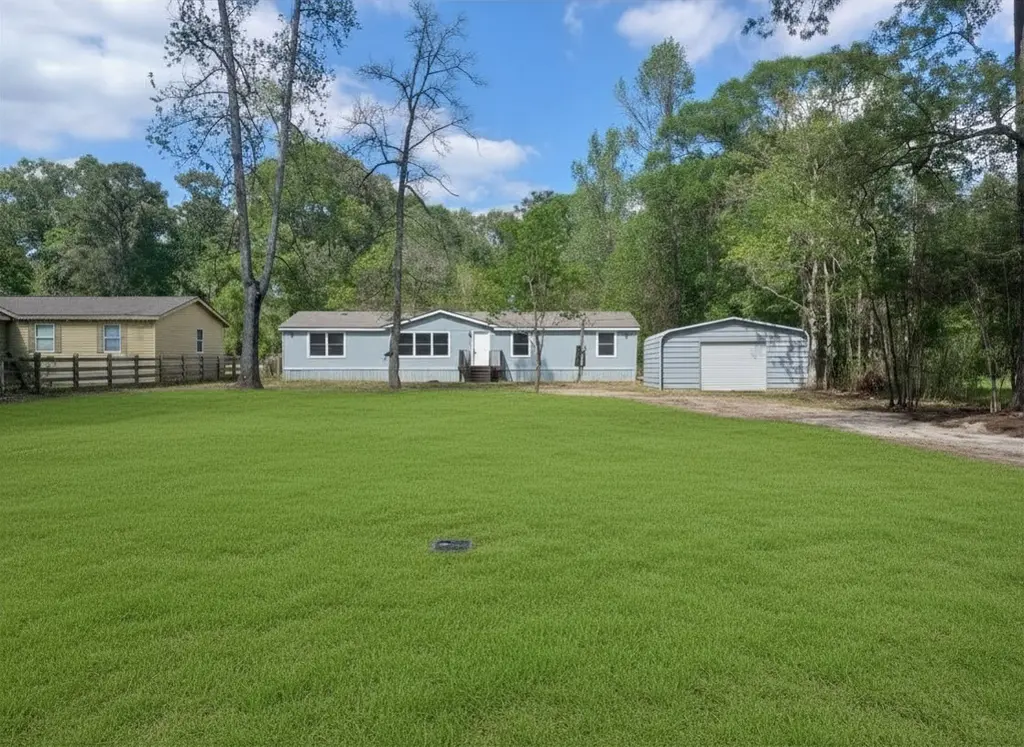
Renovated mobile home featuring 4 bedrooms and 2 bathrooms, situated on a spacious unrestricted 1-acre lot in Splendora. Updates include New paint and new vinyl plank flooring throughout. Kitchen has all new quartz countertops, and brand new all stainless steel appliances... New hardware and fixtures. All bedroom have new carpet and all bathroom have been updated with modern features and even have the same quartz countertops that match the the kitchen. Large lot with plenty of space perfect for everyday living and entertaining. Peaceful country living! With easy access to Highway 59. Don’t miss this rare opportunity to own land in one of Splendora’s most desirable areas, schedule your showing today and envision the possibilities that await!
Key facts
- Modern features
- 0.92 acre lot
- Garage
Tags
Neighborhood map
What this means for you Summary
Snapshot
- This is a 4-bed/2.0-bath manufactured listed at $220k.
Deal economics
- At list price, monthly cash flow is $482 ($6k/yr) — positive.
- The deal already cash-flows at list — no discount required.
- Meets the 1% rule at list price ($2k rent vs $220k).
- Recommended offer: $207k (6.0% below list) — sets the bar for market timing.
- Cap rate 8.9% vs local median 5.2% in Patton Village — top-decile yield for the area; either an underpriced asset or a hidden risk that comps aren't pricing in. Stress-test before assuming the spread holds.
Location & tenants
- Location reads 61/100 on livability (#977 in TX) — a middle-class / working-renter tenant base. Strengths: crime A+, cost of living A+, housing A+; Watch: schools F, amenities F, commute F.
- Splendora ISD (rural): math 25% / reading 31% proficiency, ranked #648 of 826 in TX (top 78%) — low school quality limits family demand, transient renter base, plan for 1-2y turnover.
- Market conditions: 542 active listings in the ZIP; 5 comparable units currently listed for rent nearby; rentals at typical pace (median 21d on market — plan ~3-4 weeks tenant-placement turnaround); solid renter incomes; 13,259 units permitted in Montgomery County in 2024 (1,402 in 5+ unit buildings).
- This rent runs 35% of the median local income ($79k/yr) — at the standard rent-burdened threshold; future hikes will face affordability resistance.
Forward outlook
- Local home prices are declining (-3.0%/yr); year-one equity from $2k of loan paydown is wiped out by about $7k of value loss. Plan a longer hold.
- Montgomery County population projected at +65% by 2050 — long-run rental-demand tailwind backs the buy-and-hold thesis.
Negotiation context
- It's been on market 83 days — a 6% lower offer ($207k) is reasonable based on typical stale-listing flexibility.
Risks & watch-outs
- Climate carrying-cost: severe wind risk, 99% chance of damaging wind over 30y; extreme-heat days projected 7→24/yr by 2055 (HVAC capex compounding) — expect insurance premiums to compound above CPI over the hold.
Questions for the listing agent
- It's been on market 83 days. Have you received any prior offers? Is the seller open to a 6% concession, seller financing, or rate buy-down credit?
- Why hasn't it sold? Are there any deal-killer items the seller is aware of (foundation, flood, title, zoning, code violations)?
- Is there a deadline driving the sale (1031 exchange, divorce, estate, relocation)? That informs how much negotiation room exists.
- Schools are F-rated, which usually means shorter tenancies and higher turnover. Who's the typical renter profile here, and what's been the actual vacancy rate?
- What's the average days-on-market for RENTAL listings here right now (not sales)? A rising rental-DOM trend means longer vacancies and softer asking-rent achievability than the comps imply.
- What's the recent tenant-quality profile in this submarket — average credit score on applications, eviction rate, late-payment / NSF rate, and stable-employment percentage? A property-management company in the area should have these aggregated.
- How much new for-sale + rental construction is in the pipeline within 1–3 miles? Heavy new supply typically softens prices + rents 12–24 months out; constrained supply supports both.
Investment metrics
- 1% rule
- 1.05% ✓
- Cap rate
- 8.92%
- Cash-on-cash
- 9.39%
- DSCR
- 1.42
- GRM
- 8.0
CMA / ARV
- ARV (median comp)
- $224,949
- List price
- $219,900
- Delta
- -2.24%
- Verdict
- FAIR
- Comps
- 4 within 1.0 mi
Show comp detail 1 sale within ~0.75 mi
| Address | Dist | Beds/Ba | Sqft | Sold | Price | $/sf | Match |
|---|---|---|---|---|---|---|---|
| 26968 Short St | 0.38mi | 3/2.0 (-1) | 1,920 (+4%) | 5mo | $299,900 | $156 | 66 |
Match score weights: distance 35% · size 25% · config 20% · recency 20%. Top-matched comps best support the ARV.
Projected returns pro-forma
-3.0% appreciation · 3.0% rent growth · sell at horizon
- IRR
- -2.2%
- Equity multiple
- 0.92×
- Total profit
- $-5,010
- Equity at exit
- $32,788
- IRR
- 7.5%
- Equity multiple
- 1.57×
- Total profit
- $34,858
- Equity at exit
- $19,013
Cash invested: $61,572 (down + closing). Projections, not guarantees.
Landlord ↔ Tenant lean methodology
- Overall (STATE)
- 87 Strongly Landlord-Friendly
- State Texas
- 87 Strongly Landlord-Friendly · R+5
- County
- — inherits STATE
- City
- — inherits STATE
ZIP-level market 77372
- Home prices YoY
- -2.1%
- Active inventory
- 542
- Price-to-rent
- 8.0×
Monthly cashflow live
- Estimated rent
- $2,305 high interval (Pro) →
- Mortgage (P&I)
- −$1,153
- Tax from tax record
- −$94 /mo · $1,129/yr
- Insurance
- −$92
- HOA
- −$0
- Vacancy / Maint / Mgmt
- −$484
- Net cashflow
- $482
Break-even live
UW: 25.0% down · 7.5% · 30yr · 1.5% tax · 5.0% vac · 8.0% maint · 8.0% mgmt
Financing live
Cash to close
- Down payment
- $54,975
- Closing costs
- $6,597
- Reserves months
- —
- Total cash needed
- —
Loan-product check · same deal, 3 products live
Conventional
25% down · 7.5% · 30yr
- Down + closing
- —
- Monthly P&I
- —
- Monthly cashflow
- —
- DSCR
- —
- Eligible?
- —
Personal DTI + credit; lowest rate.
DSCR
20% down · 8.5% · 30yr
- Down + closing
- —
- Monthly P&I
- —
- Monthly cashflow
- —
- DSCR
- —
- Eligible?
- —
No personal income docs; deal must DSCR.
Hard money
10% down · 12.0% · 12mo
- Down + closing
- —
- Monthly P&I
- —
- Monthly cashflow
- —
- DSCR
- —
- Eligible?
- —
Short-term bridge; refi at stabilization.
Rent comps 5 comps
| Address | Beds | Baths | Sqft | Rent | $/sqft | DOM | Units | Dist |
|---|---|---|---|---|---|---|---|---|
| 2407 S Colosseum Ct New Caney, TX | 4.0 | 3.0 | 2074 | $3,300 | $1.59 | 43d | 1 | 0.95mi |
| 25687 Roy Rogers Ct Splendora, TX | 4.0 | 2.5 | 1968 | $1,983 | $1.01 | 10d | 1 | 1.25mi |
| 25687 Roy Rogers Ct Splendora, TX | 4.0 | 3.0 | 1607 | $1,895 | $1.18 | 4d | 1 | 1.25mi |
| 634 Magnolia Bnd New Caney, TX | 3.0 | 2.5 | 1450 | $1,485 | $1.02 | 20d | 1 | 1.26mi |
| 630 Magnolia Bnd Roman Forest, TX | 3.0 | 2.5 | 1450 | $1,545 | $1.07 | 24d | 1 | 1.27mi |
Listing history 17 events
-
2026-06-18days on market $219,900 Active 83 DOM
-
2026-06-17days on market $219,900 Active 82 DOM
-
2026-06-16days on market $219,900 Active 81 DOM
-
2026-06-15days on market $219,900 Active 80 DOM
-
2026-06-13days on market $219,900 Active 78 DOM
-
2026-06-13days on market $219,900 Active 77 DOM
-
2026-06-09days on market $219,900 Active 74 DOM
-
2026-06-08days on market $219,900 Active 73 DOM
-
2026-06-07days on market $219,900 Active 72 DOM
-
2026-06-04days on market $219,900 Active 69 DOM
-
2026-06-03days on market $219,900 Active 68 DOM
-
2026-06-02days on market $219,900 Active 67 DOM
-
2026-06-01days on market $219,900 Active 66 DOM
-
2026-05-31days on market $219,900 Active 65 DOM
-
2026-03-27$219,900 Active 765-char remark
Show marketing remark (765 chars)
Renovated mobile home featuring 4 bedrooms and 2 bathrooms, situated on a spacious unrestricted 1-acre lot in Splendora. Updates include New paint and new vinyl plank flooring throughout. Kitchen has all new quartz countertops, and brand new all stainless steel appliances... New hardware and fixtures. All bedroom have new carpet and all bathroom have been updated with modern features and even have the same quartz countertops that match the the kitchen. Large lot with plenty of space perfect for everyday living and entertaining. Peaceful country living! With easy access to Highway 59. Don’t miss this rare opportunity to own land in one of Splendora’s most desirable areas, schedule your showing today and envision the possibilities that await!
-
2025-11-26soldstatus
-
2025-05-09soldstatus
ⓘ Source: listings_history table (triggers on properties + properties_extension) + one-shot
backfill from property_details.listing_events for pre-trigger history.
Tax reassessment forecast TX · Resets to sale price
- Current annual tax
- $1,129 · $94/mo
- Projected year-2 tax
- $4,024 · $335/mo
- Expected delta
- +$2,895/yr (+$241/mo · 256.5%)
ⓘ Screening estimate from a state-policy table — verify with the county assessor before closing.
Climate risk First Street
- Flood 3/10 Moderate FEMA zone X (unshaded) · 20% chance over 30 yrs
- Wildfire 4/10 Moderate
- Heat 8/10 Severe 7 d/yr ≥111°F today · 24 d/yr by 30 yrs out
- Wind 8/10 Severe 99% chance of damaging wind over 30 yrs
- Air quality 2/10 Low 1 unhealthy d/yr today · 2 by 30 yrs out
Nearby sold comps map
Loading sold comps map…
Walkable amenities ~0.75 mi
Loading nearby amenities…
Taxation est. · year 1
- Rental income
- $27,659
- − Mortgage interest
- −$12,318
- − Property taxes
- −$1,129
- − Insurance
- −$1,100
- − Repairs & maintenance
- −$2,213
- − Management
- −$2,213
- − Depreciation
- −$6,397
- Taxable income
- $2,290
- Est. tax owed @ 24.0%
- −$550
- After-tax cash flow
- $5,234/yr
For passive investors: Depreciation is non-cash, so a rental often shows a tax loss while cash-flowing — sheltering income. Rental losses are passive: they offset passive income freely, and up to $25,000/yr can offset ordinary (W-2) income if you actively participate and your MAGI is under $100k (phasing out to $0 by $150k); unused losses carry forward. On sale, claimed depreciation is recaptured at up to 25%, and gains may owe capital-gains tax (a 1031 exchange can defer both). Figures are a year-1 estimate at your 24.0% rate — not tax advice; consult a CPA.
Schools (NCES district)
- District
- Splendora ISD
- NCES district ID
- 4841070
- Math proficiency
- 25% ▼ -8.00%
- Reading proficiency
- 31% ▼ -1.00%
- Median HH income
- $54,166
- Composite
- 24.92/100
- National rank
- #7572
- State rank
- #648 of 826 in TX
Livability — Patton Village
- Score
- 61/100
- State rank
- #977
- US rank
- #17313
Category grades
Schools grade is shown separately in the Schools card above.
Census & demographics
- Census place
- Patton Village, TX
- County
- Montgomery County · 663,713 people
- Metro
- Houston-The Woodlands-Sugar Land, TX
- Population (ZIP)
- 14,367
- Household income
- $79,085
- Rent vs Own
- Severe rent burden
- 135.0
Population outlook (Montgomery County) Hauer SSP2
- Today (2025)
- 713,896 people
- By 2030
- 805,263 · +12.8%
- By 2040
- 992,708 · +39.1%
- By 2050
- 1,179,590 · +65.2%
- By 2075
- 1,628,084 · +128.1%
- By 2100
- 1,937,880 · +171.5%
Race, ethnicity, and origin ACS 2023
- Neighborhood character
- Majority White (61%)
- Race & ethnicity
- White 61% Hispanic / Latino 36% Two or more races 9% Native American 1%
- Hispanic origin (detail)
- Mexican 32%
- Common ancestry
- Lithuanian 4% Italian 2% Slovak 1%
- Foreign-born
- 9% · Canada
- Languages at home
- 71% English-only · Spanish 28%
Political lean MEDSL · Montgomery
- 2024 margin
- Solid R (+45.5) · D 26.8% · R 72.3%
- 2008→2024 swing
- +7.2pp toward D · 2008: -52.7pp · 2024: -45.5pp
- All cycles
- 2024: R+45.5 2020: R+43.8 2016: R+51.4 2012: R+60.7 2008: R+52.7
Not yet ingested
- Civics
- —
Market trends
- HPI YoY
- ▼ -6.47%
- Current HPI
- 306.9962
- Rent YoY
- —
- Metro
- Houston-The Woodlands-Sugar Land, TX
- State GDP YoY
- ▲ 3.95%
- F500 in state
- 110
Industry mix (Fortune 500 HQ in TX)
| Industry | F500 HQs | Revenue |
|---|---|---|
| Energy | 16 | $1,198B |
|
||
| Technology | 5 | $198B |
|
||
| Engineering / Construction | 4 | $72B |
|
||
| Energy Services | 3 | $60B |
|
||
| Utilities | 3 | $41B |
|
||
| Healthcare | 2 | $330B |
|
||
Price history
3 events — show timeline
- 2026-03-27 Listed $219,900 HARMLS
- 2025-11-26 Sold (Public Records) — Public Records
- 2025-05-09 Sold (Public Records) — Public Records
Property tax history
+7.1%/yrLatest (2025): $1,129 · +9.3% YoY. Source: county tax records.
Cash-flow waterfall
monthlySold comps — $/sqft
last 12 mo · ≤1 miLoading sold comps…