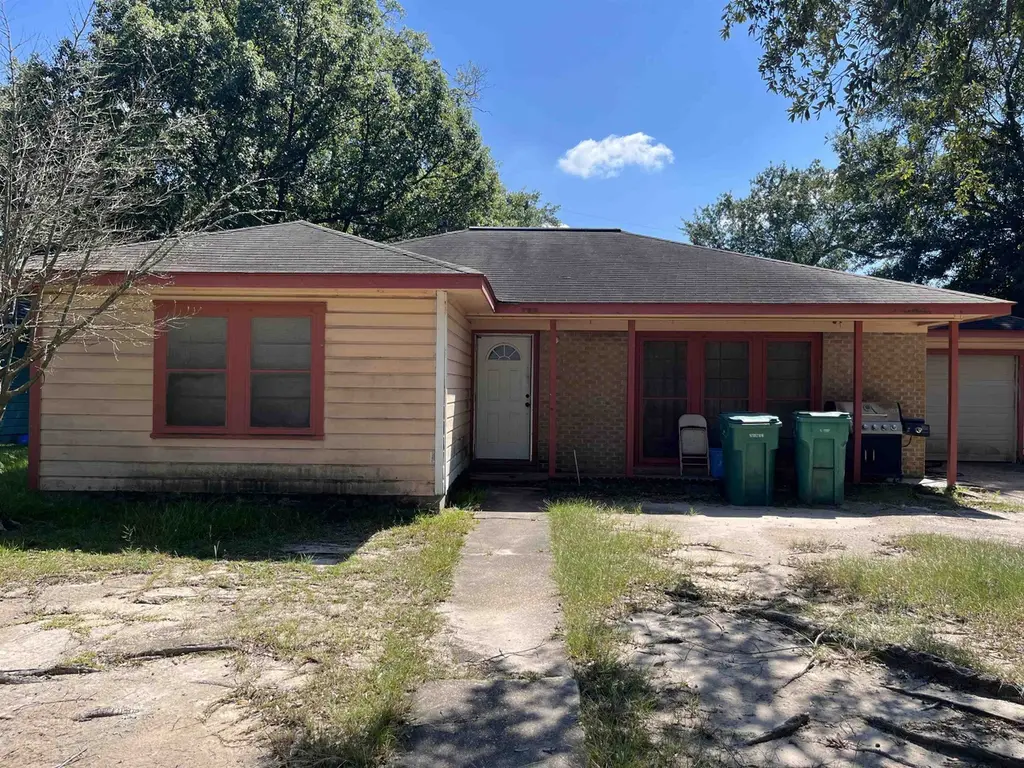
1033 Clairmont Dr · Orange, TX
Flood risk 7/10 · Major
- FEMA flood zone
- X (shaded)
- Chance of flooding over 30 yrs
- 0.71%
- Est. flood insurance / yr
- $507 – $1,088
Fire risk 2/10 · Minimal
- Est. fire insurance / yr
- $1,222 – $2,270
Heat risk 9/10 · Severe
- Hot days now (above 109°F)
- 7 days/yr
- Hot days in 30 yrs
- 23 days/yr
Wind risk 9/10 · Severe
- Chance of severe wind over 30 yrs
- 99.0%
Air-quality risk 3/10 · Minor
- Unhealthy air days now
- 2 days/yr
- Unhealthy air days in 30 yrs
- 3 days/yr
Risk factors via First Street. Map © Google.
Why this score? — see what drove the A- grade
The composite is a weighted blend of 9 inputs, each scored 0–100. Each bar is that input's sub-score; the figure is the points it added to the 100-point composite (weight × sub-score).
- Cash flow +30.0/30.0
- ARV discount +14.6/15.0
- 1% rule +10.0/10.0
- DSCR +10.0/10.0
- Appreciation +5.5/10.0
- Rent growth +3.9/5.0
- Livability +3.6/5.0
- Condition / age +2.5/5.0
- Schools +1.6/10.0
$70,000
🖨 Deal sheet (PDF) 📄 Offer letter ✓ Due diligence
Listing remarks MLS
Calling all investors, visionaries, and handy homeowners! This three-bedroom, one bathroom home with a one car garage and bonus flex room is bursting with potential and ready for your personal touch! Whether you’re looking to renovate and flip, add to your rental portfolio, or create your dream home from the ground up, this property is the perfect canvas. Inside, you’ll find a flexible floor plan, including a versatile bonus room ideal for a home office, game room, or second living area. Situated on a generously sized lot, this is a fantastic opportunity to transform this diamond in the rough into something truly special. Bring your creativity and schedule your showing today! Situated on a generously sized lot with room to expand or landscape, this is a fantastic opportunity for someone with a vision and a toolbox. Whether you’re dreaming of a cozy starter home or your next investment project, this one checks the boxes.
Key facts
- Generously sized lot
- Versatile bonus room
- Garage
Tags
Neighborhood map
What this means for you Summary
Snapshot
- This is a 3-bed/1.0-bath single-family listed at $70k.
Deal economics
- At list price, monthly cash flow is $512 ($6k/yr) — positive.
- The deal already cash-flows at list — no discount required.
- Meets the 1% rule at list price ($1k rent vs $70k).
- Recommended offer: $62k (12.0% below list) — sets the bar for market timing.
- Cap rate 16.2% vs local median 3.9% in Orange — top-decile yield for the area; either an underpriced asset or a hidden risk that comps aren't pricing in. Stress-test before assuming the spread holds.
Location & tenants
- Location reads 71/100 on livability (#286 in TX) — a middle-class / working-renter tenant base. Strengths: cost of living A+, housing A+, health & safety A+; Watch: crime D+, employment D+, schools D-.
- West Orange-Cove CISD (suburban): math 17% / reading 21% proficiency, ranked #784 of 826 in TX (top 95%) — low school quality limits family demand, transient renter base, plan for 1-2y turnover; 79% free/reduced lunch — lower-income household profile, screen leases tightly.
- Market conditions: Rents rising fast (+5.7%/yr); 337 active listings in the ZIP; 15 comparable units currently listed for rent nearby; rentals at typical pace (median 15d on market — plan ~3-4 weeks tenant-placement turnaround); 235 units permitted in Orange County in 2024 (50 in 5+ unit buildings).
Forward outlook
- In year one you build about $1k of equity ($484 loan paydown + $707 appreciation (1.0% local appreciation)).
- Orange County population projected at +6% by 2050 — modest demand growth; plan on rents tracking national, not racing it.
- At projected returns (1.0% appreciation + 5.7% rent growth), your $20k cash investment doubles in ~3 years — after that, you're playing with house money.
Negotiation context
- It's been on market 162 days — a 12% lower offer ($62k) is reasonable based on typical stale-listing flexibility.
Risks & watch-outs
- Watch-outs: property tax is 3.3% of price; flood insurance adds $66/mo; built in 1955 — expect roof / HVAC / electrical / plumbing capex.
- Climate carrying-cost: major flood risk; severe wind risk, 99% chance of damaging wind over 30y; extreme-heat days projected 7→23/yr by 2055 (HVAC capex compounding) — expect insurance premiums to compound above CPI over the hold.
Questions for the listing agent
- It's been on market 162 days. Have you received any prior offers? Is the seller open to a 12% concession, seller financing, or rate buy-down credit?
- Built in 1955 — when were the roof, HVAC, electrical panel, plumbing, and water heater last replaced?
- Property tax is high relative to price — has the assessment been appealed recently, and will the sale trigger a re-assessment?
- What's the actual annual flood-insurance premium (NFIP or private), and is the property in a SFHA with mandatory coverage?
- Why hasn't it sold? Are there any deal-killer items the seller is aware of (foundation, flood, title, zoning, code violations)?
- Is there a deadline driving the sale (1031 exchange, divorce, estate, relocation)? That informs how much negotiation room exists.
- Schools are D-rated, which usually means shorter tenancies and higher turnover. Who's the typical renter profile here, and what's been the actual vacancy rate?
- Crime grade is D in this area — have there been break-ins, vandalism, or insurance claims at this property in the last 3 years? What carrier currently insures it and at what premium?
- What's the average days-on-market for RENTAL listings here right now (not sales)? A rising rental-DOM trend means longer vacancies and softer asking-rent achievability than the comps imply.
- What's the recent tenant-quality profile in this submarket — average credit score on applications, eviction rate, late-payment / NSF rate, and stable-employment percentage? A property-management company in the area should have these aggregated.
- How much new for-sale + rental construction is in the pipeline within 1–3 miles? Heavy new supply typically softens prices + rents 12–24 months out; constrained supply supports both.
Investment metrics
- 1% rule
- 2.11% ✓
- Cap rate
- 16.22%
- Cash-on-cash
- 35.44%
- DSCR
- 2.58
- GRM
- 3.9
CMA / ARV
- ARV (median comp)
- $83,114
- List price
- $70,000
- Delta
- -15.78%
- Verdict
- UNDERPRICED
- Comps
- 20 within 1.0 mi
Show comp detail 4 sales within ~0.75 mi
| Address | Dist | Beds/Ba | Sqft | Sold | Price | $/sf | Match |
|---|---|---|---|---|---|---|---|
| 2241 Cross Ln | 0.20mi | 3/2.0 | 1,571 (+12%) | 1mo | $28,999 | $18 | 66 |
| 2324 Manley Cir | 0.64mi | 3/1.5 | 1,360 (-3%) | 5mo | $129,900 | $96 | 59 |
| 2109 N 3rd St | 0.72mi | 3/2.0 | 1,344 (-4%) | 10mo | $64,500 | $48 | 47 |
| 2001 Rio Grande Pl | 0.45mi | 3/2.0 | 1,539 (+10%) | 20mo | $59,999 | $39 | 42 |
Match score weights: distance 35% · size 25% · config 20% · recency 20%. Top-matched comps best support the ARV.
Projected returns pro-forma
1.01% appreciation · 5.71% rent growth · sell at horizon
- IRR
- 36.7%
- Equity multiple
- 2.95×
- Total profit
- $38,242
- Equity at exit
- $23,933
- IRR
- 40.5%
- Equity multiple
- 6.46×
- Total profit
- $106,987
- Equity at exit
- $31,833
Cash invested: $19,600 (down + closing). Projections, not guarantees.
Landlord ↔ Tenant lean methodology
- Overall (STATE)
- 87 Strongly Landlord-Friendly
- State Texas
- 87 Strongly Landlord-Friendly · R+5
- County
- — inherits STATE
- City
- — inherits STATE
ZIP-level market 77630
- Home prices YoY
- 0.4%
- Rents YoY
- 5.7%
- Active inventory
- 337
- Price-to-rent
- 3.9×
Monthly cashflow live
- Estimated rent
- $1,479 high interval (Pro) →
- Mortgage (P&I)
- −$367
- Tax from tax record
- −$193 /mo · $2,316/yr
- Insurance
- −$29
- Flood insurance flood zone
- −$66 /mo · $798/yr
- HOA
- −$0
- Vacancy / Maint / Mgmt
- −$310
- Net cashflow
- $512
Break-even live
Sensitivity live
| Price | -10% $552 | -5% $532 | +0% $512 | +5% $493 | +10% $473 |
|---|---|---|---|---|---|
| Rent | -10% $396 | -5% $454 | +0% $512 | +5% $571 | +10% $629 |
| Rate | -1.0pp $548 | -0.5pp $530 | base $512 | +0.5pp $494 | +1.0pp $476 |
UW: 25.0% down · 7.5% · 30yr · 1.5% tax · 5.0% vac · 8.0% maint · 8.0% mgmt
Financing live
Cash to close
- Down payment
- $17,500
- Closing costs
- $2,100
- Reserves months
- —
- Total cash needed
- —
Loan-product check · same deal, 3 products live
Conventional
25% down · 7.5% · 30yr
- Down + closing
- —
- Monthly P&I
- —
- Monthly cashflow
- —
- DSCR
- —
- Eligible?
- —
Personal DTI + credit; lowest rate.
DSCR
20% down · 8.5% · 30yr
- Down + closing
- —
- Monthly P&I
- —
- Monthly cashflow
- —
- DSCR
- —
- Eligible?
- —
No personal income docs; deal must DSCR.
Hard money
10% down · 12.0% · 12mo
- Down + closing
- —
- Monthly P&I
- —
- Monthly cashflow
- —
- DSCR
- —
- Eligible?
- —
Short-term bridge; refi at stabilization.
Rent comps 15 comps
| Address | Beds | Baths | Sqft | Rent | $/sqft | DOM | Units | Dist |
|---|---|---|---|---|---|---|---|---|
| 1030 Clairmont Dr Orange, TX | 3.0 | 2.0 | 1372 | $1,850 | $1.35 | 22d | 1 | 0.03mi |
| 1019 Ruby Ln Orange, TX | 2.0 | 1.0 | 1243 | $1,100 | $0.88 | 14d | 1 | 0.16mi |
| 9 W Eads Ave Orange, TX | 3.0 | 2.0 | 1255 | $1,400 | $1.12 | 44d | 1 | 0.18mi |
| 3 Pacific Cir Orange, TX | 4.0 | 1.0 | 1361 | $1,500 | $1.10 | 22d | 1 | 0.20mi |
| 2309 7th St Orange, TX | 3.0 | 1.0 | 1036 | $995 | $0.96 | 14d | 1 | 0.31mi |
| 1205 Wrenway Orange, TX | 4.0 | 2.0 | 1551 | $1,775 | $1.14 | 14d | 1 | 0.38mi |
| 1500 Link Ave Orange, TX | 1.0–2.0 | 1.0–1.5 | 1082 | $1,050 | $0.97 | 14d | 1 | 0.54mi |
| 2208 Monterrey Dr Orange, TX | 3.0 | 1.0 | 1132 | $1,200 | $1.06 | 44d | 1 | 0.59mi |
| 1907 Walnut Ave Orange, TX | 3.0 | 1.5 | 1360 | $1,475 | $1.08 | 14d | 1 | 0.80mi |
| 3901 Beverly Ave Orange, TX | 3.0 | 2.0 | 1359 | $1,500 | $1.10 | 14d | 1 | 0.84mi |
| 1117 18th St Orange, TX | 4.0 | 2.0 | 1716 | $1,500 | $0.87 | 44d | 1 | 0.97mi |
| 1885 E Farragut Ave Orange, TX | 1.0–3.0 | 1.0–2.5 | 1023 | $1,049 | $1.02 | 14d | 9 | 0.98mi |
| 1010 N 16th St Orange, TX | 3.0 | 1.5 | 1100 | $1,500 | $1.36 | 44d | 1 | 1.07mi |
| 2801 W Sunset Dr Orange, TX | 1.0–3.0 | 1.0–2.0 | 1113 | $1,400 | $1.26 | 14d | 27 | 1.08mi |
| 4417 Willowglen St Orange, TX | 3.0 | 2.0 | 1658 | $1,650 | $1.00 | 14d | 1 | 1.13mi |
Listing history 18 events
-
2026-06-18days on market $70,000 Active 162 DOM
-
2026-06-17days on market $70,000 Active 161 DOM
-
2026-06-16days on market $70,000 Active 160 DOM
-
2026-06-15days on market $70,000 Active 159 DOM
-
2026-06-14days on market $70,000 Active 157 DOM
-
2026-06-13days on market $70,000 Active 156 DOM
-
2026-06-10days on market $70,000 Active 154 DOM
-
2026-06-09days on market $70,000 Active 153 DOM
-
2026-06-08days on market $70,000 Active 152 DOM
-
2026-06-07days on market $70,000 Active 151 DOM
-
2026-06-03days on market $70,000 Active 147 DOM
-
2026-06-02days on market $70,000 Active 146 DOM
-
2026-06-01days on market $70,000 Active 145 DOM
-
2026-05-31days on market $70,000 Active 144 DOM
-
2026-05-30days on market $70,000 Active 143 DOM
-
2026-01-29price $70,000 953-char remark
Show marketing remark (953 chars)
Calling all investors, visionaries, and handy homeowners! This three-bedroom, one bathroom home with a one car garage and bonus flex room is bursting with potential and ready for your personal touch! Whether you’re looking to renovate and flip, add to your rental portfolio, or create your dream home from the ground up, this property is the perfect canvas. Inside, you’ll find a flexible floor plan, including a versatile bonus room ideal for a home office, game room, or second living area. Situated on a generously sized lot, this is a fantastic opportunity to transform this diamond in the rough into something truly special. Bring your creativity and schedule your showing today! Situated on a generously sized lot with room to expand or landscape, this is a fantastic opportunity for someone with a vision and a toolbox. Whether you’re dreaming of a cozy starter home or your next investment project, this one checks the boxes.
-
2026-01-07$80,000 Active 953-char remark
Show marketing remark (953 chars)
Calling all investors, visionaries, and handy homeowners! This three-bedroom, one bathroom home with a one car garage and bonus flex room is bursting with potential and ready for your personal touch! Whether you’re looking to renovate and flip, add to your rental portfolio, or create your dream home from the ground up, this property is the perfect canvas. Inside, you’ll find a flexible floor plan, including a versatile bonus room ideal for a home office, game room, or second living area. Situated on a generously sized lot, this is a fantastic opportunity to transform this diamond in the rough into something truly special. Bring your creativity and schedule your showing today! Situated on a generously sized lot with room to expand or landscape, this is a fantastic opportunity for someone with a vision and a toolbox. Whether you’re dreaming of a cozy starter home or your next investment project, this one checks the boxes.
-
2020-09-09soldstatus
ⓘ Source: listings_history table (triggers on properties + properties_extension) + one-shot
backfill from property_details.listing_events for pre-trigger history.
Tax reassessment forecast TX · Resets to sale price
- Current annual tax
- $2,316 · $193/mo
- Projected year-2 tax
- $2,316 · $193/mo
- Expected delta
- $0/yr ($0/mo · 0.0%)
ⓘ Screening estimate from a state-policy table — verify with the county assessor before closing.
Climate risk First Street
- Flood 7/10 Severe FEMA zone X (shaded) · 71% chance over 30 yrs
- Wildfire 2/10 Low
- Heat 9/10 Extreme 7 d/yr ≥109°F today · 23 d/yr by 30 yrs out
- Wind 9/10 Extreme 99% chance of damaging wind over 30 yrs
- Air quality 3/10 Moderate 2 unhealthy d/yr today · 3 by 30 yrs out
Nearby sold comps map
Loading sold comps map…
Walkable amenities ~0.75 mi
Loading nearby amenities…
Taxation est. · year 1
- Rental income
- $17,742
- − Mortgage interest
- −$3,921
- − Property taxes
- −$2,316
- − Insurance
- −$1,148
- − Repairs & maintenance
- −$1,419
- − Management
- −$1,419
- − Depreciation
- −$2,036
- Taxable income
- $5,483
- Est. tax owed @ 24.0%
- −$1,316
- After-tax cash flow
- $4,832/yr
For passive investors: Depreciation is non-cash, so a rental often shows a tax loss while cash-flowing — sheltering income. Rental losses are passive: they offset passive income freely, and up to $25,000/yr can offset ordinary (W-2) income if you actively participate and your MAGI is under $100k (phasing out to $0 by $150k); unused losses carry forward. On sale, claimed depreciation is recaptured at up to 25%, and gains may owe capital-gains tax (a 1031 exchange can defer both). Figures are a year-1 estimate at your 24.0% rate — not tax advice; consult a CPA.
Schools (NCES district)
- District
- West Orange-Cove CISD
- NCES district ID
- 4845090
- Math proficiency
- 17% ▼ -7.00%
- Reading proficiency
- 21% ▼ -2.00%
- Median HH income
- $37,329
- Composite
- 15.86/100
- National rank
- #9260
- State rank
- #784 of 826 in TX
Livability — Orange
- Score
- 71/100
- State rank
- #286
- US rank
- #6456
Category grades
Schools grade is shown separately in the Schools card above.
Census & demographics
- Census place
- Orange, TX
- County
- Orange County · 87,112 people
- City population
- 22,976
- Metro
- Beaumont-Port Arthur, TX
- Population (ZIP)
- 28,983
- Household income
- $64,373
- Rent vs Own
- Severe rent burden
- 1018.0
Population outlook (Orange County) Hauer SSP2
- Today (2025)
- 88,065 people
- By 2030
- 89,591 · +1.7%
- By 2040
- 91,982 · +4.4%
- By 2050
- 93,023 · +5.6%
- By 2075
- 94,871 · +7.7%
- By 2100
- 88,155 · +0.1%
Race, ethnicity, and origin ACS 2023
- Neighborhood character
- Majority White (64%)
- Race & ethnicity
- White 64% Black 21% Hispanic / Latino 11% Two or more races 9%
- Hispanic origin (detail)
- Mexican 7%
- Common ancestry
- Lithuanian 13% Italian 1% Slovak 1%
- Foreign-born
- 5% · Canada
- Languages at home
- 91% English-only · Spanish 7% French/Haitian/Cajun 1% Other Asian/Pacific 1%
Political lean MEDSL · Orange
- 2024 margin
- Solid R (+66.8) · D 16.4% · R 83.1%
- 2008→2024 swing
- -19.6pp toward R · 2008: -47.1pp · 2024: -66.8pp
- All cycles
- 2024: R+66.8 2020: R+63.4 2016: R+61.9 2012: R+54.3 2008: R+47.1
Not yet ingested
- Civics
- —
Market trends
- HPI YoY
- ▲ 1.01%
- Current HPI
- 264.14
- Rent YoY
- ▲ 5.71%
- Metro
- Beaumont-Port Arthur, TX
- State GDP YoY
- ▲ 3.95%
- F500 in state
- 110
Industry mix (Fortune 500 HQ in TX)
| Industry | F500 HQs | Revenue |
|---|---|---|
| Energy | 16 | $1,198B |
|
||
| Technology | 5 | $198B |
|
||
| Engineering / Construction | 4 | $72B |
|
||
| Energy Services | 3 | $60B |
|
||
| Utilities | 3 | $41B |
|
||
| Healthcare | 2 | $330B |
|
||
Price history
-12.5% since first listed3 events — show timeline
- 2026-01-29 Price Changed $70,000 BBOR
- 2026-01-07 Listed $80,000 BBOR
- 2020-09-09 Sold (Public Records) — Public Records
Property tax history
+6.7%/yrLatest (2025): $2,316 · +5.6% YoY. Source: county tax records.
Cash-flow waterfall
monthlySold comps — $/sqft
last 12 mo · ≤1 miLoading sold comps…