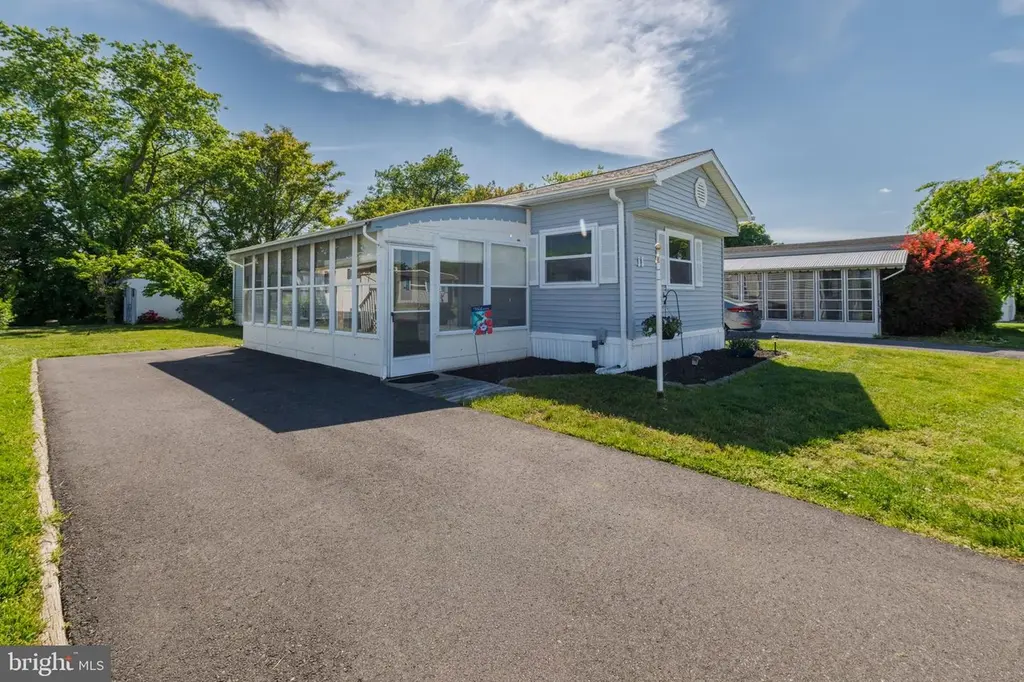
11 Colonial Ln · Lewes, DE
Flood risk No data
- FEMA flood zone
- —
- Chance of flooding over 30 yrs
- —
- Est. flood insurance / yr
- —
Fire risk No data
- Est. fire insurance / yr
- —
Heat risk No data
- Hot days now (above threshold)
- —
- Hot days in 30 yrs
- —
Wind risk No data
- Chance of severe wind over 30 yrs
- —
Air-quality risk No data
- Unhealthy air days now
- —
- Unhealthy air days in 30 yrs
- —
Risk factors via First Street. Map © Google.
Why this score? — see what drove the C- grade
The composite is a weighted blend of 9 inputs, each scored 0–100. Each bar is that input's sub-score; the figure is the points it added to the 100-point composite (weight × sub-score).
- Cash flow +15.0/30.0
- ARV discount +15.0/15.0
- 1% rule +5.0/10.0
- DSCR +5.0/10.0
- Schools +4.2/10.0
- Livability +3.4/5.0
- Rent growth +2.5/5.0
- Condition / age +2.2/5.0
- Appreciation +0.0/10.0
$59,999
🖨 Deal sheet 📄 Offer letter ✓ Due diligence
Listing remarks
Welcome to easy beach living at its finest! Nestled in the sought-after Colonial East community in Rehoboth Beach, Delaware, this delightful mobile home offers the perfect blend of coastal convenience and laid-back charm — all at an approachable price point. Just minutes from the sand and surf of Rehoboth Beach, you'll spend your mornings with your toes in the waves and your evenings exploring the vibrant dining and nightlife scene along Rehoboth Avenue. Whether you're craving fresh seafood, farm-to-table fare, or a craft pint from one of the area's celebrated local breweries — Dogfish Head, 16 Mile, or Revelation Craft Brewing — everything is within easy reach. Shoppers w
Key facts
- 41.87 acre lot
- 2 parking spots
- Community pool
Property features AI
Finance
- Other: Not in a federal flood zone
- Financial info: Land lease amount $549 monthly (34 years remaining)
- HOA & community: Association maintains common areas, management, pools, roads, and snow removal; Association amenities include outdoor swimming pool and playground
Exterior
- Parking: Asphalt driveway; Driveway parking with 2 spaces; Total of 2 garage/parking spaces
- Security: Property manager present
- Utilities: Public water; Public sewer
- Home design: Manufactured single-wide home; Built year per assessor; Land lease ownership (land lease remaining: 34 years); Land lease payment: $549 monthly; Above-grade finished living area per assessor
- Construction: Aluminum siding; Roof type unknown; Other structures include shed
- Exterior features: Community in-ground fenced pool; Community pool; Common grounds; Tot lots/playground; Shed on the property; Outside city limits; East of Rt 1 location
Interior
- Kitchen: No kitchen appliance details provided
- Bedrooms: Three bedrooms on the main level
- Flooring: Laminated flooring
- Bathrooms: Two full bathrooms on the main level
- Heating & cooling: Forced air heating; Heat pump(s); Propane (leased) heating fuel; Central air conditioning; Cooling electric
- Interior features: Not furnished; No basement
- Laundry & utility: Laundry located on the main floor
Neighborhood map
What this means for you Summary
Snapshot
- This is a 3-bed/2.0-bath single-family listed at $60k. Condition is rated fair.
Deal economics
- At list price, monthly cash flow is $2k ($19k/yr) — positive.
- The deal already cash-flows at list — no discount required.
- Meets the 1% rule at list price ($3k rent vs $60k).
- Recommended offer: $58k (3.0% below list) — sets the bar for market timing.
- Cap rate 38.6% vs local median 1.7% in Lewes — top-decile yield for the area; either an underpriced asset or a hidden risk that comps aren't pricing in. Stress-test before assuming the spread holds.
Location & tenants
- Location reads 67/100 on livability (#40 in DE) — a middle-class / working-renter tenant base. Strengths: crime A+, employment A+, health & safety A+; Watch: commute F, cost of living F.
- Cape Henlopen School District (town): math 42% / reading 55% proficiency, ranked #5 of 26 in DE (top 19%) — families likely to look elsewhere, expect single-tenant / working-renter base with shorter leases.
- Market conditions: 331 active listings in the ZIP; 9 comparable units currently listed for rent nearby; rentals lingering (median 44d on market — plan ~5-8 weeks vacancy on turnover, expect pricing pressure); 56% of comp listings sitting > 30 days — soft ceiling on asking rent; solid renter incomes; 4,354 units permitted in Sussex County in 2024 (344 in 5+ unit buildings).
- This rent runs 30% of the median local income ($102k/yr) — at the standard rent-burdened threshold; future hikes will face affordability resistance.
Forward outlook
- Local home prices are declining (-3.0%/yr); year-one equity from $415 of loan paydown is wiped out by about $2k of value loss. Plan a longer hold.
- Sussex County population projected at +25% by 2050 — long-run rental-demand tailwind backs the buy-and-hold thesis.
- At projected returns (-3.0% appreciation + 3.0% rent growth), your $17k cash investment doubles in ~1 year — after that, you're playing with house money.
Negotiation context
- It's been on market 36 days — a 3% lower offer ($58k) is reasonable based on typical stale-listing flexibility.
Questions for the listing agent
- It's been on market 36 days. Have you received any prior offers? Is the seller open to a 3% concession, seller financing, or rate buy-down credit?
- Have any recent inspections been done? Can we get a copy of the seller's disclosures and any deferred-maintenance estimates?
- Built in 1977 — when were the roof, HVAC, electrical panel, plumbing, and water heater last replaced?
- Is there a deadline driving the sale (1031 exchange, divorce, estate, relocation)? That informs how much negotiation room exists.
- Schools are B-rated — typically a magnet for longer-tenancy family renters. What's the average tenant stay here, and is there a school-zone premium baked into asking?
- What's the average days-on-market for RENTAL listings here right now (not sales)? A rising rental-DOM trend means longer vacancies and softer asking-rent achievability than the comps imply.
- What's the recent tenant-quality profile in this submarket — average credit score on applications, eviction rate, late-payment / NSF rate, and stable-employment percentage? A property-management company in the area should have these aggregated.
- How much new for-sale + rental construction is in the pipeline within 1–3 miles? Heavy new supply typically softens prices + rents 12–24 months out; constrained supply supports both.
Investment metrics
- 1% rule
- 4.29% ✓
- Cap rate
- 38.64%
- Cash-on-cash
- 115.53%
- DSCR
- 6.14
- GRM
- 1.9
CMA / ARV
- ARV (median comp)
- $84,934
- List price
- $59,999
- Delta
- -29.36%
- Verdict
- UNDERPRICED
- Comps
- 20 within 1.0 mi
Show comp detail 12 sales within ~0.75 mi
| Address | Dist | Beds/Ba | Sqft | Sold | Price | $/sf | Match |
|---|---|---|---|---|---|---|---|
| 22 Spinning Wheel Ln | 0.14mi | 3/1.5 | 980 (0%) | 2mo | $85,000 | $87 | 90 |
| 6 Spinning Wheel Ln | 0.19mi | 3/1.5 | 980 (0%) | 9mo | $60,000 | $61 | 82 |
| 25 Gunpowder Ln | 0.21mi | 3/1.5 | 980 (0%) | 11mo | $75,000 | $77 | 79 |
| 10 Powder Horn Ln #22022 | 0.22mi | 3/2.0 | 1,012 (+3%) | 9mo | $115,000 | $114 | 77 |
| 21 Gunpowder Ln #13511 | 0.22mi | 2/2.0 (-1) | 980 (0%) | 10mo | $58,000 | $59 | 76 |
| 23 Carriage Ln | 0.29mi | 2/2.0 (-1) | 980 (0%) | 11mo | $135,000 | $138 | 72 |
| 18639 Snowmass Run | 0.39mi | 3/2.0 | 980 (0%) | 14mo | $167,500 | $171 | 70 |
| 35653 Highlands Way #182 | 0.31mi | 3/2.0 | 1,108 (+13%) | 0mo | $115,000 | $104 | 64 |
| 41 Spinning Wheel Ln | 0.08mi | 2/1.0 (-1) | 840 (-14%) | 8mo | $51,500 | $61 | 56 |
| 35578 High Alpine Ln #20869 | 0.18mi | 2/2.0 (-1) | 1,100 (+12%) | 12mo | $110,000 | $100 | 56 |
| 18020 Howard Dr | 0.67mi | 2/1.5 (-1) | 980 (0%) | 12mo | $215,000 | $219 | 52 |
| 28 Bryan Dr | 0.35mi | 3/2.0 | 1,108 (+13%) | 14mo | $460,000 | $415 | 50 |
Match score weights: distance 35% · size 25% · config 20% · recency 20%. Top-matched comps best support the ARV.
Projected returns pro-forma
-3.0% appreciation · 3.0% rent growth · sell at horizon
- IRR
- —
- Equity multiple
- 6.56×
- Total profit
- $93,330
- Equity at exit
- $8,946
- IRR
- —
- Equity multiple
- 13.74×
- Total profit
- $214,074
- Equity at exit
- $5,188
Cash invested: $16,800 (down + closing). Projections, not guarantees.
Landlord ↔ Tenant lean methodology
- Overall (STATE)
- 70 Landlord-Friendly
- State Delaware
- 70 Landlord-Friendly · D+7
- County
- — inherits STATE
- City
- — inherits STATE
ZIP-level market 19971
- Active inventory
- 331
- Price-to-rent
- 1.9×
Monthly cashflow live
- Estimated rent
- $2,572 high interval (Pro) →
- Mortgage (P&I)
- −$315
- Tax est. 1.5%
- −$75 /mo · $900/yr
- Insurance
- −$25
- HOA
- −$0
- Vacancy / Maint / Mgmt
- −$540
- Net cashflow
- $1,617
Break-even live
UW: 25.0% down · 7.5% · 30yr · 1.5% tax · 5.0% vac · 8.0% maint · 8.0% mgmt
Financing live
Cash to close
- Down payment
- $15,000
- Closing costs
- $1,800
- Reserves months
- —
- Total cash needed
- —
Loan-product check · same deal, 3 products live
Conventional
25% down · 7.5% · 30yr
- Down + closing
- —
- Monthly P&I
- —
- Monthly cashflow
- —
- DSCR
- —
- Eligible?
- —
Personal DTI + credit; lowest rate.
DSCR
20% down · 8.5% · 30yr
- Down + closing
- —
- Monthly P&I
- —
- Monthly cashflow
- —
- DSCR
- —
- Eligible?
- —
No personal income docs; deal must DSCR.
Hard money
10% down · 12.0% · 12mo
- Down + closing
- —
- Monthly P&I
- —
- Monthly cashflow
- —
- DSCR
- —
- Eligible?
- —
Short-term bridge; refi at stabilization.
Rent comps 9 comps
| Address | Beds | Baths | Sqft | Rent | $/sqft | DOM | Units | Dist |
|---|---|---|---|---|---|---|---|---|
| 32015 Azure Ave Rehoboth Beach, DE | 1.0–3.0 | 1.0–2.0 | 1054 | $2,375 | $2.25 | 43d | 1 | 0.45mi |
| 15 Colgate Dr Rehoboth Beach, DE | 3.0 | 2.0 | 1120 | $2,275 | $2.03 | 20d | 1 | 0.46mi |
| 300 Pebble Dr #318 Rehoboth Beach, DE | 2.0 | 2.0 | 940 | $1,800 | $1.91 | 20d | 1 | 0.68mi |
| 35948 Haven Dr #201 Rehoboth Beach, DE | 2.0 | 2.0 | 858 | $1,800 | $2.10 | 20d | 1 | 0.75mi |
| 17829 Callaway Dr #37 Lewes, DE | 3.0 | 2.0 | 1000 | $2,000 | $2.00 | 43d | 1 | 0.97mi |
| 107 Strawberry Way Rehoboth Beach, DE | 3.0 | 2.0 | 1025 | $2,750 | $2.68 | 43d | 1 | 1.04mi |
| 36916 Crooked Hammock Way Lewes, DE | 2.0–3.0 | 2.0 | 1172 | $2,250 | $1.92 | 43d | 1 | 1.14mi |
| 18482 Evelynton Rd Lewes, DE | 2.0 | 2.0 | 1100 | $1,650 | $1.50 | 13d | 1 | 1.43mi |
| 10150 Rockland St Lewes, DE | 1.0–3.0 | 1.5–2.5 | 1217 | $3,850 | $3.16 | 43d | 1 | 1.48mi |
Listing history 18 events
-
2026-06-18days on market $59,999 Active 36 DOM
-
2026-06-17days on market $59,999 Active 35 DOM
-
2026-06-16days on market $59,999 Active 34 DOM
-
2026-06-15days on market $59,999 Active 33 DOM
-
2026-06-14days on market $59,999 Active 31 DOM
-
2026-06-13days on market $59,999 Active 30 DOM
-
2026-06-10days on market $59,999 Active 28 DOM
-
2026-06-09days on market $59,999 Active 27 DOM
-
2026-06-08days on market $59,999 Active 26 DOM
-
2026-06-07days on market $59,999 Active 25 DOM
-
2026-06-05days on market $59,999 Active 22 DOM
-
2026-06-03days on market $59,999 Active 21 DOM
-
2026-06-02days on market $59,999 Active 20 DOM
-
2026-06-01days on market $59,999 Active 19 DOM
-
2026-05-31pricedays on market $59,999 Active 18 DOM
-
2026-05-30days on market $62,000 Active 17 DOM
-
2026-05-13$79,000 Active 1173-char remark
-
2026-05-11historical $79,000 1173-char remark
ⓘ Source: listings_history table (triggers on properties + properties_extension) + one-shot
backfill from property_details.listing_events for pre-trigger history.
Nearby sold comps map
Loading sold comps map…
Walkable amenities ~0.75 mi
Loading nearby amenities…
Taxation est. · year 1
- Rental income
- $30,867
- − Mortgage interest
- −$3,361
- − Property taxes
- −$900
- − Insurance
- −$300
- − Repairs & maintenance
- −$2,469
- − Management
- −$2,469
- − Depreciation
- −$1,745
- Taxable income
- $19,622
- Est. tax owed @ 24.0%
- −$4,709
- After-tax cash flow
- $14,700/yr
For passive investors: Depreciation is non-cash, so a rental often shows a tax loss while cash-flowing — sheltering income. Rental losses are passive: they offset passive income freely, and up to $25,000/yr can offset ordinary (W-2) income if you actively participate and your MAGI is under $100k (phasing out to $0 by $150k); unused losses carry forward. On sale, claimed depreciation is recaptured at up to 25%, and gains may owe capital-gains tax (a 1031 exchange can defer both). Figures are a year-1 estimate at your 24.0% rate — not tax advice; consult a CPA.
Condition & rehab AI · 30 photos
This mobile home requires moderate renovations to improve its condition and increase its value. Key areas for improvement include the exterior siding, interior paint, kitchen appliances, and bathroom fixtures.
Repairs flagged
- Major exterior siding — Significant wear and tear
- Major interior paint — Worn and dated
- Major kitchen appliances — Old and outdated
- Major bathroom fixtures — Old and dated
Value-add opportunities
- Resale Paint exterior — Fresh paint enhances curb appeal
- Resale Replace carpet — New carpet improves comfort and value
- Both Upgrade kitchen appliances — Modern appliances increase functionality and value
- Both Replace bathroom fixtures — Updated fixtures improve functionality and value
Renovation cost estimate screening
| Repair item | Severity | Est. cost |
|---|---|---|
| exterior siding · Significant wear and tear | Major | $15,000–50,000 |
| interior paint · Worn and dated | Major | $15,000–50,000 |
| kitchen appliances · Old and outdated | Major | $15,000–50,000 |
| bathroom fixtures · Old and dated | Major | $15,000–50,000 |
| Total estimated repair cost · 4 items | $60,000–200,000 |
Value-add ROI direction
- Resale Paint exterior — Fresh paint enhances curb appeal ↑
- Resale Replace carpet — New carpet improves comfort and value ↑
- Both Upgrade kitchen appliances — Modern appliances increase functionality and value ↑
- Both Replace bathroom fixtures — Updated fixtures improve functionality and value ↑
ⓘ Cost ranges are severity-bucket heuristics (US national rule-of-thumb). Get contractor quotes + a written scope before underwriting a rehab budget.
Schools (NCES district)
- District
- Cape Henlopen School District
- NCES district ID
- 1000170
- Math proficiency
- 42% ▼ -14.00%
- Reading proficiency
- 55% ▼ -10.00%
- Median HH income
- $60,196
- Composite
- 42.47/100
- National rank
- #3214
- State rank
- #5 of 26 in DE
Livability — Lewes
- Score
- 67/100
- State rank
- #40
- US rank
- #11077
Category grades
Schools grade is shown separately in the Schools card above.
Census & demographics
- County
- Sussex County · 82,708 people
- City population
- 31,938
- Metro
- Salisbury, MD-DE
- Population (ZIP)
- 14,886
- Household income
- $102,146
- Rent vs Own
- Severe rent burden
- 317.0
Population outlook (Sussex County) Hauer SSP2
- Today (2025)
- 248,853 people
- By 2030
- 264,464 · +6.3%
- By 2040
- 290,980 · +16.9%
- By 2050
- 311,259 · +25.1%
- By 2075
- 352,488 · +41.6%
- By 2100
- 367,406 · +47.6%
Race, ethnicity, and origin ACS 2023
- Neighborhood character
- Predominantly White (88%)
- Race & ethnicity
- White 88% Black 4% Two or more races 4% Hispanic / Latino 3% Asian 2%
- Common ancestry
- Romanian 5% Slovak 3% Italian 3%
- Foreign-born
- 6% · Canada, China
- Languages at home
- 95% English-only · Spanish 2% Russian/Polish/Slavic 1% French/Haitian/Cajun 1%
Political lean MEDSL · Sussex
- 2024 margin
- R (+11.0) · D 43.9% · R 54.9% · Other 1.2%
- 2008→2024 swing
- -2.4pp toward R · 2008: -8.6pp · 2024: -11.0pp
- All cycles
- 2024: R+11.0 2020: R+11.2 2016: R+22.0 2012: R+13.0 2008: R+8.6
Not yet ingested
- Civics
- —
Market trends
- HPI YoY
- ▼ -220.39%
- Current HPI
- 353.3977
- Rent YoY
- —
- Metro
- Salisbury, MD-DE
- State GDP YoY
- —
- F500 in state
- 0
Price history
-24.1% since first listed7 events — show timeline
- 2026-05-31 Price Changed $59,999 BRIGHT MLS
- 2026-05-28 Price Changed $62,000 BRIGHT MLS
- 2026-05-27 Price Changed $65,000 BRIGHT MLS
- 2026-05-25 Price Changed $68,500 BRIGHT MLS
- 2026-05-20 Price Changed $78,500 BRIGHT MLS
- 2026-05-13 Listed $79,000 BRIGHT MLS
- 2026-05-11 Coming Soon $79,000 BRIGHT MLS
Cash-flow waterfall
monthlySold comps — $/sqft
last 12 mo · ≤1 miLoading sold comps…