105 S Second St · Dunsmuir, CA
Flood risk 8/10 · Major
- FEMA flood zone
- AE
- Chance of flooding over 30 yrs
- 0.99%
- Est. flood insurance / yr
- $1,737 – $8,500
Fire risk 7/10 · Major
- Est. fire insurance / yr
- $659 – $1,223
Heat risk 5/10 · Moderate
- Hot days now (above 95°F)
- 10 days/yr
- Hot days in 30 yrs
- 23 days/yr
Wind risk 1/10 · Minimal
- Chance of severe wind over 30 yrs
- —
Air-quality risk 10/10 · Severe
- Unhealthy air days now
- 51 days/yr
- Unhealthy air days in 30 yrs
- 52 days/yr
Risk factors via First Street. Map © Google.
Why this score? — see what drove the B grade
The composite is a weighted blend of 9 inputs, each scored 0–100. Each bar is that input's sub-score; the figure is the points it added to the 100-point composite (weight × sub-score).
- Cash flow +30.0/30.0
- ARV discount +15.0/15.0
- DSCR +10.0/10.0
- 1% rule +8.7/10.0
- Schools +4.1/10.0
- Livability +2.7/5.0
- Rent growth +2.5/5.0
- Condition / age +1.0/5.0
- Appreciation +0.0/10.0
$100,000
🖨 Deal sheet (PDF) 📄 Offer letter ✓ Due diligence
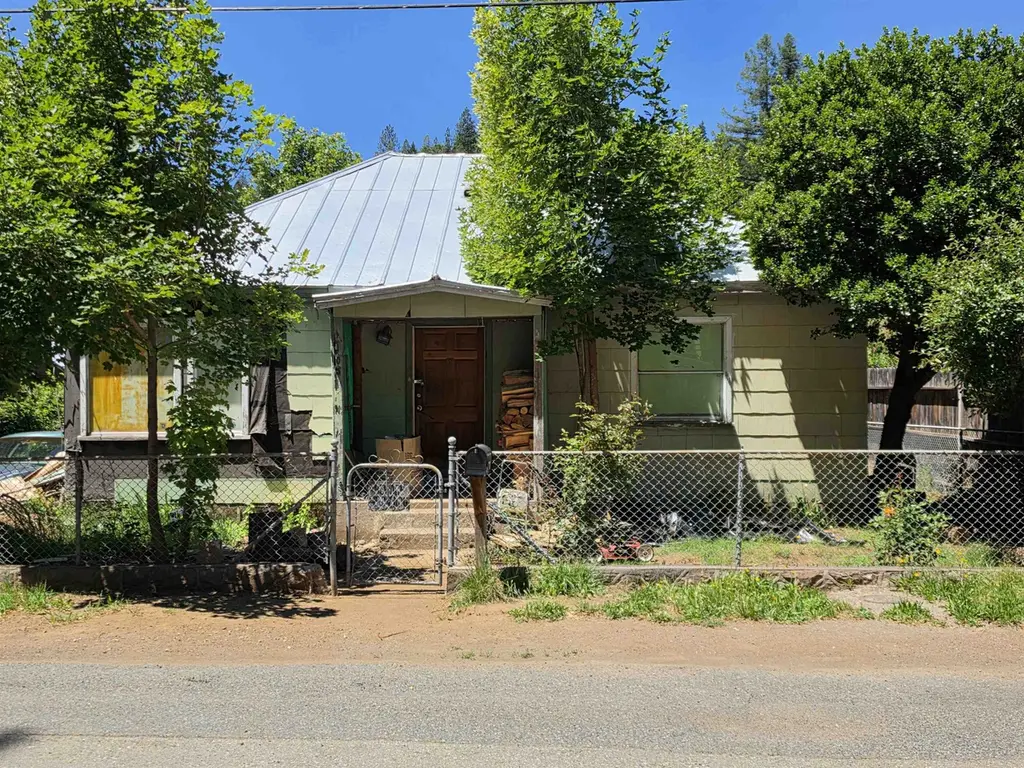
Listing remarks
A new investment opportunity in Dunsmuir. This property is a 2-bedroom, 1-bathroom home featuring a 2-car detached garage. While the home requires work, it includes original wood floors, a utility room, and a spacious fenced yard with a driveway providing ample parking. The property is ideally located within walking distance of the river and a popular fishing hole. Please note that this is a cash-only opportunity.
Key facts
- Utility room
- Spacious fenced yard
- Ample parking
Tags
Property features AI
Exterior
- Parking: 2-car garage
- Utilities: Public water
- Home design: Single-family residence; One story
- Construction: Metal roof
- Exterior features: Level lot; Chain link and wood fencing; Lot dimensions approximately 58 x 101 x 52 x 96; Zoned R
Interior
- Flooring: Wood
- Heating & cooling: Wood stove heating
- Interior features: Wood flooring; Dryer, Washer, Refrigerator
- Laundry & utility: Washer and Dryer included
Neighborhood map
What this means for you Summary
Snapshot
- This is a 2-bed/1.0-bath single-family listed at $100k. Condition is rated poor.
Deal economics
- At list price, monthly cash flow is $-36 ($-429/yr) — negative.
- To cash-flow at today's rent, offer at most $95k (5.2% below list).
- Meets the 1% rule at list price ($1k rent vs $100k).
- Recommended offer: $95k (5.2% below list) — sets the bar for cash-flow.
- Cap rate 11.0% vs local median 3.8% in Dunsmuir — top-decile yield for the area; either an underpriced asset or a hidden risk that comps aren't pricing in. Stress-test before assuming the spread holds.
Location & tenants
- Location reads 53/100 on livability (#967 in CA) — a working-class tenant base; expect higher turnover. Strengths: housing A-; Watch: cost of living D+, crime F, amenities F.
- Dunsmuir Joint Union High (rural): math 25% / reading 75% proficiency, ranked #163 of 517 in CA (top 32%) — acceptable for families but not a draw, mixed tenant base, ~2y average lease.
- Zoned schools: Dunsmuir Elementary (math 15% / reading 24%, grade F, #1,256 of 1,571 statewide, top 81%, 93 students, 89% FRL); Dunsmuir High (math 24% / reading 75%, grade D+, #332 of 1,170 statewide, top 30%, 66 students, 74% FRL).
- Zoned-school proficiency averages 35% at this address vs 50% district-wide (-15 pts) — the specific schools serving this property underperform the Dunsmuir Joint Union High average; the district grade overstates school quality for this exact location.
- Market conditions: 36 active listings in the ZIP; 3 comparable units currently listed for rent nearby; rentals at typical pace (median 23d on market — plan ~3-4 weeks tenant-placement turnaround); 50 units permitted in Siskiyou County in 2024 (0 in 5+ unit buildings).
Forward outlook
- Local home prices are declining (-3.0%/yr); year-one equity from $691 of loan paydown is wiped out by about $3k of value loss. Plan a longer hold.
- Siskiyou County population projected at -26% by 2050 — secular population decline; favor cash flow + early exit over multi-decade hold.
Negotiation context
- Only 5 days on market — expect competitive offers; lowballing is unlikely to land.
Risks & watch-outs
- Watch-outs: flood insurance adds $427/mo.
- Climate carrying-cost: in FEMA flood zone AE (mandatory federal flood insurance); major wildfire risk; extreme-heat days projected 10→23/yr by 2055 (HVAC capex compounding) — expect insurance premiums to compound above CPI over the hold.
Questions for the listing agent
- What do current leases actually rent for vs. the listed asking? Can we see a recent rent roll and the last 12 months of T-12 income?
- Have any recent inspections been done? Can we get a copy of the seller's disclosures and any deferred-maintenance estimates?
- What's the actual annual flood-insurance premium (NFIP or private), and is the property in a SFHA with mandatory coverage?
- Is there a deadline driving the sale (1031 exchange, divorce, estate, relocation)? That informs how much negotiation room exists.
- Schools are D-rated, which usually means shorter tenancies and higher turnover. Who's the typical renter profile here, and what's been the actual vacancy rate?
- Crime grade is F in this area — have there been break-ins, vandalism, or insurance claims at this property in the last 3 years? What carrier currently insures it and at what premium?
- What's the average days-on-market for RENTAL listings here right now (not sales)? A rising rental-DOM trend means longer vacancies and softer asking-rent achievability than the comps imply.
- What's the recent tenant-quality profile in this submarket — average credit score on applications, eviction rate, late-payment / NSF rate, and stable-employment percentage? A property-management company in the area should have these aggregated.
- How much new for-sale + rental construction is in the pipeline within 1–3 miles? Heavy new supply typically softens prices + rents 12–24 months out; constrained supply supports both.
Investment metrics
- 1% rule
- 1.37% ✓
- Cap rate
- 10.98%
- Cash-on-cash
- 16.75%
- DSCR
- 1.75
- GRM
- 6.1
CMA / ARV
- ARV (on-the-fly)
- $173,600
- Comps found
- 2
Show comp detail 2 sales within ~0.75 mi
| Address | Dist | Beds/Ba | Sqft | Sold | Price | $/sf | Match |
|---|---|---|---|---|---|---|---|
| 4119 Edyth St | 0.20mi | 1/1.0 (-1) | 690 (-14%) | 10mo | $150,000 | $217 | 54 |
| 5826 Shasta Ave | 0.61mi | 1/1.0 (-1) | 888 (+11%) | 2mo | $185,000 | $208 | 46 |
Match score weights: distance 35% · size 25% · config 20% · recency 20%. Top-matched comps best support the ARV.
Projected returns pro-forma
-3.0% appreciation · 3.0% rent growth · sell at horizon
- IRR
- -18.5%
- Equity multiple
- 0.35×
- Total profit
- $-18,200
- Equity at exit
- $14,910
- IRR
- -10.2%
- Equity multiple
- 0.37×
- Total profit
- $-17,634
- Equity at exit
- $8,646
Cash invested: $28,000 (down + closing). Projections, not guarantees.
Landlord ↔ Tenant lean methodology
- Overall (STATE)
- 18 Strongly Tenant-Friendly
- State California
- 18 Strongly Tenant-Friendly · D+13
- County
- — inherits STATE
- City
- — inherits STATE
ZIP-level market 96025
- Active inventory
- 36
- Price-to-rent
- 6.1×
Monthly cashflow live
- Estimated rent
- $1,369 medium interval (Pro) →
- Mortgage (P&I)
- −$524
- Tax est. 1.5%
- −$125 /mo · $1,500/yr
- Insurance
- −$42
- Flood insurance flood zone
- −$427 /mo · $5,118/yr
- HOA
- −$0
- Vacancy / Maint / Mgmt
- −$288
- Net cashflow
- $-36
Break-even live
Sensitivity live
| Price | -10% $33 | -5% $-1 | +0% $-36 | +5% $-70 | +10% $-105 |
|---|---|---|---|---|---|
| Rent | -10% $-144 | -5% $-90 | +0% $-36 | +5% $18 | +10% $72 |
| Rate | -1.0pp $15 | -0.5pp $-10 | base $-36 | +0.5pp $-62 | +1.0pp $-88 |
UW: 25.0% down · 7.5% · 30yr · 1.5% tax · 5.0% vac · 8.0% maint · 8.0% mgmt
Financing live
Cash to close
- Down payment
- $25,000
- Closing costs
- $3,000
- Reserves months
- —
- Total cash needed
- —
Loan-product check · same deal, 3 products live
Conventional
25% down · 7.5% · 30yr
- Down + closing
- —
- Monthly P&I
- —
- Monthly cashflow
- —
- DSCR
- —
- Eligible?
- —
Personal DTI + credit; lowest rate.
DSCR
20% down · 8.5% · 30yr
- Down + closing
- —
- Monthly P&I
- —
- Monthly cashflow
- —
- DSCR
- —
- Eligible?
- —
No personal income docs; deal must DSCR.
Hard money
10% down · 12.0% · 12mo
- Down + closing
- —
- Monthly P&I
- —
- Monthly cashflow
- —
- DSCR
- —
- Eligible?
- —
Short-term bridge; refi at stabilization.
Rent comps 3 comps
| Address | Beds | Baths | Sqft | Rent | $/sqft | DOM | Units | Dist |
|---|---|---|---|---|---|---|---|---|
| 5945 Shasta Ave Dunsmuir, CA | 3.0 | 1.0 | 800 | $1,100 | $1.38 | 23d | 1 | 0.48mi |
| 5933 Shasta Ave Dunsmuir, CA | 1.0 | 1.0 | 1000 | $1,500 | $1.50 | 23d | 1 | 0.51mi |
| 4100 Cedar St Dunsmuir, CA | 2.0 | 2.0 | 1000 | $1,600 | $1.60 | 23d | 1 | 0.52mi |
Listing history 6 events
-
2026-06-17status $100,000 Pending 5 DOM
-
2026-06-17days on market $100,000 Active 5 DOM
-
2026-06-16days on market $100,000 Active 4 DOM
-
2026-06-15days on market $100,000 Active 3 DOM
-
2026-06-13remarks 417-char remark
-
2026-06-13$100,000 Active 1 DOM
ⓘ Source: listings_history table (triggers on properties + properties_extension) + one-shot
backfill from property_details.listing_events for pre-trigger history.
Climate risk First Street
- Flood 8/10 Severe FEMA zone AE · 99% chance over 30 yrs
- Wildfire 7/10 Severe
- Heat 5/10 Major 10 d/yr ≥95°F today · 23 d/yr by 30 yrs out
- Wind 1/10 Low
- Air quality 10/10 Extreme 51 unhealthy d/yr today · 52 by 30 yrs out
Nearby sold comps map
Loading sold comps map…
Walkable amenities ~0.75 mi
Loading nearby amenities…
Taxation est. · year 1
- Rental income
- $16,433
- − Mortgage interest
- −$5,602
- − Property taxes
- −$1,500
- − Insurance
- −$5,618
- − Repairs & maintenance
- −$1,315
- − Management
- −$1,315
- − Depreciation
- −$2,909
- Taxable loss
- −$1,825
- Est. tax savings @ 24.0%
- +$438
- After-tax cash flow
- $9/yr
For passive investors: Depreciation is non-cash, so a rental often shows a tax loss while cash-flowing — sheltering income. Rental losses are passive: they offset passive income freely, and up to $25,000/yr can offset ordinary (W-2) income if you actively participate and your MAGI is under $100k (phasing out to $0 by $150k); unused losses carry forward. On sale, claimed depreciation is recaptured at up to 25%, and gains may owe capital-gains tax (a 1031 exchange can defer both). Figures are a year-1 estimate at your 24.0% rate — not tax advice; consult a CPA.
Condition & rehab AI · 6 photos
This property requires extensive repairs and renovations to bring it up to a livable condition. Significant work is needed in the kitchen, bathroom, exterior, flooring, and interior walls/paint. The home's location and potential for renovation make it a good investment opportunity.
Repairs flagged
- Major Kitchen cabinets — Significant damage and debris
- Major Countertops — Significant damage and debris
- Major Appliances — Significant damage and debris
- Major Bathroom — Significant damage and debris
- Major Exterior siding — Significant damage and debris
- Major Flooring — Significant damage and debris
- Major Interior walls/paint — Significant damage and debris
Value-add opportunities
- Resale Kitchen renovation — A new kitchen will attract buyers and increase the home's value
- Resale Bathroom renovation — A new bathroom will attract buyers and increase the home's value
- Resale Exterior siding repair — A repaired exterior will improve the home's curb appeal and increase its value
- Resale Flooring replacement — New flooring will improve the home's appearance and increase its value
- Resale Interior wall and paint repair — A repaired interior will improve the home's appearance and increase its value
Renovation cost estimate screening
| Repair item | Severity | Est. cost |
|---|---|---|
| Kitchen cabinets · Significant damage and debris | Major | $15,000–50,000 |
| Countertops · Significant damage and debris | Major | $15,000–50,000 |
| Appliances · Significant damage and debris | Major | $15,000–50,000 |
| Bathroom · Significant damage and debris | Major | $15,000–50,000 |
| Exterior siding · Significant damage and debris | Major | $15,000–50,000 |
| Flooring · Significant damage and debris | Major | $15,000–50,000 |
| Interior walls/paint · Significant damage and debris | Major | $15,000–50,000 |
| Total estimated repair cost · 7 items | $105,000–350,000 |
Value-add ROI direction
- Resale Kitchen renovation — A new kitchen will attract buyers and increase the home's value ↑
- Resale Bathroom renovation — A new bathroom will attract buyers and increase the home's value ↑
- Resale Exterior siding repair — A repaired exterior will improve the home's curb appeal and increase its value ↑
- Resale Flooring replacement — New flooring will improve the home's appearance and increase its value ↑
- Resale Interior wall and paint repair — A repaired interior will improve the home's appearance and increase its value ↑
ⓘ Cost ranges are severity-bucket heuristics (US national rule-of-thumb). Get contractor quotes + a written scope before underwriting a rehab budget.
Schools (NCES district)
- District
- Dunsmuir Joint Union High
- NCES district ID
- 0611700
- Math proficiency
- 25% ▲ 25.00%
- Reading proficiency
- 75% ▲ 75.00%
- Median HH income
- $32,255
- Composite
- 40.88/100
- National rank
- #3620
- State rank
- #163 of 517 in CA
Livability — Dunsmuir
- Score
- 53/100
- State rank
- #967
- US rank
- #24546
Category grades
Schools grade is shown separately in the Schools card above.
Census & demographics
- Population (ZIP)
- 2,150
Population outlook (Siskiyou County) Hauer SSP2
- Today (2025)
- 39,337 people
- By 2030
- 36,930 · -6.1%
- By 2040
- 32,367 · -17.7%
- By 2050
- 29,030 · -26.2%
- By 2075
- 23,534 · -40.2%
- By 2100
- 19,312 · -50.9%
Race, ethnicity, and origin ACS 2023
- Neighborhood character
- Predominantly White (76%)
- Race & ethnicity
- White 76% Two or more races 13% Hispanic / Latino 12% Asian 1% Black 1% Native American 1%
- Hispanic origin (detail)
- Mexican 9%
- Common ancestry
- Italian 4% Romanian 4% Lithuanian 3%
- Foreign-born
- 6% · Canada, China, South Korea
- Languages at home
- 94% English-only · Spanish 4% Other Indo-European 1%
Political lean MEDSL · Siskiyou
- 2024 margin
- R (+19.2) · D 38.8% · R 58.0% · Other 3.2%
- 2008→2024 swing
- -8.8pp toward R · 2008: -10.4pp · 2024: -19.2pp
- All cycles
- 2024: R+19.2 2020: R+15.8 2016: R+20.7 2012: R+15.6 2008: R+10.4
Not yet ingested
- Civics
- —
Market trends
- HPI YoY
- ▼ -140.66%
- Current HPI
- 144.676
- Rent YoY
- —
- Metro
- —
- State GDP YoY
- ▲ 3.21%
- F500 in state
- 116
Industry mix (Fortune 500 HQ in CA)
| Industry | F500 HQs | Revenue |
|---|---|---|
| Technology | 27 | $1,492B |
|
||
| Financial Services | 3 | $174B |
|
||
| Retail | 3 | $44B |
|
||
| Insurance | 3 | $26B |
|
||
| Media / Entertainment | 2 | $115B |
|
||
| Pharmaceuticals / Biotech | 2 | $62B |
|
||
Price history
1 event — show timeline
- 2026-06-12 Listed $100,000 SMLS
Cash-flow waterfall
monthlySold comps — $/sqft
last 12 mo · ≤1 miLoading sold comps…