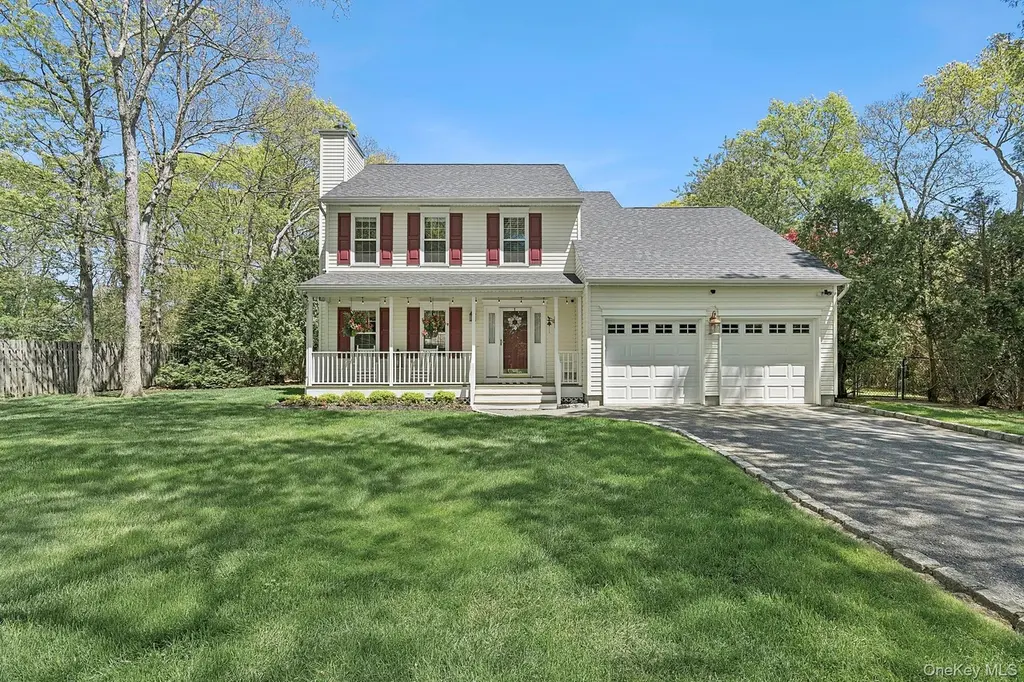
15 Rosebriar Ln · East Quogue, NY
Flood risk 1/10 · Minimal
- FEMA flood zone
- X (unshaded)
- Chance of flooding over 30 yrs
- 0.0%
- Est. flood insurance / yr
- $473 – $860
Fire risk 2/10 · Minimal
- Est. fire insurance / yr
- $691 – $1,283
Heat risk 4/10 · Minor
- Hot days now (above 90°F)
- 7 days/yr
- Hot days in 30 yrs
- 20 days/yr
Wind risk 8/10 · Major
- Chance of severe wind over 30 yrs
- 80.0%
Air-quality risk 3/10 · Minor
- Unhealthy air days now
- 2 days/yr
- Unhealthy air days in 30 yrs
- 3 days/yr
Risk factors via First Street. Map © Google.
Why this score? — see what drove the C+ grade
The composite is a weighted blend of 9 inputs, each scored 0–100. Each bar is that input's sub-score; the figure is the points it added to the 100-point composite (weight × sub-score).
- Cash flow +30.0/30.0
- DSCR +10.0/10.0
- 1% rule +7.9/10.0
- Schools +5.0/10.0
- Livability +3.1/5.0
- Rent growth +2.5/5.0
- Condition / age +2.5/5.0
- ARV discount +2.0/15.0
- Appreciation +0.0/10.0
$1,449,000
🖨 Deal sheet 📄 Offer letter ✓ Due diligence
Listing remarks
IMPECCABLY MAINTAINED IN EAST QUOGUE Located on a half-acre in East Quogue, 15 Rosebriar Lane offers 3 bedrooms, 2.5 bathrooms, and 1,964± SF of impeccably maintained living space with a heated pool and fenced backyard. The first floor features a welcoming foyer, living room with wood-burning fireplace and built-in bookcases, formal dining room, and an eat-in kitchen with granite countertops, pantry, breakfast nook, and new (2026) GE appliances. Just off the kitchen, the den opens to the backyard through sliding glass doors, creating an easy indoor-outdoor flow. Upstairs, the primary suite includes a vaulted ceiling, 6' x 11' walk-in closet, and en-suite bath with double vanity, jett
Key facts
- Built in bookcases
- New ge appliances
- Granite countertops
Tags
Property features AI
Exterior
- Parking: Driveway; 2-car garage; Garage present (detached/attached type not specified); No carport
- Utilities: Septic tank; Utilities: See remarks
- Home design: Single family residence
- Construction: Frame and vinyl siding construction
- Exterior features: Private in-ground vinyl pool; Frame construction with vinyl siding; Not waterfront
Interior
- Kitchen: Granite counters; Electric range / oven; Range; Dishwasher; Refrigerator
- Bedrooms: 6 total rooms (bedroom count not explicitly provided)
- Flooring: Hardwood; Tile
- Bathrooms: 2 full bathrooms; 1 half bathroom
- Heating & cooling: Forced air heating (oil); Central air conditioning; Fireplace (1)
- Interior features: Ceiling fan(s); Central vacuum; Double vanity; Eat-in kitchen; Formal dining; Granite counters; Primary bathroom; Soaking tub; Walk-in closet(s); Washer/dryer hookup; Unfinished basement; Unfinished attic
- Laundry & utility: Laundry room; Washer; Dryer; Washer/dryer hookup
Neighborhood map
What this means for you Summary
Snapshot
- This is a 3-bed/2.0-bath single-family listed at $1.45M.
Deal economics
- At list price, monthly cash flow is $6k ($72k/yr) — positive.
- The deal already cash-flows at list — no discount required.
- Meets the 1% rule at list price ($19k rent vs $1.45M).
- Recommended offer: $1.43M (1.5% below list) — sets the bar for market timing.
Location & tenants
- Location reads 61/100 on livability (#943 in NY) — a middle-class / working-renter tenant base. Strengths: crime A+, employment A+; Watch: amenities F, commute F, cost of living F.
- East Quogue Union Free School District (suburban): math 55% / reading 50% proficiency, ranked #342 of 755 in NY (top 45%) — acceptable for families but not a draw, mixed tenant base, ~2y average lease; only 15% free/reduced lunch — higher-income household profile.
- Zoned schools: East Quogue School (math 57% / reading 62%, grade B-, #745 of 2,108 statewide, top 39%, 355 students, 31% FRL) — zoned schools average 31% FRL vs 15% district-wide (16 pts higher); higher-poverty schools than district average — tighter screening recommended.
- Market conditions: 75 active listings in the ZIP; 19 comparable units currently listed for rent nearby; rentals at typical pace (median 22d on market — plan ~3-4 weeks tenant-placement turnaround); 1,366 units permitted in Suffolk County in 2024 (216 in 5+ unit buildings).
Forward outlook
- Local home prices are declining (-3.0%/yr); year-one equity from $10k of loan paydown is wiped out by about $43k of value loss. Plan a longer hold.
- Suffolk County population projected to shrink 5% by 2050 — rents likely to lag national; underwrite the cash flow, not the appreciation.
- At projected returns (-3.0% appreciation + 3.0% rent growth), your $406k cash investment doubles in ~7 years — after that, you're playing with house money.
Negotiation context
- It's been on market 23 days — a 2% lower offer ($1.43M) is reasonable based on typical stale-listing flexibility.
- Current owner paid $399k; list at $1.45M implies a 263% gain — meaningful room to come down on a strong offer.
Risks & watch-outs
- Climate carrying-cost: severe wind risk, 80% chance of damaging wind over 30y — expect insurance premiums to compound above CPI over the hold.
Questions for the listing agent
- Is there a deadline driving the sale (1031 exchange, divorce, estate, relocation)? That informs how much negotiation room exists.
- Schools are B-rated — typically a magnet for longer-tenancy family renters. What's the average tenant stay here, and is there a school-zone premium baked into asking?
- What's the average days-on-market for RENTAL listings here right now (not sales)? A rising rental-DOM trend means longer vacancies and softer asking-rent achievability than the comps imply.
- What's the recent tenant-quality profile in this submarket — average credit score on applications, eviction rate, late-payment / NSF rate, and stable-employment percentage? A property-management company in the area should have these aggregated.
- How much new for-sale + rental construction is in the pipeline within 1–3 miles? Heavy new supply typically softens prices + rents 12–24 months out; constrained supply supports both.
Investment metrics
- 1% rule
- 1.29% ✓
- Cap rate
- 11.26%
- Cash-on-cash
- 17.75%
- DSCR
- 1.79
- GRM
- 6.4
CMA / ARV
- ARV (on-the-fly)
- $1,290,348
- Comps found
- 12
Show comp detail 12 sales within ~0.75 mi
| Address | Dist | Beds/Ba | Sqft | Sold | Price | $/sf | Match |
|---|---|---|---|---|---|---|---|
| 76 Eisenhower Dr | 0.26mi | 3/3.0 | 2,000 (+2%) | 14mo | $1,600,000 | $800 | 70 |
| 4 Beechnut Ct | 0.26mi | 3/2.0 | 1,800 (-8%) | 10mo | $1,160,000 | $644 | 66 |
| 5 Tamarack Ln | 0.13mi | 4/3.0 (+1) | 2,100 (+7%) | 10mo | $1,380,000 | $657 | 65 |
| 5 Canvasback Ln | 0.52mi | 2/2.0 (-1) | 1,898 (-3%) | 2mo | $1,250,000 | $659 | 63 |
| 33 Eisenhower Dr | 0.25mi | 4/2.5 (+1) | 2,066 (+5%) | 22mo | $860,000 | $416 | 54 |
| 16 Squires Ave | 0.53mi | 4/2.5 (+1) | 1,840 (-6%) | 5mo | $1,060,000 | $576 | 54 |
| 50 Sherwood Rd | 0.59mi | 3/2.0 | 1,804 (-8%) | 7mo | $1,099,000 | $609 | 53 |
| 7 Washington Dr | 0.50mi | 4/2.0 (+1) | 2,060 (+5%) | 13mo | $1,100,000 | $534 | 53 |
| 44 Head Of Lots Rd | 0.41mi | 3/2.0 | 1,811 (-8%) | 21mo | $1,479,000 | $817 | 50 |
| 4 Pine Tree Ct | 0.50mi | 3/3.5 | 1,700 (-13%) | 0mo | $1,485,000 | $874 | 48 |
| 15 Canvasback Ln | 0.62mi | 3/2.0 | 1,890 (-4%) | 20mo | $865,000 | $458 | 48 |
| 15 Osprey Ave | 0.55mi | 4/3.0 (+1) | 2,200 (+12%) | 2mo | $1,700,000 | $773 | 44 |
Match score weights: distance 35% · size 25% · config 20% · recency 20%. Top-matched comps best support the ARV.
Projected returns pro-forma
-3.0% appreciation · 3.0% rent growth · sell at horizon
- IRR
- 9.2%
- Equity multiple
- 1.36×
- Total profit
- $147,065
- Equity at exit
- $216,051
- IRR
- 18.4%
- Equity multiple
- 2.52×
- Total profit
- $618,487
- Equity at exit
- $125,283
Cash invested: $405,720 (down + closing). Projections, not guarantees.
Landlord ↔ Tenant lean methodology
- Overall (STATE)
- 15 Strongly Tenant-Friendly
- State New York
- 15 Strongly Tenant-Friendly · D+10
- County
- — inherits STATE
- City
- — inherits STATE
ZIP-level market 11942
- Home prices YoY
- -25.0%
- Active inventory
- 75
- Price-to-rent
- 6.4×
Monthly cashflow live
- Estimated rent
- $18,737 high interval (Pro) →
- Mortgage (P&I)
- −$7,599
- Tax from tax record
- −$597 /mo · $7,163/yr
- Insurance
- −$604
- HOA
- −$0
- Vacancy / Maint / Mgmt
- −$3,935
- Net cashflow
- $6,003
Break-even live
UW: 25.0% down · 7.5% · 30yr · 1.5% tax · 5.0% vac · 8.0% maint · 8.0% mgmt
Financing live
Cash to close
- Down payment
- $362,250
- Closing costs
- $43,470
- Reserves months
- —
- Total cash needed
- —
Loan-product check · same deal, 3 products live
Conventional
25% down · 7.5% · 30yr
- Down + closing
- —
- Monthly P&I
- —
- Monthly cashflow
- —
- DSCR
- —
- Eligible?
- —
Personal DTI + credit; lowest rate.
DSCR
20% down · 8.5% · 30yr
- Down + closing
- —
- Monthly P&I
- —
- Monthly cashflow
- —
- DSCR
- —
- Eligible?
- —
No personal income docs; deal must DSCR.
Hard money
10% down · 12.0% · 12mo
- Down + closing
- —
- Monthly P&I
- —
- Monthly cashflow
- —
- DSCR
- —
- Eligible?
- —
Short-term bridge; refi at stabilization.
Rent comps 19 comps
| Address | Beds | Baths | Sqft | Rent | $/sqft | DOM | Units | Dist |
|---|---|---|---|---|---|---|---|---|
| 10 Skyes Neck Ct East Quogue, NY | 4.0 | 3.0 | 2249 | $80,000 | $35.57 | 24d | 1 | 0.23mi |
| 4 Bennett Dr East Quogue, NY | 4.0 | 3.0 | 2400 | $11,000 | $4.58 | 17d | 1 | 0.30mi |
| 4 Bennett Dr East Quogue, NY | 4.0 | 3.0 | 2144 | $11,000 | $5.13 | 5d | 1 | 0.30mi |
| 4 Aerie Way East Quogue, NY | 4.0 | 3.0 | 2400 | $11,000 | $4.58 | 15d | 1 | 0.32mi |
| 15 Birchwood Ln East Quogue, NY | 3.0 | 3.0 | 1635 | $5,000 | $3.06 | 43d | 1 | 0.34mi |
| 10 Foxboro Rd Hampton Bays, NY | 4.0 | 2.5 | 2308 | $17,000 | $7.37 | 43d | 1 | 0.57mi |
| 13 Beachland Ave East Quogue, NY | 4.0 | 4.0 | 2028 | $38,000 | $18.74 | 22d | 1 | 0.69mi |
| 2 Fairview Rd Hampton Bays, NY | 2.0 | 1.0 | 1440 | $17,500 | $12.15 | 17d | 1 | 0.83mi |
| 23 Whiting Rd East Quogue, NY | 4.0 | 3.5 | 2296 | $60,000 | $26.13 | 22d | 1 | 0.97mi |
| 30 Vail Ave East Quogue, NY | 3.0 | 2.0 | 1260 | $38,500 | $30.56 | 24d | 1 | 0.97mi |
| 45 Bellows Ter Unit B Hampton Bays, NY | 4.0 | 2.0 | 1722 | $7,000 | $4.07 | 43d | 1 | 0.98mi |
| 20 Marlin Rd East Quogue, NY | 3.0 | 2.0 | 2000 | $10,000 | $5.00 | 43d | 1 | 1.02mi |
| 6 Rolling Hill Rd Hampton Bays, NY | 3.0 | 3.0 | 1697 | $18,000 | $10.61 | 1d | 1 | 1.13mi |
| 8 Paynes Ln East Quogue, NY | 4.0 | 2.0 | 1776 | $18,000 | $10.14 | 43d | 1 | 1.35mi |
| 2 Bayside Ave East Quogue, NY | 4.0 | 3.0 | 2280 | $80,000 | $35.09 | 22d | 1 | 1.35mi |
| 73 Spinney Rd East Quogue, NY | 3.0 | 2.5 | 2400 | $25,000 | $10.42 | 19d | 1 | 1.42mi |
| 22 W End Ave East Quogue, NY | 3.0 | 2.0 | 1368 | $16,000 | $11.70 | 5d | 1 | 1.42mi |
| 114 Spinney Rd East Quogue, NY | 4.0 | 3.0 | 2201 | $18,000 | $8.18 | 19d | 1 | 1.43mi |
| 85 Lewis Rd East Quogue, NY | 3.0 | 2.0 | 1593 | $4,450 | $2.79 | 43d | 1 | 1.46mi |
Listing history 17 events
-
2026-06-18days on market $1,449,000 Active 23 DOM
-
2026-06-17days on market $1,449,000 Active 22 DOM
-
2026-06-16days on market $1,449,000 Active 21 DOM
-
2026-06-15days on market $1,449,000 Active 20 DOM
-
2026-06-13days on market $1,449,000 Active 18 DOM
-
2026-06-13days on market $1,449,000 Active 17 DOM
-
2026-06-09days on market $1,449,000 Active 14 DOM
-
2026-06-08days on market $1,449,000 Active 13 DOM
-
2026-06-07days on market $1,449,000 Active 12 DOM
-
2026-06-04days on market $1,449,000 Active 9 DOM
-
2026-06-03days on market $1,449,000 Active 8 DOM
-
2026-06-02days on market $1,449,000 Active 7 DOM
-
2026-06-01days on market $1,449,000 Active 6 DOM
-
2026-05-31days on market $1,449,000 Active 5 DOM
-
2026-05-26$1,449,000 Active
-
2002-11-13soldstatus $399,000
-
1998-05-01soldstatus $58,000
ⓘ Source: listings_history table (triggers on properties + properties_extension) + one-shot
backfill from property_details.listing_events for pre-trigger history.
Tax reassessment forecast NY · Partial reset (capped growth)
- Current annual tax
- $7,163 · $597/mo
- Projected year-2 tax
- $15,825 · $1,319/mo
- Expected delta
- +$8,663/yr (+$722/mo · 120.9%)
ⓘ Screening estimate from a state-policy table — verify with the county assessor before closing.
Climate risk First Street
- Flood 1/10 Low FEMA zone X (unshaded) · 0% chance over 30 yrs
- Wildfire 2/10 Low
- Heat 4/10 Moderate 7 d/yr ≥90°F today · 20 d/yr by 30 yrs out
- Wind 8/10 Severe 80% chance of damaging wind over 30 yrs
- Air quality 3/10 Moderate 2 unhealthy d/yr today · 3 by 30 yrs out
Nearby sold comps map
Loading sold comps map…
Walkable amenities ~0.75 mi
Loading nearby amenities…
Taxation est. · year 1
- Rental income
- $224,844
- − Mortgage interest
- −$81,167
- − Property taxes
- −$7,163
- − Insurance
- −$7,245
- − Repairs & maintenance
- −$17,988
- − Management
- −$17,988
- − Depreciation
- −$42,153
- Taxable income
- $51,142
- Est. tax owed @ 24.0%
- −$12,274
- After-tax cash flow
- $59,761/yr
For passive investors: Depreciation is non-cash, so a rental often shows a tax loss while cash-flowing — sheltering income. Rental losses are passive: they offset passive income freely, and up to $25,000/yr can offset ordinary (W-2) income if you actively participate and your MAGI is under $100k (phasing out to $0 by $150k); unused losses carry forward. On sale, claimed depreciation is recaptured at up to 25%, and gains may owe capital-gains tax (a 1031 exchange can defer both). Figures are a year-1 estimate at your 24.0% rate — not tax advice; consult a CPA.
Schools (NCES district)
- District
- East Quogue Union Free School District
- NCES district ID
- 3609900
- Math proficiency
- 55% ▬ 0.00%
- Reading proficiency
- 50% ▲ 5.00%
- Median HH income
- $81,457
- Composite
- 49.79/100
- National rank
- #4207
- State rank
- #342 of 755 in NY
Livability — East Quogue
- Score
- 61/100
- State rank
- #943
- US rank
- #18348
Category grades
Schools grade is shown separately in the Schools card above.
Census & demographics
- Census place
- East Quogue, NY
- City population
- 5,871
- Population (ZIP)
- 5,871
Population outlook (Suffolk County) Hauer SSP2
- Today (2025)
- 1,505,262 people
- By 2030
- 1,498,318 · -0.5%
- By 2040
- 1,471,101 · -2.3%
- By 2050
- 1,424,848 · -5.3%
- By 2075
- 1,337,157 · -11.2%
- By 2100
- 1,217,720 · -19.1%
Race, ethnicity, and origin ACS 2023
- Neighborhood character
- Predominantly White (80%)
- Race & ethnicity
- White 80% Hispanic / Latino 16% Asian 2% Two or more races 2%
- Hispanic origin (detail)
- Mexican 3%
- Common ancestry
- Romanian 6% Scotch-Irish 3% Lithuanian 3%
- Foreign-born
- 13% · Canada, Jamaica, Guatemala
- Languages at home
- 80% English-only · Spanish 12% Other Indo-European 2% Russian/Polish/Slavic 2%
Political lean MEDSL · Suffolk
- 2024 margin
- Lean R (+10.0) · D 45.0% · R 55.0%
- 2008→2024 swing
- -16.0pp toward R · 2008: 6.0pp · 2024: -10.0pp
- All cycles
- 2024: R+10.0 2020: R+0.0 2016: R+8.2 2012: D+2.9 2008: D+6.0
Not yet ingested
- Civics
- —
Market trends
- HPI YoY
- ▼ -145.33%
- Current HPI
- 435.8017
- Rent YoY
- —
- Metro
- —
- State GDP YoY
- ▲ 2.60%
- F500 in state
- 92
Industry mix (Fortune 500 HQ in NY)
| Industry | F500 HQs | Revenue |
|---|---|---|
| Financial Services | 10 | $950B |
|
||
| Consumer Goods | 9 | $162B |
|
||
| Insurance | 4 | $225B |
|
||
| Telecommunications | 2 | $144B |
|
||
| Pharmaceuticals | 2 | $112B |
|
||
| Media / Entertainment | 2 | $69B |
|
||
Price history
+2398.3% since first listed3 events — show timeline
- 2026-05-26 Listed $1,449,000 OneKey® MLS as Distributed by MLS Grid
- 2002-11-13 Sold (Public Records) $399,000 Public Records
- 1998-05-01 Sold (Public Records) $58,000 Public Records
Property tax history
+0.4%/yrLatest (2022): $7,163 · +0.0% YoY. Source: county tax records.
Cash-flow waterfall
monthlySold comps — $/sqft
last 12 mo · ≤1 miLoading sold comps…