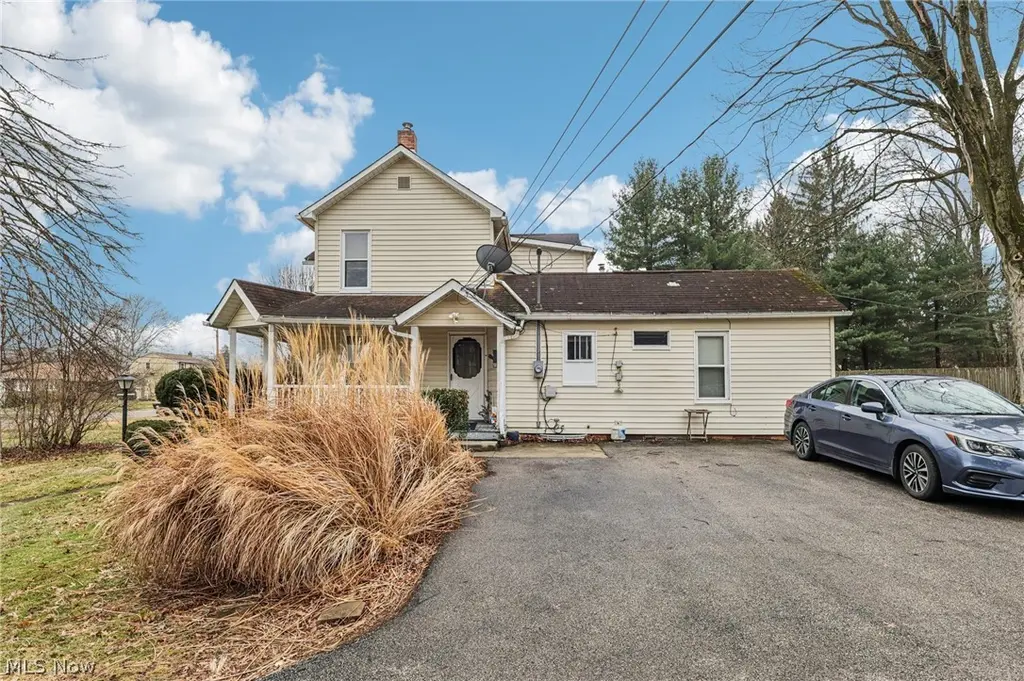
5810 West Blvd · Youngstown, OH
Flood risk 1/10 · Minimal
- FEMA flood zone
- X (unshaded)
- Chance of flooding over 30 yrs
- 0.0%
- Est. flood insurance / yr
- $473 – $860
Fire risk 1/10 · Minimal
- Est. fire insurance / yr
- $713 – $1,323
Heat risk 3/10 · Minor
- Hot days now (above 97°F)
- 7 days/yr
- Hot days in 30 yrs
- 17 days/yr
Wind risk 1/10 · Minimal
- Chance of severe wind over 30 yrs
- —
Air-quality risk 2/10 · Minimal
- Unhealthy air days now
- 1 days/yr
- Unhealthy air days in 30 yrs
- 2 days/yr
Risk factors via First Street. Map © Google.
Why this score? — see what drove the C+ grade
The composite is a weighted blend of 9 inputs, each scored 0–100. Each bar is that input's sub-score; the figure is the points it added to the 100-point composite (weight × sub-score).
- Cash flow +23.5/30.0
- DSCR +7.6/10.0
- ARV discount +7.5/15.0
- 1% rule +6.9/10.0
- Schools +5.7/10.0
- Rent growth +4.1/5.0
- Livability +4.0/5.0
- Condition / age +2.5/5.0
- Appreciation +0.0/10.0
$124,999
🖨 Deal sheet 📄 Offer letter ✓ Due diligence
Listing remarks MLS
Investment opportunity in Boardman, a motivated seller has just made a significant price adjustment! Public records currently reflect this property as a single-family home; however, it is presently utilized as a converted triplex. The main floor features two separate 1-bedroom, 1-bath units, while the upper level includes an additional 1-bedroom, 1-bath unit. This layout offers multiple income streams and flexibility for investors or owner-occupants looking to offset expenses. Conveniently located near shopping, restaurants, and major roadways, providing easy access to everyday amenities. Buyers are responsible for verifying zoning, use, and any required approvals with the local municipality. Great opportunity to add to your investment portfolio or convert back to a single-family home, now offered at an even more attractive price point!
Key facts
- Converted triplex
- Conveniently located
- 0.53 acre lot
Tags
Neighborhood map
What this means for you Summary
Snapshot
- This is a 4-bed/2.5-bath single-family listed at $125k.
Deal economics
- At list price, monthly cash flow is $234 ($3k/yr) — positive.
- The deal already cash-flows at list — no discount required.
- Meets the 1% rule at list price ($1k rent vs $125k).
- Recommended offer: $114k (9.0% below list) — sets the bar for market timing.
- Cap rate 8.5% vs local median 7.0% in Youngstown — meaningfully above typical; check what's discounted (condition, days-on-market, listing class) to confirm the premium yield is real.
Location & tenants
- Location reads 81/100 on livability (#99 in OH, #1,506 nationally) — a professional / high-income tenant draw. Strengths: amenities A+, commute A+, cost of living A+; Watch: crime F, employment F.
- Boardman Local (urban): math 63% / reading 71% proficiency, ranked #189 of 656 in OH (top 29%) — acceptable for families but not a draw, mixed tenant base, ~2y average lease.
- Market conditions: Rents rising fast (+6.6%/yr); 136 active listings in the ZIP; 147 units permitted in Mahoning County in 2024 (0 in 5+ unit buildings).
Forward outlook
- Local home prices are declining (-3.0%/yr); year-one equity from $864 of loan paydown is wiped out by about $4k of value loss. Plan a longer hold.
- Mahoning County population projected at -14% by 2050 — secular population decline; favor cash flow + early exit over multi-decade hold.
- At projected returns (-3.0% appreciation + 6.6% rent growth), your $35k cash investment doubles in ~9 years — after that, you're playing with house money.
Negotiation context
- It's been on market 105 days — a 9% lower offer ($114k) is reasonable based on typical stale-listing flexibility.
- 4 sale attempts since 8y ago; this cycle's ask has dropped $25k (17%) from the opening price — seller is motivated, your offer sets the floor, not the list.
- Current owner paid $65k; list at $125k implies a 92% gain — meaningful room to come down on a strong offer.
Risks & watch-outs
- Watch-outs: built in 1891 — expect roof / HVAC / electrical / plumbing capex.
Questions for the listing agent
- It's been on market 105 days. Have you received any prior offers? Is the seller open to a 9% concession, seller financing, or rate buy-down credit?
- Built in 1891 — when were the roof, HVAC, electrical panel, plumbing, and water heater last replaced?
- Why hasn't it sold? Are there any deal-killer items the seller is aware of (foundation, flood, title, zoning, code violations)?
- Is there a deadline driving the sale (1031 exchange, divorce, estate, relocation)? That informs how much negotiation room exists.
- Crime grade is F in this area — have there been break-ins, vandalism, or insurance claims at this property in the last 3 years? What carrier currently insures it and at what premium?
- What's the average days-on-market for RENTAL listings here right now (not sales)? A rising rental-DOM trend means longer vacancies and softer asking-rent achievability than the comps imply.
- What's the recent tenant-quality profile in this submarket — average credit score on applications, eviction rate, late-payment / NSF rate, and stable-employment percentage? A property-management company in the area should have these aggregated.
- How much new for-sale + rental construction is in the pipeline within 1–3 miles? Heavy new supply typically softens prices + rents 12–24 months out; constrained supply supports both.
Investment metrics
- 1% rule
- 1.19% ✓
- Cap rate
- 8.54%
- Cash-on-cash
- 8.02%
- DSCR
- 1.36
- GRM
- 7.0
CMA / ARV
- ARV (median comp)
- $251,307
- List price
- $124,999
- Delta
- -50.26%
- Verdict
- UNDERPRICED
- Comps
- 20 within 1.0 mi
Show comp detail 12 sales within ~0.75 mi
| Address | Dist | Beds/Ba | Sqft | Sold | Price | $/sf | Match |
|---|---|---|---|---|---|---|---|
| 739 Glen Park Rd | 0.06mi | 3/1.5 (-1) | 1,800 (-6%) | 4mo | $184,500 | $103 | 75 |
| 280 Wildwood Dr | 0.47mi | 4/1.5 | 1,920 (+0%) | 8mo | $233,000 | $121 | 67 |
| 227 Wolcott Dr | 0.48mi | 3/2.5 (-1) | 1,880 (-2%) | 3mo | $295,000 | $157 | 67 |
| 244 Shields Rd | 0.68mi | 4/2.5 | 1,856 (-3%) | 2mo | $260,000 | $140 | 62 |
| 242 Oakley Ave | 0.68mi | 4/2.0 | 1,868 (-2%) | 2mo | $222,000 | $119 | 60 |
| 804 Brookfield Ave | 0.58mi | 5/3.0 (+1) | 1,877 (-2%) | 3mo | $385,000 | $205 | 60 |
| 272 Ewing | 0.55mi | 3/1.5 (-1) | 1,937 (+1%) | 8mo | $180,000 | $93 | 57 |
| 354 Ewing Rd | 0.43mi | 4/1.0 | 1,650 (-14%) | 1mo | $160,000 | $97 | 50 |
| 169 Wolcott Dr | 0.58mi | 3/1.5 (-1) | 1,710 (-11%) | 6mo | $201,000 | $118 | 42 |
| 419 Brookfield Ave | 0.51mi | 3/1.5 (-1) | 2,192 (+14%) | 4mo | $199,000 | $91 | 40 |
| 418 Jaronte Dr | 0.62mi | 5/3.5 (+1) | 1,732 (-10%) | 8mo | $300,000 | $173 | 39 |
| 537 West Glen Dr | 0.57mi | 3/3.0 (-1) | 1,651 (-14%) | 8mo | $200,000 | $121 | 37 |
Match score weights: distance 35% · size 25% · config 20% · recency 20%. Top-matched comps best support the ARV.
Projected returns pro-forma
-3.0% appreciation · 6.56% rent growth · sell at horizon
- IRR
- 0.1%
- Equity multiple
- 1.01×
- Total profit
- $201
- Equity at exit
- $18,638
- IRR
- 13.4%
- Equity multiple
- 2.25×
- Total profit
- $43,899
- Equity at exit
- $10,808
Cash invested: $35,000 (down + closing). Projections, not guarantees.
Landlord ↔ Tenant lean methodology
- Overall (STATE)
- 73 Landlord-Friendly
- State Ohio
- 73 Landlord-Friendly · R+6
- County
- — inherits STATE
- City
- — inherits STATE
ZIP-level market 44512
- Home prices YoY
- -21.0%
- Rents YoY
- 6.6%
- Active inventory
- 136
- Price-to-rent
- 7.0×
Monthly cashflow live
- Estimated rent
- $1,482 medium interval (Pro) →
- Mortgage (P&I)
- −$656
- Tax from tax record
- −$229 /mo · $2,753/yr
- Insurance
- −$52
- HOA
- −$0
- Vacancy / Maint / Mgmt
- −$311
- Net cashflow
- $234
Break-even live
UW: 25.0% down · 7.5% · 30yr · 1.5% tax · 5.0% vac · 8.0% maint · 8.0% mgmt
Financing live
Cash to close
- Down payment
- $31,250
- Closing costs
- $3,750
- Reserves months
- —
- Total cash needed
- —
Loan-product check · same deal, 3 products live
Conventional
25% down · 7.5% · 30yr
- Down + closing
- —
- Monthly P&I
- —
- Monthly cashflow
- —
- DSCR
- —
- Eligible?
- —
Personal DTI + credit; lowest rate.
DSCR
20% down · 8.5% · 30yr
- Down + closing
- —
- Monthly P&I
- —
- Monthly cashflow
- —
- DSCR
- —
- Eligible?
- —
No personal income docs; deal must DSCR.
Hard money
10% down · 12.0% · 12mo
- Down + closing
- —
- Monthly P&I
- —
- Monthly cashflow
- —
- DSCR
- —
- Eligible?
- —
Short-term bridge; refi at stabilization.
Listing history 30 events
-
2026-06-19days on market $124,999 Active 105 DOM
-
2026-06-18days on market $124,999 Active 104 DOM
-
2026-06-17days on market $124,999 Active 103 DOM
-
2026-06-16price $124,999 Active 102 DOM
-
2026-06-16days on market $134,999 Active 102 DOM
-
2026-06-15days on market $134,999 Active 101 DOM
-
2026-06-14days on market $134,999 Active 99 DOM
-
2026-06-13days on market $134,999 Active 98 DOM
-
2026-06-10days on market $134,999 Active 96 DOM
-
2026-06-09days on market $134,999 Active 95 DOM
-
2026-06-08days on market $134,999 Active 94 DOM
-
2026-06-07days on market $134,999 Active 93 DOM
-
2026-06-05days on market $134,999 Active 90 DOM
-
2026-06-03status $134,999 Active 88 DOM
-
2026-06-02days on market $134,999 Contingent 88 DOM
-
2026-06-01days on market $134,999 Contingent 87 DOM
-
2026-05-31days on market $134,999 Contingent 86 DOM
-
2026-05-30days on market $134,999 Contingent 85 DOM
-
2026-05-14historical Contingent 848-char remark
Show marketing remark (848 chars)
Investment opportunity in Boardman, a motivated seller has just made a significant price adjustment! Public records currently reflect this property as a single-family home; however, it is presently utilized as a converted triplex. The main floor features two separate 1-bedroom, 1-bath units, while the upper level includes an additional 1-bedroom, 1-bath unit. This layout offers multiple income streams and flexibility for investors or owner-occupants looking to offset expenses. Conveniently located near shopping, restaurants, and major roadways, providing easy access to everyday amenities. Buyers are responsible for verifying zoning, use, and any required approvals with the local municipality. Great opportunity to add to your investment portfolio or convert back to a single-family home, now offered at an even more attractive price point!
-
2026-05-01price $134,999 848-char remark
Show marketing remark (848 chars)
Investment opportunity in Boardman, a motivated seller has just made a significant price adjustment! Public records currently reflect this property as a single-family home; however, it is presently utilized as a converted triplex. The main floor features two separate 1-bedroom, 1-bath units, while the upper level includes an additional 1-bedroom, 1-bath unit. This layout offers multiple income streams and flexibility for investors or owner-occupants looking to offset expenses. Conveniently located near shopping, restaurants, and major roadways, providing easy access to everyday amenities. Buyers are responsible for verifying zoning, use, and any required approvals with the local municipality. Great opportunity to add to your investment portfolio or convert back to a single-family home, now offered at an even more attractive price point!
-
2026-03-06$149,999 Active 848-char remark
Show marketing remark (848 chars)
Investment opportunity in Boardman, a motivated seller has just made a significant price adjustment! Public records currently reflect this property as a single-family home; however, it is presently utilized as a converted triplex. The main floor features two separate 1-bedroom, 1-bath units, while the upper level includes an additional 1-bedroom, 1-bath unit. This layout offers multiple income streams and flexibility for investors or owner-occupants looking to offset expenses. Conveniently located near shopping, restaurants, and major roadways, providing easy access to everyday amenities. Buyers are responsible for verifying zoning, use, and any required approvals with the local municipality. Great opportunity to add to your investment portfolio or convert back to a single-family home, now offered at an even more attractive price point!
-
2024-09-19historical
-
2024-07-09status Active
-
2024-07-03historical Contingent
-
2024-06-14$165,000 Active
-
2018-08-08soldstatus $65,000
-
2018-08-07soldstatus $65,000 Sold
-
2018-05-28status Pending
-
2018-05-15price $69,900
-
2018-04-27$79,900 Active
ⓘ Source: listings_history table (triggers on properties + properties_extension) + one-shot
backfill from property_details.listing_events for pre-trigger history.
Tax reassessment forecast OH · Partial reset (capped growth)
- Current annual tax
- $2,753 · $229/mo
- Projected year-2 tax
- $2,753 · $229/mo
- Expected delta
- $0/yr ($0/mo · 0.0%)
ⓘ Screening estimate from a state-policy table — verify with the county assessor before closing.
Climate risk First Street
- Flood 1/10 Low FEMA zone X (unshaded) · 0% chance over 30 yrs
- Wildfire 1/10 Low
- Heat 3/10 Moderate 7 d/yr ≥97°F today · 17 d/yr by 30 yrs out
- Wind 1/10 Low
- Air quality 2/10 Low 1 unhealthy d/yr today · 2 by 30 yrs out
Nearby sold comps map
Loading sold comps map…
Walkable amenities ~0.75 mi
Loading nearby amenities…
Taxation est. · year 1
- Rental income
- $17,784
- − Mortgage interest
- −$7,002
- − Property taxes
- −$2,753
- − Insurance
- −$625
- − Repairs & maintenance
- −$1,423
- − Management
- −$1,423
- − Depreciation
- −$3,636
- Taxable income
- $923
- Est. tax owed @ 24.0%
- −$221
- After-tax cash flow
- $2,584/yr
For passive investors: Depreciation is non-cash, so a rental often shows a tax loss while cash-flowing — sheltering income. Rental losses are passive: they offset passive income freely, and up to $25,000/yr can offset ordinary (W-2) income if you actively participate and your MAGI is under $100k (phasing out to $0 by $150k); unused losses carry forward. On sale, claimed depreciation is recaptured at up to 25%, and gains may owe capital-gains tax (a 1031 exchange can defer both). Figures are a year-1 estimate at your 24.0% rate — not tax advice; consult a CPA.
Schools (NCES district)
- District
- Boardman Local
- NCES district ID
- 3904830
- Math proficiency
- 63% ▼ -13.00%
- Reading proficiency
- 71% ▼ -8.00%
- Median HH income
- $47,613
- Composite
- 56.62/100
- National rank
- #1142
- State rank
- #189 of 656 in OH
Livability — Youngstown
- Score
- 81/100
- State rank
- #99
- US rank
- #1506
Category grades
Schools grade is shown separately in the Schools card above.
Census & demographics
- County
- Mahoning County · 84,956 people
- City population
- 28,503
- Metro
- Youngstown-Warren-Boardman, OH-PA
- Population (ZIP)
- 32,536
- Household income
- $63,317
- Rent vs Own
- Severe rent burden
- 910.0
Population outlook (Mahoning County) Hauer SSP2
- Today (2025)
- 223,932 people
- By 2030
- 218,387 · -2.5%
- By 2040
- 205,367 · -8.3%
- By 2050
- 193,606 · -13.5%
- By 2075
- 173,694 · -22.4%
- By 2100
- 151,147 · -32.5%
Race, ethnicity, and origin ACS 2023
- Neighborhood character
- Predominantly White (81%)
- Race & ethnicity
- White 81% Black 9% Two or more races 6% Hispanic / Latino 5%
- Hispanic origin (detail)
- Mexican 1% Puerto Rican 2%
- Common ancestry
- Romanian 6% Lithuanian 1% Slovak 1%
- Foreign-born
- 4% · Canada
- Languages at home
- 94% English-only · Spanish 2% Arabic 2% Other Indo-European 1%
Political lean MEDSL · Mahoning
- 2024 margin
- Lean R (+9.4) · D 44.9% · R 54.4%
- 2008→2024 swing
- -36.1pp toward R · 2008: 26.6pp · 2024: -9.4pp
- All cycles
- 2024: R+9.4 2020: R+1.9 2016: D+3.0 2012: D+27.7 2008: D+26.6
Not yet ingested
- Civics
- —
Market trends
- HPI YoY
- ▼ -56.75%
- Current HPI
- 213.1446
- Rent YoY
- ▲ 6.56%
- Metro
- Youngstown-Warren-Boardman, OH-PA
- State GDP YoY
- ▲ 1.98%
- F500 in state
- 48
Industry mix (Fortune 500 HQ in OH)
| Industry | F500 HQs | Revenue |
|---|---|---|
| Insurance | 3 | $145B |
|
||
| Industrial Machinery | 3 | $49B |
|
||
| Financial Services | 3 | $24B |
|
||
| Consumer Goods | 2 | $93B |
|
||
| Aerospace / Defense | 2 | $47B |
|
||
| Utilities | 2 | $33B |
|
||
Price history
+69.0% since first listed12 events — show timeline
- 2026-05-14 Contingent — MLSNOW
- 2026-05-01 Price Changed $134,999 MLSNOW
- 2026-03-06 Listed $149,999 MLSNOW
- 2024-09-19 Listing Removed — MLSNOW
- 2024-07-09 Relisted — MLSNOW
- 2024-07-03 Contingent — MLSNOW
- 2024-06-14 Listed $165,000 MLSNOW
- 2018-08-08 Sold (Public Records) $65,000 Public Records
- 2018-08-07 Sold (MLS) $65,000 MLSNOW
- 2018-05-28 Pending — MLSNOW
- 2018-05-15 Price Changed $69,900 MLSNOW
- 2018-04-27 Listed $79,900 MLSNOW
Property tax history
+3.6%/yrLatest (2025): $2,753 · -2.3% YoY. Source: county tax records.
Cash-flow waterfall
monthlySold comps — $/sqft
last 12 mo · ≤1 miLoading sold comps…