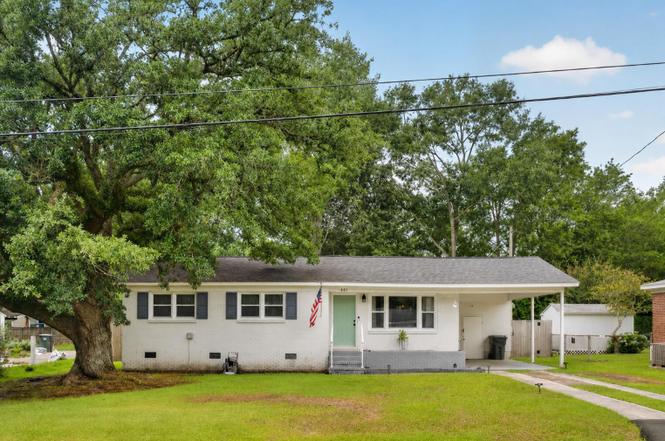
435 Jean Wells Dr · Goose Creek, SC
Flood risk 1/10 · Minimal
- FEMA flood zone
- X (unshaded)
- Chance of flooding over 30 yrs
- 0.0%
- Est. flood insurance / yr
- $507 – $1,088
Fire risk 2/10 · Minimal
- Est. fire insurance / yr
- $783 – $1,453
Heat risk 9/10 · Severe
- Hot days now (above 109°F)
- 7 days/yr
- Hot days in 30 yrs
- 17 days/yr
Wind risk 8/10 · Major
- Chance of severe wind over 30 yrs
- 98.0%
Air-quality risk 2/10 · Minimal
- Unhealthy air days now
- 2 days/yr
- Unhealthy air days in 30 yrs
- 2 days/yr
Risk factors via First Street. Map © Google.
Why this score? — see what drove the D- grade
The composite is a weighted blend of 9 inputs, each scored 0–100. Each bar is that input's sub-score; the figure is the points it added to the 100-point composite (weight × sub-score).
- Cash flow +14.0/30.0
- ARV discount +4.4/15.0
- DSCR +4.3/10.0
- Rent growth +3.6/5.0
- Schools +3.6/10.0
- Livability +3.4/5.0
- 1% rule +2.9/10.0
- Condition / age +2.5/5.0
- Appreciation +0.0/10.0
$275,000
🖨 Deal sheet (PDF) 📄 Offer letter ✓ Due diligence
Listing remarks MLS
Charming turnkey brick ranch in conveniently located boulder bluff on a large lot. This home has been completely renovated to perfection in 2019 with a unique floor plan compared to others in the neighborhood! Boasting a wide open view from kitchen and dining room to living room with stunning upgrades throughout! Perfect for entertaining! You will find 2 graciously sized bedroom and a true master bedroom with its own separate half bathroom with a jack and jill style transition to the hallway bathroom, a unique feature that makes it feel like you have 2 full bathes! The sellers just recently added a pack porch for you to enjoy the spacious backyard properly! The home also boasts a carport. No need to get stuck out in the rain when entering this home! Come see this gorgeous property today!
Key facts
- Open floorplan
- Conveniently located
- Covered back porch
Tags
Property features AI
Exterior
- Parking: 1-car carport; 1 covered parking space
- Utilities: Public sewer; Berkeley Electric Co-Op service; City of Goose Creek utilities
- Home design: Single-family detached home; One story
- Construction: Asphalt roof
- Exterior features: Wood fencing (fully enclosed); Park access; Trash service
Interior
- Kitchen: Electric range; Electric oven; Range hood
- Bedrooms: 3 bedrooms; Primary bedroom on lower level with ceiling fan
- Flooring: Ceramic tile; Luxury vinyl
- Bathrooms: 1.5 bathrooms
- Heating & cooling: Electric heating; Central air conditioning
- Interior features: Smooth ceilings; Ceiling fans; Family room; Living/dining combo; Sunroom
- Laundry & utility: Washer hookup
Neighborhood map
What this means for you Summary
Snapshot
- This is a 3-bed/1.5-bath single-family listed at $275k.
Deal economics
- At list price, monthly cash flow is $38 ($450/yr) — positive.
- The deal already cash-flows at list — no discount required.
- To meet the 1% rule (rent ≥ 1% of price), the offer needs to be $216k (21.3% below list).
- Recommended offer: $216k (21.3% below list) — sets the bar for 1% rule.
- Cap rate 6.5% vs local median 4.0% in Goose Creek — top-decile yield for the area; either an underpriced asset or a hidden risk that comps aren't pricing in. Stress-test before assuming the spread holds.
Location & tenants
- Location reads 67/100 on livability (#103 in SC) — a middle-class / working-renter tenant base. Strengths: housing A+, employment A, cost of living B+; Watch: amenities F, commute F, health & safety F.
- Berkeley 01 (suburban): math 35% / reading 48% proficiency, ranked #30 of 80 in SC (top 38%) — families likely to look elsewhere, expect single-tenant / working-renter base with shorter leases.
- Zoned schools: Boulder Bluff Elementary (math 25% / reading 34%, grade F, #399 of 597 statewide, top 69%, 633 students, 100% FRL); Sedgefield Middle (math 13% / reading 26%, grade F, #182 of 229 statewide, top 80%, 986 students, 100% FRL); Goose Creek High (math 33% / reading 68%, grade D+, #150 of 196 statewide, top 76%, 1,981 students, 52% FRL) — zoned schools average 84% FRL vs 48% district-wide (36 pts higher); higher-poverty schools than district average — tighter screening recommended.
- Market conditions: Rents rising fast (+4.5%/yr); 264 active listings in the ZIP; 5 comparable units currently listed for rent nearby; rentals at typical pace (median 22d on market — plan ~3-4 weeks tenant-placement turnaround); solid renter incomes; 3,183 units permitted in Berkeley County in 2024 (580 in 5+ unit buildings).
- This rent runs 32% of the median local income ($82k/yr) — at the standard rent-burdened threshold; future hikes will face affordability resistance.
Forward outlook
- Local home prices are declining (-3.0%/yr); year-one equity from $2k of loan paydown is wiped out by about $8k of value loss. Plan a longer hold.
- Berkeley County population projected at +48% by 2050 — long-run rental-demand tailwind backs the buy-and-hold thesis.
Negotiation context
- Only 4 days on market — expect competitive offers; lowballing is unlikely to land.
- 3 sale attempts since 7y ago with the ask held roughly flat each time — persistent listings suggest the price (not the market) is what's stuck; bring a comps-based counter.
Risks & watch-outs
- Climate carrying-cost: severe wind risk, 98% chance of damaging wind over 30y; extreme-heat days projected 7→17/yr by 2055 (HVAC capex compounding) — expect insurance premiums to compound above CPI over the hold.
Questions for the listing agent
- Built in 1968 — when were the roof, HVAC, electrical panel, plumbing, and water heater last replaced?
- Is there a deadline driving the sale (1031 exchange, divorce, estate, relocation)? That informs how much negotiation room exists.
- The area grade is low — what's the realistic commute time and amenity access for the typical tenant pool here? Any planned neighborhood developments (good or bad) we should know about?
- What's the average days-on-market for RENTAL listings here right now (not sales)? A rising rental-DOM trend means longer vacancies and softer asking-rent achievability than the comps imply.
- What's the recent tenant-quality profile in this submarket — average credit score on applications, eviction rate, late-payment / NSF rate, and stable-employment percentage? A property-management company in the area should have these aggregated.
- How much new for-sale + rental construction is in the pipeline within 1–3 miles? Heavy new supply typically softens prices + rents 12–24 months out; constrained supply supports both.
Investment metrics
- 1% rule
- 0.79% ✗
- Cap rate
- 6.46%
- Cash-on-cash
- 0.58%
- DSCR
- 1.03
- GRM
- 10.6
CMA / ARV
- ARV (on-the-fly)
- $257,288
- Comps found
- 12
Show comp detail 12 sales within ~0.75 mi
| Address | Dist | Beds/Ba | Sqft | Sold | Price | $/sf | Match |
|---|---|---|---|---|---|---|---|
| 416 Anita Dr | 0.19mi | 3/1.0 | 1,100 (-1%) | 4mo | $255,000 | $232 | 85 |
| 422 Anita Dr | 0.16mi | 3/1.0 | 1,184 (+7%) | 3mo | $239,000 | $202 | 77 |
| 445 Robin Dr | 0.10mi | 3/1.0 | 1,008 (-9%) | 2mo | $175,000 | $174 | 77 |
| 413 Sarah Dr | 0.29mi | 3/1.0 | 1,040 (-6%) | 3mo | $240,000 | $231 | 72 |
| 435 Anita Dr | 0.17mi | 3/1.0 | 1,000 (-10%) | 3mo | $250,000 | $250 | 72 |
| 419 Anita Dr | 0.19mi | 3/1.0 | 1,000 (-10%) | 4mo | $258,000 | $258 | 70 |
| 107 Dennis Dr | 0.29mi | 3/2.0 | 1,200 (+8%) | 4mo | $309,000 | $258 | 68 |
| 417 Robin Dr | 0.16mi | 4/2.0 (+1) | 1,248 (+12%) | 1mo | $139,700 | $112 | 64 |
| 316 Anne St | 0.39mi | 3/1.0 | 1,000 (-10%) | 2mo | $292,000 | $292 | 61 |
| 532 Hansford Dr | 0.27mi | 4/2.0 (+1) | 1,224 (+10%) | 4mo | $250,000 | $204 | 60 |
| 404 Tammie Ave | 0.22mi | 2/1.5 (-1) | 1,275 (+15%) | 7mo | $259,000 | $203 | 54 |
| 318 Jean Wells Dr | 0.59mi | 3/1.0 | 1,008 (-9%) | 5mo | $257,500 | $255 | 52 |
Match score weights: distance 35% · size 25% · config 20% · recency 20%. Top-matched comps best support the ARV.
Projected returns pro-forma
-3.0% appreciation · 4.52% rent growth · sell at horizon
- IRR
- -13.9%
- Equity multiple
- 0.49×
- Total profit
- $-38,921
- Equity at exit
- $41,003
- IRR
- -3.1%
- Equity multiple
- 0.78×
- Total profit
- $-17,038
- Equity at exit
- $23,777
Cash invested: $77,000 (down + closing). Projections, not guarantees.
Landlord ↔ Tenant lean methodology
- Overall (STATE)
- 90 Strongly Landlord-Friendly
- State South Carolina
- 90 Strongly Landlord-Friendly · R+6
- County
- — inherits STATE
- City
- — inherits STATE
ZIP-level market 29445
- Home prices YoY
- -18.0%
- Rents YoY
- 4.5%
- Active inventory
- 264
- Price-to-rent
- 10.6×
Monthly cashflow live
- Estimated rent
- $2,163 high interval (Pro) →
- Mortgage (P&I)
- −$1,442
- Tax from tax record
- −$115 /mo · $1,376/yr
- Insurance
- −$115
- HOA
- −$0
- Vacancy / Maint / Mgmt
- −$454
- Net cashflow
- $38
Break-even live
Sensitivity live
| Price | -10% $193 | -5% $115 | +0% $38 | +5% $-40 | +10% $-118 |
|---|---|---|---|---|---|
| Rent | -10% $-133 | -5% $-48 | +0% $38 | +5% $123 | +10% $208 |
| Rate | -1.0pp $176 | -0.5pp $107 | base $38 | +0.5pp $-34 | +1.0pp $-106 |
UW: 25.0% down · 7.5% · 30yr · 1.5% tax · 5.0% vac · 8.0% maint · 8.0% mgmt
Financing live
Cash to close
- Down payment
- $68,750
- Closing costs
- $8,250
- Reserves months
- —
- Total cash needed
- —
Loan-product check · same deal, 3 products live
Conventional
25% down · 7.5% · 30yr
- Down + closing
- —
- Monthly P&I
- —
- Monthly cashflow
- —
- DSCR
- —
- Eligible?
- —
Personal DTI + credit; lowest rate.
DSCR
20% down · 8.5% · 30yr
- Down + closing
- —
- Monthly P&I
- —
- Monthly cashflow
- —
- DSCR
- —
- Eligible?
- —
No personal income docs; deal must DSCR.
Hard money
10% down · 12.0% · 12mo
- Down + closing
- —
- Monthly P&I
- —
- Monthly cashflow
- —
- DSCR
- —
- Eligible?
- —
Short-term bridge; refi at stabilization.
Rent comps 5 comps
| Address | Beds | Baths | Sqft | Rent | $/sqft | DOM | Units | Dist |
|---|---|---|---|---|---|---|---|---|
| 114 Marinella Dr Goose Creek, SC | 3.0 | 2.0 | 1470 | $2,250 | $1.53 | 24d | 1 | 0.48mi |
| 114 Marinella Dr Goose Creek, SC | 3.0 | 2.0 | 1470 | $2,250 | $1.53 | 22d | 1 | 0.48mi |
| 35 Elmwood Pl Goose Creek, SC | 3.0 | 1.5 | 900 | $1,699 | $1.89 | 24d | 1 | 0.69mi |
| 108 Farm Quarters Dr Goose Creek, SC | 3.0 | 2.0 | 1437 | $2,181 | $1.52 | 15d | 1 | 0.99mi |
| 200 Branchwood Dr Goose Creek, SC | 2.0–3.0 | 2.0 | 943 | $1,575 | $1.67 | 4d | 3 | 1.34mi |
Listing history 3 events
-
2026-06-21days on market $275,000 Active 4 DOM
-
2026-06-17remarks 615-char remark
-
2026-06-17$275,000 Active 1 DOM
ⓘ Source: listings_history table (triggers on properties + properties_extension) + one-shot
backfill from property_details.listing_events for pre-trigger history.
Tax reassessment forecast SC · Resets to sale price
- Current annual tax
- $1,376 · $115/mo
- Projected year-2 tax
- $1,568 · $131/mo
- Expected delta
- +$191/yr (+$16/mo · 13.9%)
ⓘ Screening estimate from a state-policy table — verify with the county assessor before closing.
Climate risk First Street
- Flood 1/10 Low FEMA zone X (unshaded) · 0% chance over 30 yrs
- Wildfire 2/10 Low
- Heat 9/10 Extreme 7 d/yr ≥109°F today · 17 d/yr by 30 yrs out
- Wind 8/10 Severe 98% chance of damaging wind over 30 yrs
- Air quality 2/10 Low 2 unhealthy d/yr today · 2 by 30 yrs out
Nearby sold comps map
Loading sold comps map…
Walkable amenities ~0.75 mi
Loading nearby amenities…
Taxation est. · year 1
- Rental income
- $25,958
- − Mortgage interest
- −$15,404
- − Property taxes
- −$1,376
- − Insurance
- −$1,375
- − Repairs & maintenance
- −$2,077
- − Management
- −$2,077
- − Depreciation
- −$8,000
- Taxable loss
- −$4,350
- Est. tax savings @ 24.0%
- +$1,044
- After-tax cash flow
- $1,495/yr
For passive investors: Depreciation is non-cash, so a rental often shows a tax loss while cash-flowing — sheltering income. Rental losses are passive: they offset passive income freely, and up to $25,000/yr can offset ordinary (W-2) income if you actively participate and your MAGI is under $100k (phasing out to $0 by $150k); unused losses carry forward. On sale, claimed depreciation is recaptured at up to 25%, and gains may owe capital-gains tax (a 1031 exchange can defer both). Figures are a year-1 estimate at your 24.0% rate — not tax advice; consult a CPA.
Schools (NCES district)
- District
- Berkeley 01
- NCES district ID
- 4501170
- Math proficiency
- 35% ▼ -8.00%
- Reading proficiency
- 48% ▼ -2.00%
- Median HH income
- $52,724
- Composite
- 35.95/100
- National rank
- #4799
- State rank
- #30 of 80 in SC
Livability — Goose Creek
- Score
- 67/100
- State rank
- #103
- US rank
- #10912
Category grades
Schools grade is shown separately in the Schools card above.
Census & demographics
- Census place
- Goose Creek, SC
- County
- Berkeley County · 198,768 people
- City population
- 59,227
- Metro
- Charleston-North Charleston, SC
- Population (ZIP)
- 59,227
- Household income
- $81,594
- Rent vs Own
- Severe rent burden
- 1308.0
Population outlook (Berkeley County) Hauer SSP2
- Today (2025)
- 254,184 people
- By 2030
- 279,677 · +10.0%
- By 2040
- 329,379 · +29.6%
- By 2050
- 375,557 · +47.8%
- By 2075
- 476,740 · +87.6%
- By 2100
- 535,945 · +110.8%
Race, ethnicity, and origin ACS 2023
- Neighborhood character
- Diverse neighborhood (Simpson 0.63)
- Race & ethnicity
- White 55% Black 23% Hispanic / Latino 11% Two or more races 9% Asian 3%
- Hispanic origin (detail)
- Mexican 4% Puerto Rican 3%
- Common ancestry
- Slovak 2% Lithuanian 2% Italian 1%
- Foreign-born
- 9% · Canada, Jamaica, Vietnam
- Languages at home
- 86% English-only · Spanish 8% Other Indo-European 2% Tagalog/Filipino 2%
Political lean MEDSL · Berkeley
- 2024 margin
- R (+16.3) · D 41.1% · R 57.4% · Other 1.4%
- 2008→2024 swing
- -3.2pp toward R · 2008: -13.1pp · 2024: -16.3pp
- All cycles
- 2024: R+16.3 2020: R+11.7 2016: R+17.4 2012: R+18.9 2008: R+13.1
Not yet ingested
- Civics
- —
Market trends
- HPI YoY
- ▼ -66.40%
- Current HPI
- 301.8653
- Rent YoY
- ▲ 4.52%
- Metro
- Charleston-North Charleston, SC
- State GDP YoY
- ▲ 4.51%
- F500 in state
- 2
Industry mix (Fortune 500 HQ in SC)
| Industry | F500 HQs | Revenue |
|---|---|---|
| Packaging | 1 | $7B |
|
||
Price history
+400.0% since first listed10 events — show timeline
- 2026-06-17 Listed $275,000 Charleston Trident MLS
- 2022-03-22 Sold (Public Records) $255,000 Public Records
- 2022-03-03 Sold (MLS) $248,000 Charleston Trident MLS
- 2022-01-29 Contingent — Charleston Trident MLS
- 2022-01-26 Listed $250,000 Charleston Trident MLS
- 2019-07-19 Sold (MLS) $170,000 Charleston Trident MLS
- 2019-06-13 Contingent — Charleston Trident MLS
- 2019-06-04 Price Changed $175,000 Charleston Trident MLS
- 2019-06-01 Listed $179,000 Charleston Trident MLS
- 2019-04-11 Sold (Public Records) $55,000 Public Records
Property tax history
+1.5%/yrLatest (2025): $1,376 · +1.8% YoY. Source: county tax records.
Cash-flow waterfall
monthlySold comps — $/sqft
last 12 mo · ≤1 miLoading sold comps…