 Duplex
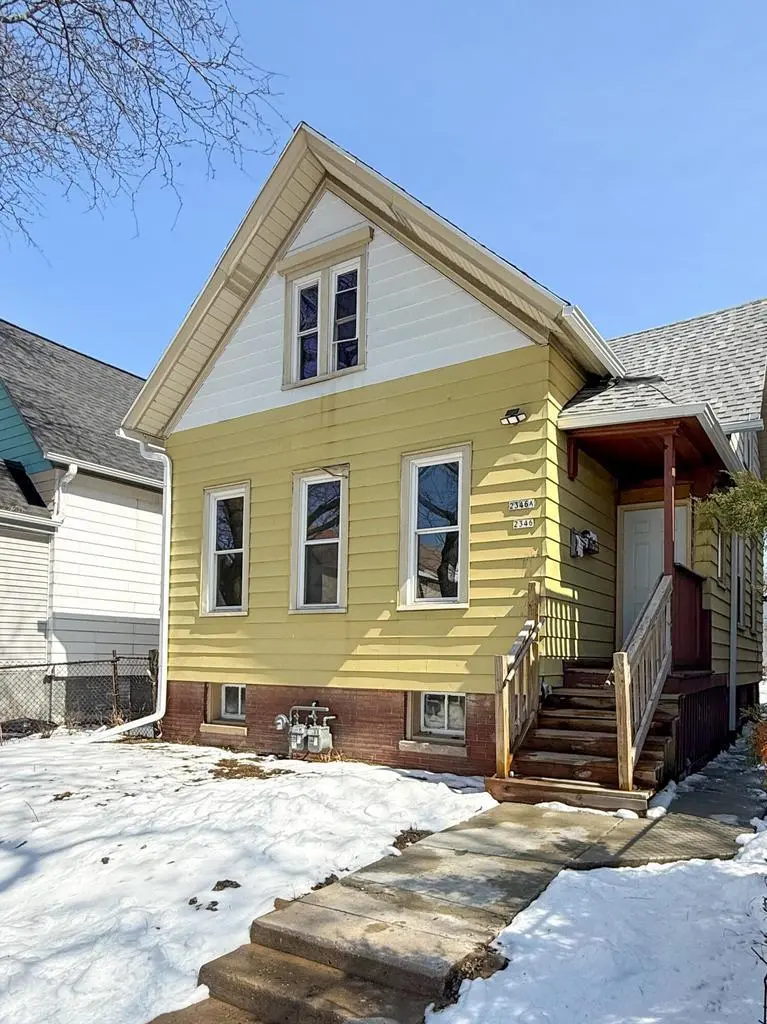
2346 N 18th St · Milwaukee, WI
Flood risk 1/10 · Minimal
- FEMA flood zone
- X (unshaded)
- Chance of flooding over 30 yrs
- 0.0%
- Est. flood insurance / yr
- $473 – $860
Fire risk 1/10 · Minimal
- Est. fire insurance / yr
- $636 – $1,182
Heat risk 2/10 · Minimal
- Hot days now (above 98°F)
- 7 days/yr
- Hot days in 30 yrs
- 13 days/yr
Wind risk 2/10 · Minimal
- Chance of severe wind over 30 yrs
- —
Air-quality risk 3/10 · Minor
- Unhealthy air days now
- 3 days/yr
- Unhealthy air days in 30 yrs
- 4 days/yr
Risk factors via First Street. Map © Google.
Why this score? — see what drove the B+ grade
The composite is a weighted blend of 9 inputs, each scored 0–100. Each bar is that input's sub-score; the figure is the points it added to the 100-point composite (weight × sub-score).
- Cash flow +30.0/30.0
- 1% rule +10.0/10.0
- DSCR +10.0/10.0
- Appreciation +10.0/10.0
- ARV discount +7.5/15.0
- Rent growth +4.6/5.0
- Livability +4.0/5.0
- Condition / age +2.5/5.0
- Schools +1.2/10.0
$134,900
🖨 Deal sheet 📄 Offer letter ✓ Due diligence
Multi-family units
County records classify this as Multi-Family (2-4 Unit). Listing-text estimate: 2 units. confirmed
Listing remarks MLS
Turnkey duplex investment opportunity with strong cash flow potential. Lower unit offers 3 bedrooms and is vacant, perfect for owner occupant or rent at $1000 to $1200 per month. Upper 2 bedroom unit is currently rented at $900 on a month to month lease. Major updates include new roof, gutters, electrical panels for both units, a new water heater and exterior concrete walkway from front to back door all completed in 2025. Low taxes enhance returns. Ideal for investors or first time buyers looking to offset their mortgage with rental income.
Key facts
- Strong cash flow
- Turnkey duplex
- New gutters
Tags
Neighborhood map
What this means for you Summary
Snapshot
- This is a 2 × 2-bed/1.0-bath units multifamily listed at $135k.
Deal economics
- At list price, monthly cash flow is $638 ($8k/yr) — positive. Per door: $319/mo.
- The deal already cash-flows at list — no discount required.
- Meets the 1% rule at list price ($2k rent vs $135k).
- Recommended offer: $127k (6.0% below list) — sets the bar for market timing.
- Cap rate 12.0% vs local median 5.1% in Milwaukee — top-decile yield for the area; either an underpriced asset or a hidden risk that comps aren't pricing in. Stress-test before assuming the spread holds.
Location & tenants
- Location reads 81/100 on livability (#55 in WI, #1,534 nationally) — a professional / high-income tenant draw. Strengths: amenities A+, commute A+, cost of living A+; Watch: employment D+, schools F, crime F.
- Milwaukee School District (urban): math 10% / reading 18% proficiency, ranked #337 of 342 in WI (top 98%) — low school quality limits family demand, transient renter base, plan for 1-2y turnover; 77% free/reduced lunch — lower-income household profile, screen leases tightly.
- Market conditions: Rents rising fast (+8.3%/yr); 150 active listings in the ZIP; 5 comparable units currently listed for rent nearby; rentals at typical pace (median 24d on market — plan ~3-4 weeks tenant-placement turnaround); lower-income renter base — watch delinquency; 1,017 units permitted in Milwaukee County in 2024 (803 in 5+ unit buildings).
- At $2,143/mo this rent would consume 88% of the median local household income ($29k/yr) (locally 2061% of renters already pay >50% of income on rent) — very limited rent-growth headroom before tenants either downsize or default.
Forward outlook
- In year one you build about $14k of equity ($933 loan paydown + $13k appreciation (10.0% local appreciation)).
- Milwaukee County population projected at +4% by 2050 — modest demand growth; plan on rents tracking national, not racing it.
- At projected returns (10.0% appreciation + 8.0% rent growth), your $38k cash investment doubles in ~2 years — after that, you're playing with house money.
- By year 3, paydown + projected appreciation supports a ~$37k cash-out refi (75% LTV) — recoverable capital for the next deal without selling this one.
Negotiation context
- It's been on market 78 days — a 6% lower offer ($127k) is reasonable based on typical stale-listing flexibility.
- 4 sale attempts since 14y ago; this cycle's ask has dropped $15k (10%) from the opening price — seller is motivated, your offer sets the floor, not the list.
- Current owner paid $75k; list at $135k implies a 80% gain — meaningful room to come down on a strong offer.
Risks & watch-outs
- Watch-outs: property tax is 2.6% of price; built in 1889 — expect roof / HVAC / electrical / plumbing capex.
Questions for the listing agent
- It's been on market 78 days. Have you received any prior offers? Is the seller open to a 6% concession, seller financing, or rate buy-down credit?
- Can we see the unit-by-unit rent roll, current vacancy, and any below-market leases? What's the average tenancy length?
- What capital expenditures (roof, boiler, parking lot, exteriors) have been made in the last 5 years, and what's planned in the next 2?
- Built in 1889 — when were the roof, HVAC, electrical panel, plumbing, and water heater last replaced?
- Property tax is high relative to price — has the assessment been appealed recently, and will the sale trigger a re-assessment?
- Why hasn't it sold? Are there any deal-killer items the seller is aware of (foundation, flood, title, zoning, code violations)?
- Is there a deadline driving the sale (1031 exchange, divorce, estate, relocation)? That informs how much negotiation room exists.
- Schools are F-rated, which usually means shorter tenancies and higher turnover. Who's the typical renter profile here, and what's been the actual vacancy rate?
- Crime grade is F in this area — have there been break-ins, vandalism, or insurance claims at this property in the last 3 years? What carrier currently insures it and at what premium?
- What's the average days-on-market for RENTAL listings here right now (not sales)? A rising rental-DOM trend means longer vacancies and softer asking-rent achievability than the comps imply.
- What's the recent tenant-quality profile in this submarket — average credit score on applications, eviction rate, late-payment / NSF rate, and stable-employment percentage? A property-management company in the area should have these aggregated.
- How much new apartment / multifamily construction is in the pipeline within 1–3 miles? Heavy new supply (>2% of stock underway) typically softens rents 12–24 months out; light construction supports rent growth.
Investment metrics
- 1% rule
- 1.59% ✓
- Cap rate
- 11.97%
- Cash-on-cash
- 20.28%
- DSCR
- 1.90
- GRM
- 5.2
CMA / ARV
- ARV (median comp)
- $70,890
- List price
- $134,900
- Delta
- 90.29%
- Verdict
- OVERPRICED
- Comps
- 20 within 1.0 mi
Show comp detail 12 sales within ~0.75 mi
| Address | Dist | Beds/Ba | Sqft | Sold | Price | $/sf | Match |
|---|---|---|---|---|---|---|---|
| 2638 N 22nd St | 0.44mi | 4/2.0 (-1) | 1,687 (-3%) | 3mo | $55,000 | $33 | 68 |
| 2555 N 16th St | 0.28mi | 4/2.0 (-1) | 1,898 (+10%) | 5mo | $95,999 | $51 | 62 |
| 2365 N 20th St Unit 2365A | 0.15mi | 4/2.0 (-1) | 1,936 (+12%) | 12mo | $65,000 | $34 | 58 |
| 2245 N 16th St #2247 | 0.15mi | 4/2.0 (-1) | 1,521 (-12%) | 15mo | $40,000 | $26 | 56 |
| 2848 N 19th St | 0.64mi | 4/2.0 (-1) | 1,650 (-5%) | 3mo | $60,000 | $36 | 54 |
| 2465 N 9th St Unit 2465A | 0.62mi | 4/2.0 (-1) | 1,760 (+2%) | 13mo | $117,000 | $66 | 52 |
| 2136 N 11th St | 0.52mi | 4/2.0 (-1) | 1,920 (+11%) | 6mo | $115,052 | $60 | 47 |
| 2741 N 25th St | 0.72mi | 4/2.0 (-1) | 1,713 (-1%) | 15mo | $75,000 | $44 | 47 |
| 2813 N 21st St | 0.62mi | 6/2.0 (+1) | 1,942 (+12%) | 1mo | $70,000 | $36 | 45 |
| 2716 N 23rd St #2718 | 0.56mi | 4/2.0 (-1) | 1,990 (+15%) | 6mo | $110,000 | $55 | 39 |
| 2927 N 17th St | 0.72mi | 5/2.0 | 1,954 (+13%) | 12mo | $82,500 | $42 | 35 |
| 2753 N 23rd St Unit 2753A | 0.62mi | 4/2.0 (-1) | 1,946 (+12%) | 14mo | $72,000 | $37 | 34 |
Match score weights: distance 35% · size 25% · config 20% · recency 20%. Top-matched comps best support the ARV.
Projected returns pro-forma
10.0% appreciation · 8.0% rent growth · sell at horizon
- IRR
- 42.4%
- Equity multiple
- 4.32×
- Total profit
- $125,561
- Equity at exit
- $121,529
- IRR
- 38.8%
- Equity multiple
- 10.69×
- Total profit
- $366,053
- Equity at exit
- $262,081
Cash invested: $37,772 (down + closing). Projections, not guarantees.
Landlord ↔ Tenant lean methodology
- Overall (STATE)
- 73 Landlord-Friendly
- State Wisconsin
- 73 Landlord-Friendly · R+2
- County
- — inherits STATE
- City
- — inherits STATE
ZIP-level market 53206
- Rents YoY
- 8.3%
- Active inventory
- 150
- Price-to-rent
- 10.5×
Monthly cashflow live
- Estimated rent
- $2,143 high interval (Pro) →
- Mortgage (P&I)
- −$707
- Tax from tax record
- −$291 /mo · $3,492/yr
- Insurance
- −$56
- HOA
- −$0
- Vacancy / Maint / Mgmt
- −$450
- Net cashflow
- $638
Break-even live
2-unit breakdown (identical units grouped — click to expand)
| Units | Beds | Baths | Est. rent |
|---|---|---|---|
| 2× units | 2 | 1 | $2,142 |
| #1 | 2 | 1 | $1,071 |
| #2 | 2 | 1 | $1,071 |
| Total (2 units) | $2,143 | ||
UW: 25.0% down · 7.5% · 30yr · 1.5% tax · 5.0% vac · 8.0% maint · 8.0% mgmt
Financing live
Cash to close
- Down payment
- $33,725
- Closing costs
- $4,047
- Reserves months
- —
- Total cash needed
- —
Loan-product check · same deal, 3 products live
Conventional
25% down · 7.5% · 30yr
- Down + closing
- —
- Monthly P&I
- —
- Monthly cashflow
- —
- DSCR
- —
- Eligible?
- —
Personal DTI + credit; lowest rate.
DSCR
20% down · 8.5% · 30yr
- Down + closing
- —
- Monthly P&I
- —
- Monthly cashflow
- —
- DSCR
- —
- Eligible?
- —
No personal income docs; deal must DSCR.
Hard money
10% down · 12.0% · 12mo
- Down + closing
- —
- Monthly P&I
- —
- Monthly cashflow
- —
- DSCR
- —
- Eligible?
- —
Short-term bridge; refi at stabilization.
Rent comps 5 comps
| Address | Beds | Baths | Sqft | Rent | $/sqft | DOM | Units | Dist |
|---|---|---|---|---|---|---|---|---|
| 2308 W Clarke St Milwaukee, WI | 4.0 | 2.0 | 1545 | $1,750 | $1.13 | 23d | 1 | 0.44mi |
| 2432 N 28th St Milwaukee, WI | 5.0 | 1.5 | 1876 | $1,600 | $0.85 | 43d | 1 | 0.69mi |
| 2478-2480 W Juneau Ave Unit 2478 Milwaukee, WI | 4.0 | 1.0 | 1375 | $1,495 | $1.09 | 23d | 1 | 1.21mi |
| 2704 W Concordia Ave Unit Na Milwaukee, WI | 5.0 | 2.0 | 1856 | $2,500 | $1.35 | 23d | 1 | 1.35mi |
| 3388 N 27th St Unit 3388 Front House Milwaukee, WI | 4.0 | 1.0 | 1212 | $1,550 | $1.28 | 4d | 1 | 1.45mi |
Listing history 19 events
-
2026-06-09days on market $134,900 Active 78 DOM
-
2026-06-08days on market $134,900 Active 77 DOM
-
2026-06-07days on market $134,900 Active 76 DOM
-
2026-06-05days on market $134,900 Active 73 DOM
-
2026-06-03days on market $134,900 Active 72 DOM
-
2026-06-02days on market $134,900 Active 71 DOM
-
2026-06-01days on market $134,900 Active 70 DOM
-
2026-05-31days on market $134,900 Active 69 DOM
-
2026-03-30price $134,900 546-char remark
Show marketing remark (546 chars)
Turnkey duplex investment opportunity with strong cash flow potential. Lower unit offers 3 bedrooms and is vacant, perfect for owner occupant or rent at $1000 to $1200 per month. Upper 2 bedroom unit is currently rented at $900 on a month to month lease. Major updates include new roof, gutters, electrical panels for both units, a new water heater and exterior concrete walkway from front to back door all completed in 2025. Low taxes enhance returns. Ideal for investors or first time buyers looking to offset their mortgage with rental income.
-
2026-03-23$149,900 Active 546-char remark
Show marketing remark (546 chars)
Turnkey duplex investment opportunity with strong cash flow potential. Lower unit offers 3 bedrooms and is vacant, perfect for owner occupant or rent at $1000 to $1200 per month. Upper 2 bedroom unit is currently rented at $900 on a month to month lease. Major updates include new roof, gutters, electrical panels for both units, a new water heater and exterior concrete walkway from front to back door all completed in 2025. Low taxes enhance returns. Ideal for investors or first time buyers looking to offset their mortgage with rental income.
-
2025-10-13soldstatus $75,000
-
2025-02-08historical 186-char remark
Show marketing remark (186 chars)
currently vacant turnkey duplex that is ready for a new owner to place tenants and collect market rent 1600-1650 per month with potential to get up to 1850 -1900 per month with upgrades.
-
2024-11-08$89,900 Active 186-char remark
Show marketing remark (186 chars)
currently vacant turnkey duplex that is ready for a new owner to place tenants and collect market rent 1600-1650 per month with potential to get up to 1850 -1900 per month with upgrades.
-
2021-10-01soldstatus $20,000
-
2016-07-20soldstatus $6,750 Sold
-
2016-06-09$9,000 Active
-
2012-10-10$29,000
-
2012-10-10historical
-
2007-11-23soldstatus $90,000
ⓘ Source: listings_history table (triggers on properties + properties_extension) + one-shot
backfill from property_details.listing_events for pre-trigger history.
Tax reassessment forecast WI · Partial reset (capped growth)
- Current annual tax
- $3,492 · $291/mo
- Projected year-2 tax
- $3,492 · $291/mo
- Expected delta
- $0/yr ($0/mo · 0.0%)
ⓘ Screening estimate from a state-policy table — verify with the county assessor before closing.
Climate risk First Street
- Flood 1/10 Low FEMA zone X (unshaded) · 0% chance over 30 yrs
- Wildfire 1/10 Low
- Heat 2/10 Low 7 d/yr ≥98°F today · 13 d/yr by 30 yrs out
- Wind 2/10 Low
- Air quality 3/10 Moderate 3 unhealthy d/yr today · 4 by 30 yrs out
Nearby sold comps map
Loading sold comps map…
Walkable amenities ~0.75 mi
Loading nearby amenities…
Taxation est. · year 1
- Rental income
- $25,716
- − Mortgage interest
- −$7,556
- − Property taxes
- −$3,492
- − Insurance
- −$674
- − Repairs & maintenance
- −$2,057
- − Management
- −$2,057
- − Depreciation
- −$3,924
- Taxable income
- $5,954
- Est. tax owed @ 24.0%
- −$1,429
- After-tax cash flow
- $6,231/yr
For passive investors: Depreciation is non-cash, so a rental often shows a tax loss while cash-flowing — sheltering income. Rental losses are passive: they offset passive income freely, and up to $25,000/yr can offset ordinary (W-2) income if you actively participate and your MAGI is under $100k (phasing out to $0 by $150k); unused losses carry forward. On sale, claimed depreciation is recaptured at up to 25%, and gains may owe capital-gains tax (a 1031 exchange can defer both). Figures are a year-1 estimate at your 24.0% rate — not tax advice; consult a CPA.
Schools (NCES district)
- District
- Milwaukee School District
- NCES district ID
- 5509600
- Math proficiency
- 10% ▼ -5.00%
- Reading proficiency
- 18% ▬ 0.00%
- Median HH income
- $36,339
- Composite
- 11.61/100
- National rank
- #9696
- State rank
- #337 of 342 in WI
Livability — Milwaukee
- Score
- 81/100
- State rank
- #55
- US rank
- #1534
Category grades
Schools grade is shown separately in the Schools card above.
Census & demographics
- Census place
- Milwaukee, WI
- County
- Milwaukee County · 926,379 people
- City population
- 573,768
- Metro
- Milwaukee-Waukesha, WI
- Population (ZIP)
- 19,887
- Household income
- $29,336
- Rent vs Own
- Severe rent burden
- 2061.0
Population outlook (Milwaukee County) Hauer SSP2
- Today (2025)
- 995,758 people
- By 2030
- 1,009,124 · +1.3%
- By 2040
- 1,028,128 · +3.3%
- By 2050
- 1,040,066 · +4.4%
- By 2075
- 1,057,849 · +6.2%
- By 2100
- 1,039,774 · +4.4%
Race, ethnicity, and origin ACS 2023
- Neighborhood character
- Predominantly Black (91%)
- Race & ethnicity
- Black 91% Two or more races 3% White 3% Hispanic / Latino 3%
- Common ancestry
- Norwegian 1%
- Foreign-born
- 1% · Canada
- Languages at home
- 97% English-only · Spanish 2%
Political lean MEDSL · Milwaukee
- 2024 margin
- Solid D (+38.5) · D 68.3% · R 29.8% · Other 1.8%
- 2008→2024 swing
- +2.7pp toward D · 2008: 35.9pp · 2024: 38.5pp
- All cycles
- 2024: D+38.5 2020: D+39.9 2016: D+37.5 2012: D+34.6 2008: D+35.9
Not yet ingested
- Civics
- —
Market trends
- HPI YoY
- ▲ 133.03%
- Current HPI
- 397.7151
- Rent YoY
- ▲ 8.28%
- Metro
- Milwaukee-Waukesha, WI
- State GDP YoY
- ▲ 2.10%
- F500 in state
- 20
Industry mix (Fortune 500 HQ in WI)
| Industry | F500 HQs | Revenue |
|---|---|---|
| Industrial Machinery | 4 | $23B |
|
||
| Industrial Technology | 2 | $36B |
|
||
| Insurance | 1 | $36B |
|
||
| Professional Services | 1 | $19B |
|
||
| Utilities | 1 | $9B |
|
||
| Consumer Goods | 1 | $3B |
|
||
Price history
+49.9% since first listed11 events — show timeline
- 2026-03-30 Price Changed $134,900 METROMLS
- 2026-03-23 Listed $149,900 METROMLS
- 2025-10-13 Sold (Public Records) $75,000 Public Records
- 2025-02-08 Listing Removed — METROMLS
- 2024-11-08 Listed $89,900 METROMLS
- 2021-10-01 Sold (Public Records) $20,000 Public Records
- 2016-07-20 Sold (MLS) $6,750 METROMLS
- 2016-06-09 Listed $9,000 METROMLS
- 2012-10-10 Listing Removed — METROMLS
- 2012-10-10 Listed $29,000 METROMLS
- 2007-11-23 Sold (Public Records) $90,000 Public Records
Property tax history
-3.7%/yrLatest (2024): $3,492 · -2.9% YoY. Source: county tax records.
Cash-flow waterfall
monthlySold comps — $/sqft
last 12 mo · ≤1 miLoading sold comps…