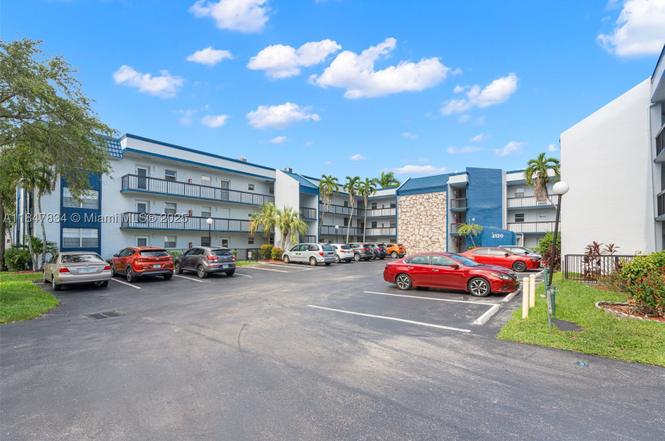
3120 Holiday Springs Blvd #301 · Margate, FL
Flood risk 1/10 · Minimal
- FEMA flood zone
- X (unshaded)
- Chance of flooding over 30 yrs
- 0.0%
- Est. flood insurance / yr
- $507 – $1,088
Fire risk 1/10 · Minimal
- Est. fire insurance / yr
- $947 – $1,759
Heat risk 9/10 · Severe
- Hot days now (above 106°F)
- 7 days/yr
- Hot days in 30 yrs
- 24 days/yr
Wind risk 10/10 · Severe
- Chance of severe wind over 30 yrs
- 99.0%
Air-quality risk 3/10 · Minor
- Unhealthy air days now
- 2 days/yr
- Unhealthy air days in 30 yrs
- 3 days/yr
Risk factors via First Street. Map © Google.
Why this score? — see what drove the C grade
The composite is a weighted blend of 9 inputs, each scored 0–100. Each bar is that input's sub-score; the figure is the points it added to the 100-point composite (weight × sub-score).
- Cash flow +21.1/30.0
- 1% rule +10.0/10.0
- ARV discount +7.5/15.0
- DSCR +6.7/10.0
- Schools +4.1/10.0
- Livability +4.0/5.0
- Rent growth +3.0/5.0
- Condition / age +2.5/5.0
- Appreciation +0.0/10.0
$95,000
🖨 Deal sheet 📄 Offer letter ✓ Due diligence
Listing remarks
ENJOY THE RESORT STYLE AMENETIES THAT HOLIDAY SPRING HAS TO OFFER, FROM ITS FANTASTIC RESORT STYLE POOL, EXERCISE ROOM, SAUNA, THEATER, TENNIS & PICKLEBALL. THIS 2/2 CORNER UNIT HAS IMPACT WINDOWS, TILE & LAMINATE WOOD FLOORING. THE KITCHEN IS LIGHT & BRIGHT WITH LIGHT WOOD CABINETRY WITH A BUILT IN WINE RACK. ENCLOSED FLORIDA ROOM ADDS MORE LIVING SPACE TO THE UNIT. EQUIPPED WITH A 2018 A/C & 2019 WATER HEATER. HOLIDAY SPRINGS IS AN HOPA (55+) COMMUNITY.
Key facts
- Theater
- Tennis
- Resort style pool
Tags
Property features AI
Finance
- Financial info: Pets not allowed
- HOA & community: Monthly association fee; Association fee covers amenities, cable TV, laundry, structure maintenance, parking, recreation facilities, reserve fund, sewer, trash, and water; Community amenities include clubhouse, fitness center, laundry, library, barbecue, picnic area, pickleball, pool, shuffleboard court, sauna, storage, tennis courts, trash service, and elevators; Senior community
Exterior
- Parking: Guest parking; One parking space
- Security: Smoke detector(s)
- Utilities: Cable available
- Home design: Condominium/townhouse (property is attached); 3-story building; Entry on level 3
- Construction: Block construction
- Exterior features: Heated pool; Faces west; Smoke detector(s)
Interior
- Kitchen: Dishwasher; Electric range; Disposal; Refrigerator
- Bedrooms: Bedroom located on the main level
- Flooring: Laminate; Tile
- Bathrooms: 2 full bathrooms
- Heating & cooling: Central heating (electric); Central air conditioning (electric)
- Interior features: Impact glass windows; Living/dining room; Walk-in closet(s); Bedroom on main level
- Laundry & utility: Common area laundry; Electric water heater
Neighborhood map
What this means for you Summary
Snapshot
- This is a 2-bed/2.0-bath condo listed at $95k.
Deal economics
- At list price, monthly cash flow is $136 ($2k/yr) — positive.
- The deal already cash-flows at list — no discount required.
- Meets the 1% rule at list price ($2k rent vs $95k).
- Recommended offer: $84k (12.0% below list) — sets the bar for market timing.
- Cap rate 8.0% vs local median 4.3% in Margate — top-decile yield for the area; either an underpriced asset or a hidden risk that comps aren't pricing in. Stress-test before assuming the spread holds.
Location & tenants
- Location reads 81/100 on livability (#85 in FL, #1,398 nationally) — a professional / high-income tenant draw. Strengths: commute A+, housing A+, health & safety A+; Watch: amenities F.
- Broward (suburban): math 42% / reading 53% proficiency, ranked #46 of 73 in FL (top 63%) — families likely to look elsewhere, expect single-tenant / working-renter base with shorter leases.
- Market conditions: Rents rising (+1.9%/yr); 548 active listings in the ZIP; 40 comparable units currently listed for rent nearby; rentals at typical pace (median 15d on market — plan ~3-4 weeks tenant-placement turnaround); 2,111 units permitted in Broward County in 2024 (1,265 in 5+ unit buildings).
- This rent runs 35% of the median local income ($63k/yr) — at the standard rent-burdened threshold; future hikes will face affordability resistance.
Forward outlook
- Local home prices are declining (-3.0%/yr); year-one equity from $657 of loan paydown is wiped out by about $3k of value loss. Plan a longer hold.
- Broward County population projected at +34% by 2050 — long-run rental-demand tailwind backs the buy-and-hold thesis.
Negotiation context
- It's been on market 326 days — a 12% lower offer ($84k) is reasonable based on typical stale-listing flexibility.
- Current owner paid $78k; 22% above their basis — modest negotiation headroom, anchor on the comps not their cost.
Risks & watch-outs
- Watch-outs: HOA is 40% of rent.
- Climate carrying-cost: severe wind risk, 99% chance of damaging wind over 30y; extreme-heat days projected 7→24/yr by 2055 (HVAC capex compounding) — expect insurance premiums to compound above CPI over the hold.
Questions for the listing agent
- It's been on market 326 days. Have you received any prior offers? Is the seller open to a 12% concession, seller financing, or rate buy-down credit?
- Built in 1974 — when were the roof, HVAC, electrical panel, plumbing, and water heater last replaced?
- What does the HOA fee cover, when was the last increase, and are there any pending special assessments or reserve-fund shortfalls?
- Any open or pending special assessments — roof, HVAC, plumbing, elevator, façade? What's the per-unit balance and payoff schedule, and is the seller paying it off at close or rolling it to the buyer?
- Why hasn't it sold? Are there any deal-killer items the seller is aware of (foundation, flood, title, zoning, code violations)?
- Is there a deadline driving the sale (1031 exchange, divorce, estate, relocation)? That informs how much negotiation room exists.
- What's the average days-on-market for RENTAL listings here right now (not sales)? A rising rental-DOM trend means longer vacancies and softer asking-rent achievability than the comps imply.
- What's the recent tenant-quality profile in this submarket — average credit score on applications, eviction rate, late-payment / NSF rate, and stable-employment percentage? A property-management company in the area should have these aggregated.
- How much new apartment / multifamily construction is in the pipeline within 1–3 miles? Heavy new supply (>2% of stock underway) typically softens rents 12–24 months out; light construction supports rent growth.
Investment metrics
- 1% rule
- 1.91% ✓
- Cap rate
- 8.01%
- Cash-on-cash
- 6.13%
- DSCR
- 1.27
- GRM
- 4.4
CMA / ARV
No comps found within radius.
Projected returns pro-forma
-3.0% appreciation · 1.94% rent growth · sell at horizon
- IRR
- -8.6%
- Equity multiple
- 0.69×
- Total profit
- $-8,237
- Equity at exit
- $14,165
- IRR
- -1.2%
- Equity multiple
- 0.92×
- Total profit
- $-2,010
- Equity at exit
- $8,214
Cash invested: $26,600 (down + closing). Projections, not guarantees.
Landlord ↔ Tenant lean methodology
- Overall (STATE)
- 87 Strongly Landlord-Friendly
- State Florida
- 87 Strongly Landlord-Friendly · R+3
- County
- — inherits STATE
- City
- — inherits STATE
ZIP-level market 33063
- Home prices YoY
- -18.1%
- Rents YoY
- 1.9%
- Active inventory
- 548
- Price-to-rent
- 4.4×
Monthly cashflow live
- Estimated rent
- $1,812 high interval (Pro) →
- Mortgage (P&I)
- −$498
- Tax from tax record
- −$25 /mo · $300/yr
- Insurance
- −$40
- HOA
- −$733
- Vacancy / Maint / Mgmt
- −$381
- Net cashflow
- $136
Break-even live
UW: 25.0% down · 7.5% · 30yr · 1.5% tax · 5.0% vac · 8.0% maint · 8.0% mgmt
Financing live
Cash to close
- Down payment
- $23,750
- Closing costs
- $2,850
- Reserves months
- —
- Total cash needed
- —
Loan-product check · same deal, 3 products live
Conventional
25% down · 7.5% · 30yr
- Down + closing
- —
- Monthly P&I
- —
- Monthly cashflow
- —
- DSCR
- —
- Eligible?
- —
Personal DTI + credit; lowest rate.
DSCR
20% down · 8.5% · 30yr
- Down + closing
- —
- Monthly P&I
- —
- Monthly cashflow
- —
- DSCR
- —
- Eligible?
- —
No personal income docs; deal must DSCR.
Hard money
10% down · 12.0% · 12mo
- Down + closing
- —
- Monthly P&I
- —
- Monthly cashflow
- —
- DSCR
- —
- Eligible?
- —
Short-term bridge; refi at stabilization.
Rent comps 40 comps
| Address | Beds | Baths | Sqft | Rent | $/sqft | DOM | Units | Dist |
|---|---|---|---|---|---|---|---|---|
| 3031 Holiday Springs Blvd Unit 1APT 201 Margate, FL | 1.0 | 1.5 | 750 | $1,525 | $2.03 | 15d | 1 | 0.09mi |
| 3031 Holiday Springs Blvd Margate, FL | 1.0 | 2.0 | 750 | $1,525 | $2.03 | 12d | 1 | 0.09mi |
| 2771 Riverside Dr Unit 416A Coral Springs, FL | 1.0 | 1.0 | 619 | $1,600 | $2.58 | 24d | 1 | 0.09mi |
| 2771 Riverside Dr Unit 316A Coral Springs, FL | 1.0 | 1.0 | 619 | $1,475 | $2.38 | 4d | 1 | 0.09mi |
| 2771 Riverside Dr Unit 316A Coral Springs, FL | 1.0 | 1.0 | 619 | $1,500 | $2.42 | 15d | 1 | 0.09mi |
| 2771 Riverside Dr Unit 405A Coral Springs, FL | 1.0 | 1.0 | 619 | $1,565 | $2.53 | 24d | 1 | 0.09mi |
| 2771 Riverside Dr Unit 405A Coral Springs, FL | 1.0 | 1.0 | 619 | $1,540 | $2.49 | 1d | 1 | 0.09mi |
| 2701 Riverside Dr Unit 316B Coral Springs, FL | 1.0 | 1.0 | 619 | $1,400 | $2.26 | 24d | 1 | 0.10mi |
| 2701 Riverside Dr Apt 516 Coral Springs, FL | 1.0 | 1.0 | 619 | $1,500 | $2.42 | 10d | 1 | 0.10mi |
| 2671 Riverside Dr #6 Coral Springs, FL | 2.0 | 1.0 | 800 | $1,725 | $2.16 | 22d | 1 | 0.14mi |
| 2710 Riverside Dr Unit 102A Coral Springs, FL | 1.0 | 1.5 | 795 | $1,650 | $2.08 | 24d | 1 | 0.18mi |
| 2598 Riverside Dr Unit 2598 Coral Springs, FL | 2.0 | 2.0 | 820 | $1,600 | $1.95 | 24d | 1 | 0.21mi |
| 2501 Riverside Dr Unit 206A Coral Springs, FL | 1.0 | 1.0 | 606 | $1,500 | $2.48 | 18d | 1 | 0.21mi |
| 2947 Riverside Dr #129 Coral Springs, FL | 1.0 | 1.0 | 620 | $1,650 | $2.66 | 10d | 1 | 0.22mi |
| 3300 Pinewalk Dr N Margate, FL | 1.0–2.0 | 1.0–2.0 | 869 | $1,985 | $2.28 | 22d | 2 | 0.22mi |
| 3310 Pinewalk Dr N #1812 Margate, FL | 2.0 | 2.0 | 963 | $1,875 | $1.95 | 16d | 1 | 0.25mi |
| 2401 Riverside Dr Unit 217B Coral Springs, FL | 1.0 | 1.0 | 606 | $1,450 | $2.39 | 22d | 1 | 0.28mi |
| 2733 Forest Hills Blvd Coral Springs, FL | 1.0–2.0 | 1.0–2.0 | 1009 | $2,265 | $2.24 | 1d | 6 | 0.28mi |
| 3330 Pinewalk Dr N #1623 Margate, FL | 1.0 | 1.0 | 712 | $1,700 | $2.39 | 5d | 1 | 0.31mi |
| 3330 Pinewalk Dr N #1623 Margate, FL | 1.0 | 1.0 | 712 | $1,750 | $2.46 | 11d | 1 | 0.31mi |
| 2980 Riverside Dr #228 Coral Springs, FL | 1.0 | 1.5 | 1060 | $1,525 | $1.44 | 24d | 1 | 0.32mi |
| 3350 Pinewalk Dr N Margate, FL | 1.0–2.0 | 1.0–2.0 | 837 | $2,050 | $2.45 | 7d | 3 | 0.36mi |
| 3350 Pinewalk Dr N #1413 Margate, FL | 1.0 | 1.0 | 712 | $1,750 | $2.46 | 10d | 1 | 0.36mi |
| 3340 Pinewalk Dr N #1518 Margate, FL | 2.0 | 2.0 | 1027 | $2,000 | $1.95 | 24d | 1 | 0.38mi |
| 8409 Forest Hills Dr #204 Coral Springs, FL | 2.0 | 2.0 | 1068 | $2,000 | $1.87 | 7d | 1 | 0.39mi |
| 8429 Forest Hills Dr Coral Springs, FL | 2.0 | 2.0 | 1061 | $2,050 | $1.93 | 24d | 2 | 0.43mi |
| 8429 Forest Hills Dr Unit 111 Coral Springs, FL | 2.0 | 2.0 | 1068 | $2,000 | $1.87 | 24d | 1 | 0.43mi |
| 8393 Royal Palm Blvd #102 Coral Springs, FL | 3.0 | 2.0 | 1100 | $2,350 | $2.14 | 3d | 1 | 0.44mi |
| 3380 Pinewalk Dr N #1113 Margate, FL | 2.0 | 1.0 | 912 | $1,850 | $2.03 | 24d | 1 | 0.45mi |
| 3380 Pinewalk Dr N #1113 Margate, FL | 2.0 | 1.0 | 912 | $1,850 | $2.03 | 7d | 1 | 0.45mi |
| 8429 Forest Hills Dr #305 Coral Springs, FL | 2.0 | 2.0 | 1068 | $2,100 | $1.97 | 7d | 1 | 0.47mi |
| 8443 Royal Palm Blvd #8443 Coral Springs, FL | 3.0 | 2.0 | 1073 | $2,500 | $2.33 | 4d | 1 | 0.49mi |
| 8443 Royal Palm Blvd #8443 Coral Springs, FL | 3.0 | 2.0 | 1073 | $2,500 | $2.33 | 3d | 1 | 0.49mi |
| 3390 Pinewalk Dr N #1016 Margate, FL | 1.0 | 1.0 | 712 | $1,750 | $2.46 | 3d | 1 | 0.49mi |
| 3187 Coral Lake Dr Unit 3187 Coral Springs, FL | 2.0 | 2.0 | 910 | $1,900 | $2.09 | 7d | 1 | 0.51mi |
| 8441 Forest Hills Dr #202 Coral Springs, FL | 2.0 | 2.0 | 1068 | $2,000 | $1.87 | 24d | 1 | 0.52mi |
| 3226 Coral Lake Ln Unit 3226 Coral Springs, FL | 2.0 | 2.0 | 910 | $2,100 | $2.31 | 3d | 1 | 0.53mi |
| 3226 Coral Lake Ln Unit 3226 Coral Springs, FL | 2.0 | 2.0 | 910 | $2,175 | $2.39 | 10d | 1 | 0.53mi |
| 3222 Coral Lake Ln Coral Springs, FL | 2.0 | 2.0 | 910 | $2,100 | $2.31 | 24d | 1 | 0.53mi |
| 3204 Coral Lake Ln Coral Springs, FL | 1.0 | 1.0 | 720 | $1,750 | $2.43 | 24d | 1 | 0.53mi |
HOA detail condo
- Monthly dues
- $733 · $8,796/yr
- Likely covers
- waterpool
- Assessments
- None detected in remarks — confirm with the listing agent.
Listing history 17 events
-
2026-06-18days on market $95,000 Active 326 DOM
-
2026-06-17days on market $95,000 Active 325 DOM
-
2026-06-16days on market $95,000 Active 324 DOM
-
2026-06-15days on market $95,000 Active 323 DOM
-
2026-06-13days on market $95,000 Active 321 DOM
-
2026-06-09days on market $95,000 Active 317 DOM
-
2026-06-07days on market $95,000 Active 315 DOM
-
2026-06-04days on market $95,000 Active 312 DOM
-
2026-06-03days on market $95,000 Active 311 DOM
-
2026-06-02days on market $95,000 Active 310 DOM
-
2026-06-01days on market $95,000 Active 309 DOM
-
2026-05-31days on market $95,000 Active 308 DOM
-
2025-10-14price $95,000
-
2025-07-27$107,000 Active
-
2005-01-20soldstatus $78,000
-
1992-12-08soldstatus $40,000
-
1977-02-01soldstatus $27,000
ⓘ Source: listings_history table (triggers on properties + properties_extension) + one-shot
backfill from property_details.listing_events for pre-trigger history.
Tax reassessment forecast FL · Resets to sale price
- Current annual tax
- $300 · $25/mo
- Projected year-2 tax
- $788 · $66/mo
- Expected delta
- +$488/yr (+$41/mo · 162.8%)
ⓘ Screening estimate from a state-policy table — verify with the county assessor before closing.
Climate risk First Street
- Flood 1/10 Low FEMA zone X (unshaded) · 0% chance over 30 yrs
- Wildfire 1/10 Low
- Heat 9/10 Extreme 7 d/yr ≥106°F today · 24 d/yr by 30 yrs out
- Wind 10/10 Extreme 99% chance of damaging wind over 30 yrs
- Air quality 3/10 Moderate 2 unhealthy d/yr today · 3 by 30 yrs out
Nearby sold comps map
Loading sold comps map…
Walkable amenities ~0.75 mi
Loading nearby amenities…
Taxation est. · year 1
- Rental income
- $21,746
- − Mortgage interest
- −$5,321
- − Property taxes
- −$300
- − Insurance
- −$475
- − Repairs & maintenance
- −$1,740
- − Management
- −$1,740
- − HOA
- −$8,796
- − Depreciation
- −$2,764
- Taxable income
- $610
- Est. tax owed @ 24.0%
- −$146
- After-tax cash flow
- $1,483/yr
For passive investors: Depreciation is non-cash, so a rental often shows a tax loss while cash-flowing — sheltering income. Rental losses are passive: they offset passive income freely, and up to $25,000/yr can offset ordinary (W-2) income if you actively participate and your MAGI is under $100k (phasing out to $0 by $150k); unused losses carry forward. On sale, claimed depreciation is recaptured at up to 25%, and gains may owe capital-gains tax (a 1031 exchange can defer both). Figures are a year-1 estimate at your 24.0% rate — not tax advice; consult a CPA.
Schools (NCES district)
- District
- Broward
- NCES district ID
- 1200180
- Math proficiency
- 42% ▼ -18.00%
- Reading proficiency
- 53% ▼ -5.00%
- Median HH income
- $52,139
- Composite
- 40.88/100
- National rank
- #3621
- State rank
- #46 of 73 in FL
Livability — Margate
- Score
- 81/100
- State rank
- #85
- US rank
- #1398
Category grades
Schools grade is shown separately in the Schools card above.
Census & demographics
- Census place
- Margate, FL
- County
- Broward County · 1,963,430 people
- City population
- 55,466
- Metro
- Miami-Fort Lauderdale-Pompano Beach, FL
- Population (ZIP)
- 55,466
- Household income
- $62,918
- Rent vs Own
- Severe rent burden
- 2290.0
Population outlook (Broward County) Hauer SSP2
- Today (2025)
- 2,207,033 people
- By 2030
- 2,360,704 · +7.0%
- By 2040
- 2,661,208 · +20.6%
- By 2050
- 2,946,698 · +33.5%
- By 2075
- 3,602,273 · +63.2%
- By 2100
- 3,970,984 · +79.9%
Race, ethnicity, and origin ACS 2023
- Neighborhood character
- Highly diverse neighborhood (Simpson 0.72)
- Race & ethnicity
- White 34% Hispanic / Latino 29% Black 28% Two or more races 18% Asian 4%
- Hispanic origin (detail)
- Mexican 2% Puerto Rican 7% Cuban 3% Dominican 3%
- Common ancestry
- Hispanic 6% Romanian 2% Estonian 2%
- Foreign-born
- 36% · Canada, Jamaica, Vietnam
- Languages at home
- 61% English-only · Spanish 24% French/Haitian/Cajun 7% Other Indo-European 4%
Political lean MEDSL · Broward
- 2024 margin
- D (+17.0) · D 58.0% · R 41.0%
- 2008→2024 swing
- -17.8pp toward R · 2008: 34.7pp · 2024: 17.0pp
- All cycles
- 2024: D+17.0 2020: D+29.8 2016: D+35.0 2012: D+34.9 2008: D+34.7
Not yet ingested
- Civics
- —
Market trends
- HPI YoY
- ▼ -87.17%
- Current HPI
- 393.9225
- Rent YoY
- ▲ 1.94%
- Metro
- Miami-Fort Lauderdale-Pompano Beach, FL
- State GDP YoY
- ▲ 3.28%
- F500 in state
- 36
Industry mix (Fortune 500 HQ in FL)
| Industry | F500 HQs | Revenue |
|---|---|---|
| Industrial Technology | 2 | $29B |
|
||
| Insurance | 2 | $17B |
|
||
| Retail | 1 | $60B |
|
||
| Technology Distribution | 1 | $58B |
|
||
| Homebuilding | 1 | $35B |
|
||
| Technology Manufacturing | 1 | $35B |
|
||
Price history
+251.9% since first listed5 events — show timeline
- 2025-10-14 Price Changed $95,000 MARMLS
- 2025-07-27 Listed $107,000 MARMLS
- 2005-01-20 Sold (Public Records) $78,000 Public Records
- 1992-12-08 Sold (Public Records) $40,000 Public Records
- 1977-02-01 Sold (Public Records) $27,000 Public Records
Property tax history
+2.1%/yrLatest (2025): $300 · +0.0% YoY. Source: county tax records.
Cash-flow waterfall
monthlySold comps — $/sqft
last 12 mo · ≤1 miLoading sold comps…