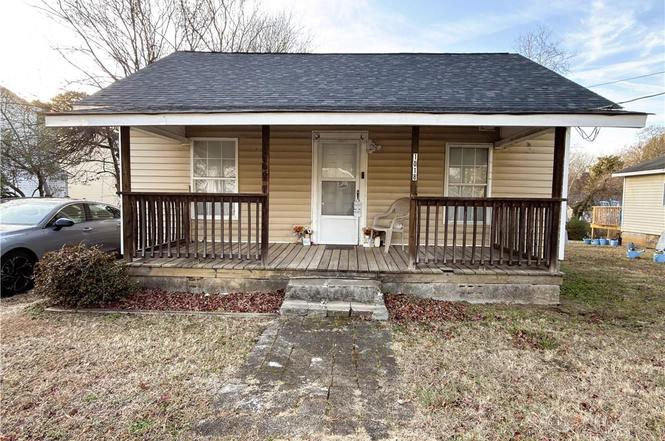
1018 Cranbrook St · Greensboro, NC
Flood risk 1/10 · Minimal
- FEMA flood zone
- X (unshaded)
- Chance of flooding over 30 yrs
- 0.0%
- Est. flood insurance / yr
- $507 – $1,088
Fire risk 1/10 · Minimal
- Est. fire insurance / yr
- $906 – $1,684
Heat risk 5/10 · Moderate
- Hot days now (above 103°F)
- 7 days/yr
- Hot days in 30 yrs
- 17 days/yr
Wind risk 4/10 · Minor
- Chance of severe wind over 30 yrs
- 15.0%
Air-quality risk 2/10 · Minimal
- Unhealthy air days now
- 1 days/yr
- Unhealthy air days in 30 yrs
- 1 days/yr
Risk factors via First Street. Map © Google.
Why this score? — see what drove the D grade
The composite is a weighted blend of 9 inputs, each scored 0–100. Each bar is that input's sub-score; the figure is the points it added to the 100-point composite (weight × sub-score).
- Cash flow +15.2/30.0
- ARV discount +6.7/15.0
- DSCR +4.7/10.0
- Livability +4.0/5.0
- Schools +3.6/10.0
- Rent growth +3.4/5.0
- 1% rule +3.1/10.0
- Condition / age +2.5/5.0
- Appreciation +0.0/10.0
$137,500
🖨 Deal sheet (PDF) 📄 Offer letter ✓ Due diligence
Listing remarks
HUGE PRICE ADJUSTMENT, MOTIVATED SELLERS PLEASE BRING ALL OFFERS!!! Charming bungalow with long-term tenants eager to stay. Featuring newer appliances, new roof, some fresh paint, this property is well cared for. Located in a prime spot close to major highways, shopping, and dining, it’s a great addition to any rental portfolio. This property can be combined with MLS #1209375 for a package deal, please contact agent for more details. See agent-only remarks for entry instructions.
Key facts
- Prime spot
- Fresh paint
- Newer appliances
Tags
Property features AI
Finance
- Other: Located on a public maintained road
- HOA & community: Part of the High Point association; Subdivision: Pomona Village
Exterior
- Parking: Driveway
- Utilities: Public water; Public sewer; Electric water heater
- Home design: Residential stick/site-built house; One level; Built in 1927; Existing structure
- Construction: Vinyl siding exterior
- Exterior features: Cleared lot; Lot dimensions approximately 60 x 145 x 60 x 145
Interior
- Kitchen: Electric water heater
- Bedrooms: Total of 4 rooms (includes bedrooms and living spaces)
- Bathrooms: 1 full bathroom
- Heating & cooling: Central air conditioning; Forced air heating with natural gas fuel
- Interior features: Primary bedroom located on the main level
Neighborhood map
What this means for you Summary
Snapshot
- This is a 2-bed/1.0-bath single-family listed at $138k.
Deal economics
- At list price, monthly cash flow is $48 ($573/yr) — positive.
- The deal already cash-flows at list — no discount required.
- To meet the 1% rule (rent ≥ 1% of price), the offer needs to be $112k (18.6% below list).
- Recommended offer: $112k (18.6% below list) — sets the bar for 1% rule.
- Cap rate 6.7% vs local median 3.7% in Greensboro — top-decile yield for the area; either an underpriced asset or a hidden risk that comps aren't pricing in. Stress-test before assuming the spread holds.
Location & tenants
- Location reads 81/100 on livability (#12 in NC, #1,335 nationally) — a professional / high-income tenant draw. Strengths: amenities A+, commute A+, cost of living A+; Watch: employment D, crime F.
- Guilford County Schools (urban): math 39% / reading 45% proficiency, ranked #99 of 178 in NC (top 56%) — families likely to look elsewhere, expect single-tenant / working-renter base with shorter leases.
- Zoned schools: Hunter Elementary (math 31% / reading 29%, grade F, #965 of 1,410 statewide, top 69%, 522 students, 99% FRL); Jackson Middle (math 12% / reading 28%, grade F, #429 of 475 statewide, top 91%, 402 students, 99% FRL); Ben L. Smith High School (math 32% / reading 36%, grade F, #434 of 535 statewide, top 81%, 1,371 students, 100% FRL) — zoned schools average 100% FRL vs 52% district-wide (47 pts higher); higher-poverty schools than district average — tighter screening recommended.
- Zoned-school proficiency averages 28% at this address vs 42% district-wide (-14 pts) — the specific schools serving this property underperform the Guilford County Schools average; the district grade overstates school quality for this exact location.
- Market conditions: Rents rising (+3.5%/yr); 223 active listings in the ZIP; 10 comparable units currently listed for rent nearby; rentals at typical pace (median 25d on market — plan ~3-4 weeks tenant-placement turnaround); 3,843 units permitted in Guilford County in 2024 (2,397 in 5+ unit buildings).
Forward outlook
- Local home prices are declining (-3.0%/yr); year-one equity from $951 of loan paydown is wiped out by about $4k of value loss. Plan a longer hold.
- Guilford County population projected at +26% by 2050 — long-run rental-demand tailwind backs the buy-and-hold thesis.
Negotiation context
- It's been on market 118 days — a 9% lower offer ($125k) is reasonable based on typical stale-listing flexibility.
Risks & watch-outs
- Watch-outs: built in 1927 — expect roof / HVAC / electrical / plumbing capex.
- Climate carrying-cost: extreme-heat days projected 7→17/yr by 2055 (HVAC capex compounding) — expect insurance premiums to compound above CPI over the hold.
Questions for the listing agent
- It's been on market 118 days. Have you received any prior offers? Is the seller open to a 19% concession, seller financing, or rate buy-down credit?
- Built in 1927 — when were the roof, HVAC, electrical panel, plumbing, and water heater last replaced?
- Why hasn't it sold? Are there any deal-killer items the seller is aware of (foundation, flood, title, zoning, code violations)?
- Is there a deadline driving the sale (1031 exchange, divorce, estate, relocation)? That informs how much negotiation room exists.
- Crime grade is F in this area — have there been break-ins, vandalism, or insurance claims at this property in the last 3 years? What carrier currently insures it and at what premium?
- The area grade is low — what's the realistic commute time and amenity access for the typical tenant pool here? Any planned neighborhood developments (good or bad) we should know about?
- What's the average days-on-market for RENTAL listings here right now (not sales)? A rising rental-DOM trend means longer vacancies and softer asking-rent achievability than the comps imply.
- What's the recent tenant-quality profile in this submarket — average credit score on applications, eviction rate, late-payment / NSF rate, and stable-employment percentage? A property-management company in the area should have these aggregated.
- How much new for-sale + rental construction is in the pipeline within 1–3 miles? Heavy new supply typically softens prices + rents 12–24 months out; constrained supply supports both.
Investment metrics
- 1% rule
- 0.81% ✗
- Cap rate
- 6.71%
- Cash-on-cash
- 1.49%
- DSCR
- 1.07
- GRM
- 10.2
CMA / ARV
- ARV (on-the-fly)
- $135,240
- Comps found
- 8
Show comp detail 8 sales within ~0.75 mi
| Address | Dist | Beds/Ba | Sqft | Sold | Price | $/sf | Match |
|---|---|---|---|---|---|---|---|
| 3800 Causey St | 0.07mi | 2/1.0 | 782 (+6%) | 18mo | $144,000 | $184 | 71 |
| 1010 Cranbrook St | 0.04mi | 2/1.0 | 837 (+14%) | 13mo | $110,000 | $131 | 64 |
| 3405 Immanuel Rd | 0.53mi | 2/1.0 | 800 (+9%) | 4mo | $163,000 | $204 | 57 |
| 4213 Harvard Ave | 0.72mi | 2/1.0 | 775 (+5%) | 8mo | $179,900 | $232 | 50 |
| 603 Merritt Dr | 0.47mi | 2/1.0 | 824 (+12%) | 12mo | $132,000 | $160 | 48 |
| 1303 Larson St | 0.57mi | 2/1.0 | 789 (+7%) | 23mo | $135,000 | $171 | 42 |
| 1822 Halcyon St | 0.59mi | 2/1.0 | 797 (+8%) | 21mo | $115,000 | $144 | 40 |
| 4323 Harvard Ave | 0.75mi | 2/1.0 | 819 (+11%) | 19mo | $188,000 | $230 | 30 |
Match score weights: distance 35% · size 25% · config 20% · recency 20%. Top-matched comps best support the ARV.
Projected returns pro-forma
-3.0% appreciation · 3.5% rent growth · sell at horizon
- IRR
- -13.5%
- Equity multiple
- 0.51×
- Total profit
- $-18,727
- Equity at exit
- $20,502
- IRR
- -3.9%
- Equity multiple
- 0.73×
- Total profit
- $-10,259
- Equity at exit
- $11,888
Cash invested: $38,500 (down + closing). Projections, not guarantees.
Landlord ↔ Tenant lean methodology
- Overall (STATE)
- 85 Strongly Landlord-Friendly
- State North Carolina
- 85 Strongly Landlord-Friendly · R+3
- County
- — inherits STATE
- City
- — inherits STATE
ZIP-level market 27407
- Rents YoY
- 3.5%
- Active inventory
- 223
- Price-to-rent
- 10.2×
Monthly cashflow live
- Estimated rent
- $1,120 high interval (Pro) →
- Mortgage (P&I)
- −$721
- Tax from tax record
- −$59 /mo · $703/yr
- Insurance
- −$57
- HOA
- −$0
- Vacancy / Maint / Mgmt
- −$235
- Net cashflow
- $48
Break-even live
Sensitivity live
| Price | -10% $126 | -5% $87 | +0% $48 | +5% $9 | +10% $-30 |
|---|---|---|---|---|---|
| Rent | -10% $-41 | -5% $4 | +0% $48 | +5% $92 | +10% $136 |
| Rate | -1.0pp $117 | -0.5pp $83 | base $48 | +0.5pp $12 | +1.0pp $-24 |
UW: 25.0% down · 7.5% · 30yr · 1.5% tax · 5.0% vac · 8.0% maint · 8.0% mgmt
Financing live
Cash to close
- Down payment
- $34,375
- Closing costs
- $4,125
- Reserves months
- —
- Total cash needed
- —
Loan-product check · same deal, 3 products live
Conventional
25% down · 7.5% · 30yr
- Down + closing
- —
- Monthly P&I
- —
- Monthly cashflow
- —
- DSCR
- —
- Eligible?
- —
Personal DTI + credit; lowest rate.
DSCR
20% down · 8.5% · 30yr
- Down + closing
- —
- Monthly P&I
- —
- Monthly cashflow
- —
- DSCR
- —
- Eligible?
- —
No personal income docs; deal must DSCR.
Hard money
10% down · 12.0% · 12mo
- Down + closing
- —
- Monthly P&I
- —
- Monthly cashflow
- —
- DSCR
- —
- Eligible?
- —
Short-term bridge; refi at stabilization.
Rent comps 10 comps
| Address | Beds | Baths | Sqft | Rent | $/sqft | DOM | Units | Dist |
|---|---|---|---|---|---|---|---|---|
| 1007 Pineland St Greensboro, NC | 1.0–3.0 | 1.0 | 900 | $1,062 | $1.18 | 16d | 5 | 0.26mi |
| 4203-21 Hewitt St Greensboro, NC | 1.0–2.0 | 1.0–2.0 | 830 | $1,165 | $1.40 | 16d | 20 | 0.44mi |
| 3940 Overland Hts Greensboro, NC | 2.0 | 1.0 | 600 | $950 | $1.58 | 25d | 1 | 0.75mi |
| 3900 Overland Hts Greensboro, NC | 2.0 | 1.0 | 738 | $1,025 | $1.39 | 16d | 13 | 0.81mi |
| 1918 Peale Ter Unit D Greensboro, NC | 1.0 | 1.0 | 575 | $850 | $1.48 | 16d | 1 | 0.99mi |
| 1606 Pinecroft Rd Greensboro, NC | 1.0–3.0 | 1.0 | 765 | $1,088 | $1.42 | 25d | 1 | 1.03mi |
| 2002 Cedar Fork Dr Greensboro, NC | 1.0–2.0 | 1.0–2.0 | 742 | $1,300 | $1.75 | 25d | 1 | 1.03mi |
| 2904 W Florida St Greensboro, NC | 1.0–2.0 | 1.0–1.5 | 746 | $1,095 | $1.47 | 23d | 3 | 1.09mi |
| 3755 Oakwood Dr Greensboro, NC | 2.0 | 1.0–1.5 | 850 | $888 | $1.04 | 25d | 2 | 1.30mi |
| 2529 Spring Garden St Unit A1 Greensboro, NC | 1.0 | 1.0 | 600 | $950 | $1.58 | 25d | 1 | 1.41mi |
Listing history 14 events
-
2026-06-16status $137,500 Pending 118 DOM
-
2026-06-15days on market $137,500 Due Diligence Period 118 DOM
-
2026-06-14days on market $137,500 Due Diligence Period 116 DOM
-
2026-06-10days on market $137,500 Due Diligence Period 113 DOM
-
2026-06-09days on market $137,500 Due Diligence Period 112 DOM
-
2026-06-08days on market $137,500 Due Diligence Period 111 DOM
-
2026-06-07days on market $137,500 Due Diligence Period 110 DOM
-
2026-06-03statusdays on market $137,500 Due Diligence Period 106 DOM
-
2026-06-02days on market $137,500 Active 105 DOM
-
2026-06-01days on market $137,500 Active 104 DOM
-
2026-05-31days on market $137,500 Active 103 DOM
-
2026-05-31days on market $137,500 Active 102 DOM
-
2026-05-01price $145,000
-
2026-02-17$165,000 Active
ⓘ Source: listings_history table (triggers on properties + properties_extension) + one-shot
backfill from property_details.listing_events for pre-trigger history.
Tax reassessment forecast NC · Resets to sale price
- Current annual tax
- $703 · $59/mo
- Projected year-2 tax
- $1,128 · $94/mo
- Expected delta
- +$425/yr (+$35/mo · 60.4%)
ⓘ Screening estimate from a state-policy table — verify with the county assessor before closing.
Climate risk First Street
- Flood 1/10 Low FEMA zone X (unshaded) · 0% chance over 30 yrs
- Wildfire 1/10 Low
- Heat 5/10 Major 7 d/yr ≥103°F today · 17 d/yr by 30 yrs out
- Wind 4/10 Moderate 15% chance of damaging wind over 30 yrs
- Air quality 2/10 Low 1 unhealthy d/yr today · 1 by 30 yrs out
Nearby sold comps map
Loading sold comps map…
Walkable amenities ~0.75 mi
Loading nearby amenities…
Taxation est. · year 1
- Rental income
- $13,438
- − Mortgage interest
- −$7,702
- − Property taxes
- −$703
- − Insurance
- −$688
- − Repairs & maintenance
- −$1,075
- − Management
- −$1,075
- − Depreciation
- −$4,000
- Taxable loss
- −$1,805
- Est. tax savings @ 24.0%
- +$433
- After-tax cash flow
- $1,006/yr
For passive investors: Depreciation is non-cash, so a rental often shows a tax loss while cash-flowing — sheltering income. Rental losses are passive: they offset passive income freely, and up to $25,000/yr can offset ordinary (W-2) income if you actively participate and your MAGI is under $100k (phasing out to $0 by $150k); unused losses carry forward. On sale, claimed depreciation is recaptured at up to 25%, and gains may owe capital-gains tax (a 1031 exchange can defer both). Figures are a year-1 estimate at your 24.0% rate — not tax advice; consult a CPA.
Schools (NCES district)
- District
- Guilford County Schools
- NCES district ID
- 3701920
- Math proficiency
- 39% ▲ 1.00%
- Reading proficiency
- 45% ▲ 1.00%
- Median HH income
- $46,315
- Composite
- 35.78/100
- National rank
- #4842
- State rank
- #99 of 178 in NC
Livability — Greensboro
- Score
- 81/100
- State rank
- #12
- US rank
- #1335
Category grades
Schools grade is shown separately in the Schools card above.
Census & demographics
- Census place
- Greensboro, NC
- County
- Guilford County · 487,190 people
- City population
- 329,421
- Metro
- Greensboro-High Point, NC
- Population (ZIP)
- 51,697
- Household income
- $59,427
- Rent vs Own
- Severe rent burden
- 2360.0
Population outlook (Guilford County) Hauer SSP2
- Today (2025)
- 584,596 people
- By 2030
- 616,851 · +5.5%
- By 2040
- 678,451 · +16.1%
- By 2050
- 734,788 · +25.7%
- By 2075
- 862,985 · +47.6%
- By 2100
- 948,704 · +62.3%
Race, ethnicity, and origin ACS 2023
- Neighborhood character
- Diverse neighborhood (Simpson 0.70)
- Race & ethnicity
- Black 42% White 32% Asian 11% Hispanic / Latino 11% Two or more races 7% Native American 1%
- Hispanic origin (detail)
- Mexican 6%
- Common ancestry
- Ukrainian 2% Slovak 1% Serbian 1%
- Foreign-born
- 20% · Canada, Vietnam, China
- Languages at home
- 73% English-only · Spanish 9% Arabic 4% Vietnamese 4%
Political lean MEDSL · Guilford
- 2024 margin
- Strong D (+21.8) · D 60.2% · R 38.4% · Other 1.4%
- 2008→2024 swing
- +3.5pp toward D · 2008: 18.4pp · 2024: 21.8pp
- All cycles
- 2024: D+21.8 2020: D+23.1 2016: D+20.0 2012: D+16.5 2008: D+18.4
Not yet ingested
- Civics
- —
Market trends
- HPI YoY
- ▼ -138.48%
- Current HPI
- 223.3145
- Rent YoY
- ▲ 3.50%
- Metro
- Greensboro-High Point, NC
- State GDP YoY
- ▲ 3.28%
- F500 in state
- 26
Industry mix (Fortune 500 HQ in NC)
| Industry | F500 HQs | Revenue |
|---|---|---|
| Financial Services | 2 | $213B |
|
||
| Retail | 2 | $95B |
|
||
| Industrial Conglomerate | 1 | $38B |
|
||
| Metals / Steel | 1 | $35B |
|
||
| Utilities | 1 | $30B |
|
||
| Industrial Machinery | 1 | $19B |
|
||
Price history
-12.1% since first listed2 events — show timeline
- 2026-05-01 Price Changed $145,000 Triad MLS
- 2026-02-17 Listed $165,000 Triad MLS
Property tax history
+2.3%/yrLatest (2025): $703 · -1.0% YoY. Source: county tax records.
Cash-flow waterfall
monthlySold comps — $/sqft
last 12 mo · ≤1 miLoading sold comps…