3100 Cresthill Ave · Anniston, AL
Flood risk 1/10 · Minimal
- FEMA flood zone
- X (unshaded)
- Chance of flooding over 30 yrs
- 0.0%
- Est. flood insurance / yr
- $507 – $1,088
Fire risk 4/10 · Minor
- Est. fire insurance / yr
- $916 – $1,700
Heat risk 6/10 · Moderate
- Hot days now (above 105°F)
- 7 days/yr
- Hot days in 30 yrs
- 21 days/yr
Wind risk 6/10 · Moderate
- Chance of severe wind over 30 yrs
- 27.0%
Air-quality risk 2/10 · Minimal
- Unhealthy air days now
- 1 days/yr
- Unhealthy air days in 30 yrs
- 1 days/yr
Risk factors via First Street. Map © Google.
Why this score? — see what drove the C+ grade
The composite is a weighted blend of 9 inputs, each scored 0–100. Each bar is that input's sub-score; the figure is the points it added to the 100-point composite (weight × sub-score).
- Cash flow +30.0/30.0
- DSCR +10.0/10.0
- 1% rule +9.3/10.0
- ARV discount +4.1/15.0
- Livability +2.9/5.0
- Rent growth +2.5/5.0
- Condition / age +2.5/5.0
- Schools +0.5/10.0
- Appreciation +0.0/10.0
$79,000
🖨 Deal sheet 📄 Offer letter ✓ Due diligence
Listing remarks
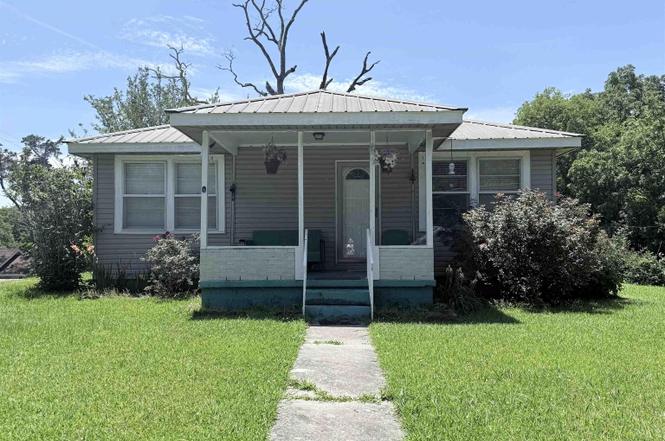
Charming 2 bedroom, 1 full bath home situated on a corner lot with plenty of space inside and out. This home features a living room as well as a flex space for additional family room or home office. Enjoy the covered front porch, spacious yard, and detached workshop/garage perfect for storage or projects. A great opportunity for first time home buyers, downsizers, or investors! Call today for your personal showing, this one will not be on the market long.
Key facts
- Covered front porch
- Spacious yard
- Flex space
Tags
Property features AI
Finance
- Other: Garbage fee applies
- Financial info: Quarterly garbage fee
Exterior
- Parking: Driveway parking; 2-space carport
- Utilities: Public water; Connected sewer; Internet service available; Electric water heater
- Home design: Existing construction; Vinyl siding; Crawl space foundation
- Construction: Vinyl siding construction
- Exterior features: Corner lot; Open deck; Porch; Workshop
Interior
- Kitchen: Laminate countertops; Gas stove
- Bedrooms: Two bedrooms on the main level
- Flooring: Hardwood laminate; Vinyl
- Bathrooms: One full bathroom with a separate shower
- Heating & cooling: Central heating (gas); Central air conditioning; Ceiling fans
- Interior features: Smooth ceilings; Eating area; Attic present; Workshop; Porch
- Laundry & utility: Main-level laundry room; Washer hookup; Electric dryer hookup; Electric water heater
Neighborhood map
What this means for you Summary
Snapshot
- This is a 2-bed/1.0-bath single-family listed at $79k.
Deal economics
- At list price, monthly cash flow is $426 ($5k/yr) — positive.
- The deal already cash-flows at list — no discount required.
- Meets the 1% rule at list price ($1k rent vs $79k).
- Cap rate 12.8% vs local median 5.1% in Anniston — top-decile yield for the area; either an underpriced asset or a hidden risk that comps aren't pricing in. Stress-test before assuming the spread holds.
Location & tenants
- Location reads 58/100 on livability (#348 in AL) — a working-class tenant base; expect higher turnover. Strengths: cost of living A+, housing A+, health & safety A+; Watch: crime F, amenities F, commute F.
- Anniston City (urban): math 2% / reading 12% proficiency, ranked #128 of 129 in AL (top 99%) — low school quality limits family demand, transient renter base, plan for 1-2y turnover; 87% free/reduced lunch — lower-income household profile, screen leases tightly.
- Zoned schools: Randolph Park Elementary School (math 2% / reading 22%, grade F, #536 of 627 statewide, top 88%, 337 students, 95% FRL); Anniston High School (math 2% / reading 12%, grade F, #265 of 305 statewide, top 89%, 466 students, 86% FRL) — zoned schools at 91% FRL track the district average.
- Market conditions: 73 active listings in the ZIP; 5 comparable units currently listed for rent nearby; rentals lingering (median 44d on market — plan ~5-8 weeks vacancy on turnover, expect pricing pressure); 100% of comp listings sitting > 30 days — soft ceiling on asking rent; 135 units permitted in Calhoun County in 2024 (0 in 5+ unit buildings).
Forward outlook
- Local home prices are declining (-3.0%/yr); year-one equity from $546 of loan paydown is wiped out by about $2k of value loss. Plan a longer hold.
- Calhoun County population projected at -21% by 2050 — secular population decline; favor cash flow + early exit over multi-decade hold.
- At projected returns (-3.0% appreciation + 3.0% rent growth), your $22k cash investment doubles in ~6 years — after that, you're playing with house money.
Negotiation context
- Only 3 days on market — expect competitive offers; lowballing is unlikely to land.
Risks & watch-outs
- Watch-outs: built in 1952 — expect roof / HVAC / electrical / plumbing capex.
- Climate carrying-cost: major wind risk, 27% chance of damaging wind over 30y; extreme-heat days projected 7→21/yr by 2055 (HVAC capex compounding) — expect insurance premiums to compound above CPI over the hold.
Questions for the listing agent
- Built in 1952 — when were the roof, HVAC, electrical panel, plumbing, and water heater last replaced?
- Is there a deadline driving the sale (1031 exchange, divorce, estate, relocation)? That informs how much negotiation room exists.
- Schools are D-rated, which usually means shorter tenancies and higher turnover. Who's the typical renter profile here, and what's been the actual vacancy rate?
- Crime grade is F in this area — have there been break-ins, vandalism, or insurance claims at this property in the last 3 years? What carrier currently insures it and at what premium?
- What's the average days-on-market for RENTAL listings here right now (not sales)? A rising rental-DOM trend means longer vacancies and softer asking-rent achievability than the comps imply.
- What's the recent tenant-quality profile in this submarket — average credit score on applications, eviction rate, late-payment / NSF rate, and stable-employment percentage? A property-management company in the area should have these aggregated.
- How much new for-sale + rental construction is in the pipeline within 1–3 miles? Heavy new supply typically softens prices + rents 12–24 months out; constrained supply supports both.
Investment metrics
- 1% rule
- 1.43% ✓
- Cap rate
- 12.76%
- Cash-on-cash
- 23.08%
- DSCR
- 2.03
- GRM
- 5.8
CMA / ARV
- ARV (on-the-fly)
- $73,440
- Comps found
- 10
Show comp detail 10 sales within ~0.75 mi
| Address | Dist | Beds/Ba | Sqft | Sold | Price | $/sf | Match |
|---|---|---|---|---|---|---|---|
| 4 Ridge St | 0.43mi | 3/1.0 (+1) | 1,062 (+4%) | 4mo | $24,900 | $23 | 65 |
| 3030 Moore Ave | 0.45mi | 2/1.0 | 928 (-9%) | 1mo | $22,500 | $24 | 63 |
| 2912 Moore Ave | 0.45mi | 3/1.0 (+1) | 968 (-5%) | 4mo | $69,900 | $72 | 63 |
| 2708 Walnut Ave | 0.51mi | 2/1.0 | 1,052 (+3%) | 16mo | $40,000 | $38 | 58 |
| 407 Rosewood Ave | 0.68mi | 2/1.0 | 1,024 (+0%) | 12mo | $114,000 | $111 | 58 |
| 22 Mcarthur Dr | 0.69mi | 2/1.0 | 944 (-8%) | 3mo | $79,000 | $84 | 53 |
| 6 Twine St | 0.43mi | 2/1.0 | 1,140 (+12%) | 17mo | $13,500 | $12 | 47 |
| 3014 Walnut Ave | 0.38mi | 3/1.5 (+1) | 1,150 (+13%) | 10mo | $144,500 | $126 | 46 |
| 2709 Mckleroy Ave | 0.65mi | 3/1.0 (+1) | 1,009 (-1%) | 20mo | $27,000 | $27 | 46 |
| 1404 Willett St | 0.57mi | 2/1.0 | 1,118 (+10%) | 16mo | $125,000 | $112 | 44 |
Match score weights: distance 35% · size 25% · config 20% · recency 20%. Top-matched comps best support the ARV.
Projected returns pro-forma
-3.0% appreciation · 3.0% rent growth · sell at horizon
- IRR
- 16.0%
- Equity multiple
- 1.65×
- Total profit
- $14,270
- Equity at exit
- $11,779
- IRR
- 24.6%
- Equity multiple
- 3.13×
- Total profit
- $47,201
- Equity at exit
- $6,830
Cash invested: $22,120 (down + closing). Projections, not guarantees.
Landlord ↔ Tenant lean methodology
- Overall (STATE)
- 90 Strongly Landlord-Friendly
- State Alabama
- 90 Strongly Landlord-Friendly · R+15
- County
- — inherits STATE
- City
- — inherits STATE
ZIP-level market 36201
- Active inventory
- 73
- Price-to-rent
- 5.8×
Monthly cashflow live
- Estimated rent
- $1,132 high interval (Pro) →
- Mortgage (P&I)
- −$414
- Tax from tax record
- −$22 /mo · $261/yr
- Insurance
- −$33
- HOA
- −$0
- Vacancy / Maint / Mgmt
- −$238
- Net cashflow
- $426
Break-even live
UW: 25.0% down · 7.5% · 30yr · 1.5% tax · 5.0% vac · 8.0% maint · 8.0% mgmt
Financing live
Cash to close
- Down payment
- $19,750
- Closing costs
- $2,370
- Reserves months
- —
- Total cash needed
- —
Loan-product check · same deal, 3 products live
Conventional
25% down · 7.5% · 30yr
- Down + closing
- —
- Monthly P&I
- —
- Monthly cashflow
- —
- DSCR
- —
- Eligible?
- —
Personal DTI + credit; lowest rate.
DSCR
20% down · 8.5% · 30yr
- Down + closing
- —
- Monthly P&I
- —
- Monthly cashflow
- —
- DSCR
- —
- Eligible?
- —
No personal income docs; deal must DSCR.
Hard money
10% down · 12.0% · 12mo
- Down + closing
- —
- Monthly P&I
- —
- Monthly cashflow
- —
- DSCR
- —
- Eligible?
- —
Short-term bridge; refi at stabilization.
Rent comps 5 comps
| Address | Beds | Baths | Sqft | Rent | $/sqft | DOM | Units | Dist |
|---|---|---|---|---|---|---|---|---|
| 305 Dogwood Ave Anniston, AL | 3.0 | 2.0 | 1015 | $1,100 | $1.08 | 43d | 1 | 0.56mi |
| 323 W 22nd St Anniston, AL | 2.0 | 1.0 | 1194 | $950 | $0.80 | 43d | 1 | 0.91mi |
| 2117 Moore Ave Unit NA Anniston, AL | 2.0 | 1.0 | 1102 | $1,385 | $1.26 | 43d | 1 | 0.98mi |
| 1605 W 21st St Anniston, AL | 3.0 | 1.0 | 970 | $950 | $0.98 | 43d | 1 | 1.10mi |
| 1831 Moore Ave Anniston, AL | 3.0 | 2.0 | 1494 | $1,395 | $0.93 | 43d | 1 | 1.21mi |
Listing history 4 events
-
2026-06-19days on market $79,000 Active 3 DOM
-
2026-06-18days on market $79,000 Active 2 DOM
-
2026-06-17remarks 459-char remark
-
2026-06-17$79,000 Active 1 DOM
ⓘ Source: listings_history table (triggers on properties + properties_extension) + one-shot
backfill from property_details.listing_events for pre-trigger history.
Tax reassessment forecast AL · Resets to sale price
- Current annual tax
- $261 · $22/mo
- Projected year-2 tax
- $324 · $27/mo
- Expected delta
- +$63/yr (+$5/mo · 24.3%)
ⓘ Screening estimate from a state-policy table — verify with the county assessor before closing.
Climate risk First Street
- Flood 1/10 Low FEMA zone X (unshaded) · 0% chance over 30 yrs
- Wildfire 4/10 Moderate
- Heat 6/10 Major 7 d/yr ≥105°F today · 21 d/yr by 30 yrs out
- Wind 6/10 Major 27% chance of damaging wind over 30 yrs
- Air quality 2/10 Low 1 unhealthy d/yr today · 1 by 30 yrs out
Nearby sold comps map
Loading sold comps map…
Walkable amenities ~0.75 mi
Loading nearby amenities…
Taxation est. · year 1
- Rental income
- $13,586
- − Mortgage interest
- −$4,425
- − Property taxes
- −$261
- − Insurance
- −$395
- − Repairs & maintenance
- −$1,087
- − Management
- −$1,087
- − Depreciation
- −$2,298
- Taxable income
- $4,034
- Est. tax owed @ 24.0%
- −$968
- After-tax cash flow
- $4,138/yr
For passive investors: Depreciation is non-cash, so a rental often shows a tax loss while cash-flowing — sheltering income. Rental losses are passive: they offset passive income freely, and up to $25,000/yr can offset ordinary (W-2) income if you actively participate and your MAGI is under $100k (phasing out to $0 by $150k); unused losses carry forward. On sale, claimed depreciation is recaptured at up to 25%, and gains may owe capital-gains tax (a 1031 exchange can defer both). Figures are a year-1 estimate at your 24.0% rate — not tax advice; consult a CPA.
Schools (NCES district)
- District
- Anniston City
- NCES district ID
- 0100090
- Math proficiency
- 2% ▼ -20.00%
- Reading proficiency
- 12% ▼ -15.00%
- Median HH income
- $31,824
- Composite
- 5.36/100
- National rank
- #10030
- State rank
- #128 of 129 in AL
Livability — Anniston
- Score
- 58/100
- State rank
- #348
- US rank
- #20680
Category grades
Schools grade is shown separately in the Schools card above.
Census & demographics
- Census place
- Anniston, AL
- City population
- 19,220
- Population (ZIP)
- 17,406
Population outlook (Calhoun County) Hauer SSP2
- Today (2025)
- 109,765 people
- By 2030
- 105,708 · -3.7%
- By 2040
- 96,192 · -12.4%
- By 2050
- 86,413 · -21.3%
- By 2075
- 63,467 · -42.2%
- By 2100
- 44,704 · -59.3%
Race, ethnicity, and origin ACS 2023
- Neighborhood character
- Diverse neighborhood (Simpson 0.57)
- Race & ethnicity
- White 47% Black 46% Two or more races 5% Hispanic / Latino 3%
- Common ancestry
- Lithuanian 2% Slovak 1% Scandinavian 1%
- Foreign-born
- 2% · Canada
- Languages at home
- 98% English-only · Spanish 2%
Political lean MEDSL · Calhoun
- 2024 margin
- Solid R (+44.8) · D 27.2% · R 71.9%
- 2008→2024 swing
- -12.2pp toward R · 2008: -32.5pp · 2024: -44.8pp
- All cycles
- 2024: R+44.8 2020: R+39.0 2016: R+41.4 2012: R+31.9 2008: R+32.5
Not yet ingested
- Civics
- —
Market trends
- HPI YoY
- ▼ -78.92%
- Current HPI
- 59.1512
- Rent YoY
- —
- Metro
- —
- State GDP YoY
- ▲ 2.94%
- F500 in state
- 4
Industry mix (Fortune 500 HQ in AL)
| Industry | F500 HQs | Revenue |
|---|---|---|
| Financial Services | 1 | $8B |
|
||
| Healthcare | 1 | $5B |
|
||
Price history
1 event — show timeline
- 2026-06-15 Listed $79,000 Greater Alabama MLS
Property tax history
+5.7%/yrLatest (2025): $261 · -50.7% YoY. Source: county tax records.
Cash-flow waterfall
monthlySold comps — $/sqft
last 12 mo · ≤1 miLoading sold comps…