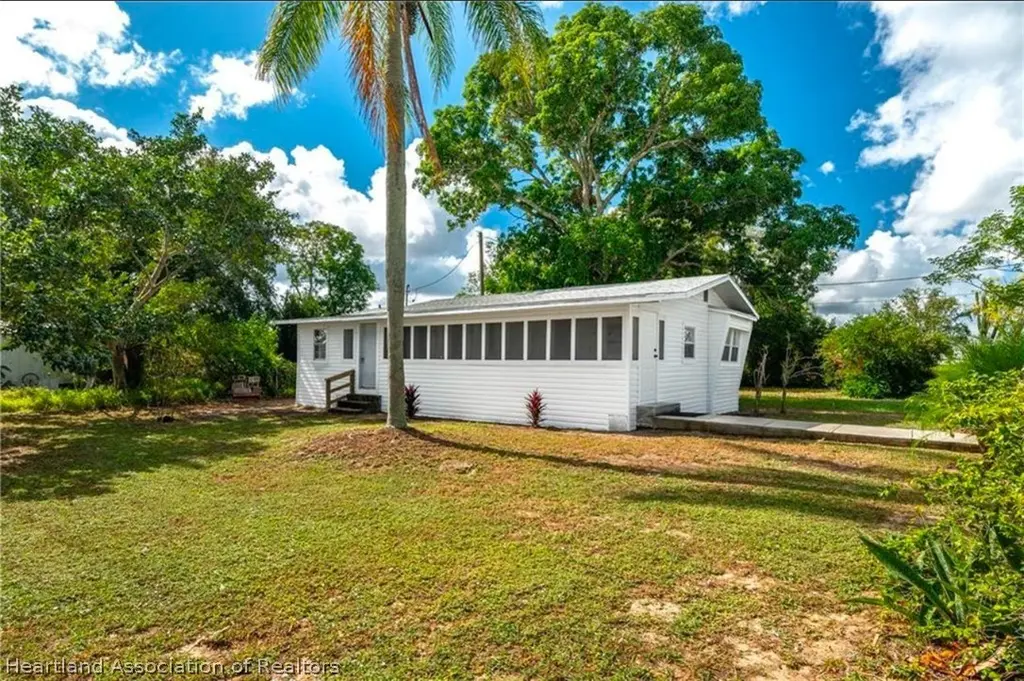
715 Lincoln Ave · Sebring, FL
Flood risk 1/10 · Minimal
- FEMA flood zone
- X (unshaded)
- Chance of flooding over 30 yrs
- 0.0%
- Est. flood insurance / yr
- $507 – $1,088
Fire risk 5/10 · Moderate
- Est. fire insurance / yr
- $947 – $1,759
Heat risk 9/10 · Severe
- Hot days now (above 108°F)
- 7 days/yr
- Hot days in 30 yrs
- 25 days/yr
Wind risk 10/10 · Severe
- Chance of severe wind over 30 yrs
- 99.0%
Air-quality risk 2/10 · Minimal
- Unhealthy air days now
- 1 days/yr
- Unhealthy air days in 30 yrs
- 1 days/yr
Risk factors via First Street. Map © Google.
Why this score? — see what drove the B- grade
The composite is a weighted blend of 9 inputs, each scored 0–100. Each bar is that input's sub-score; the figure is the points it added to the 100-point composite (weight × sub-score).
- Cash flow +30.0/30.0
- 1% rule +10.0/10.0
- DSCR +10.0/10.0
- ARV discount +7.5/15.0
- Schools +3.6/10.0
- Livability +3.3/5.0
- Condition / age +2.5/5.0
- Rent growth +2.4/5.0
- Appreciation +0.0/10.0
$75,900
🖨 Deal sheet (PDF) 📄 Offer letter ✓ Due diligence
Listing remarks
Income-producing 2-unit mobile home property in Sebring offering immediate cash flow and strong rental potential. The property features two separate 1 bed / 1 bath units. The front unit (380 sq ft) is currently rented for $750 per month with a lease in place through May 16, 2027, while the back unit (256 sq ft) is tenant-occupied at $650 per month with a lease in place through 09/23/2026. Property features include a 2022 roof, shared washer/dryer room, and a termite warranty. Rent includes utilities up to $150 per month. To avoid disturbing tenants, showings will be available once the property is under contract. Great opportunity for investors looking to add a stable income-producing proper
Key facts
- Immediate cash flow
- Income producing
- 2022 roof
Tags
Property features AI
Finance
- Other: Property type: Residential Income
- Financial info: Unit 1 rent: $750; Unit 2 rent: $650
Exterior
- Utilities: Public water; No sewer service listed
- Home design: One story; Residential income property; Zoning: b4
- Construction: Shingle roof; Construction materials: see remarks
- Exterior features: Paved road frontage; 40 ft frontage
Interior
- Bedrooms: Unit 1: 1 bedroom; Unit 2: 1 bedroom
- Flooring: Vinyl
- Bathrooms: 2 full bathrooms (total); Unit 1: 1 bathroom; Unit 2: 1 bathroom
- Heating & cooling: Wall furnace; Wall-mounted cooling unit(s)
- Interior features: Vinyl flooring; Wall furnace heating; Wall unit cooling
Neighborhood map
What this means for you Summary
Snapshot
- This is a 2-bed/2.0-bath manufactured listed at $76k.
Deal economics
- At list price, monthly cash flow is $392 ($5k/yr) — positive.
- The deal already cash-flows at list — no discount required.
- Meets the 1% rule at list price ($1k rent vs $76k).
- Recommended offer: $71k (6.0% below list) — sets the bar for market timing.
- Cap rate 12.5% vs local median 4.3% in Sebring — top-decile yield for the area; either an underpriced asset or a hidden risk that comps aren't pricing in. Stress-test before assuming the spread holds.
Location & tenants
- Location reads 66/100 on livability (#618 in FL) — a middle-class / working-renter tenant base. Strengths: cost of living A+, housing A+, health & safety A; Watch: schools D, amenities F, commute F.
- Highlands (other): math 45% / reading 43% proficiency, ranked #54 of 73 in FL (top 74%) — families likely to look elsewhere, expect single-tenant / working-renter base with shorter leases; 68% free/reduced lunch — lower-income household profile, screen leases tightly.
- Market conditions: Rents soft (-0.3%/yr); 475 active listings in the ZIP; 980 units permitted in Highlands County in 2024 (80 in 5+ unit buildings).
Forward outlook
- Local home prices are declining (-3.0%/yr); year-one equity from $525 of loan paydown is wiped out by about $2k of value loss. Plan a longer hold.
- At projected returns (-3.0% appreciation + 0.0% rent growth), your $21k cash investment doubles in ~7 years — after that, you're playing with house money.
Negotiation context
- It's been on market 70 days — a 6% lower offer ($71k) is reasonable based on typical stale-listing flexibility.
- 5 sale attempts since 5y ago; this cycle's ask has dropped $9k (11%) from the opening price — seller is motivated, your offer sets the floor, not the list.
- Current owner paid $14k; list at $76k implies a 423% gain — meaningful room to come down on a strong offer.
Risks & watch-outs
- Climate carrying-cost: severe wind risk, 99% chance of damaging wind over 30y; moderate wildfire risk; extreme-heat days projected 7→25/yr by 2055 (HVAC capex compounding) — expect insurance premiums to compound above CPI over the hold.
Questions for the listing agent
- It's been on market 70 days. Have you received any prior offers? Is the seller open to a 6% concession, seller financing, or rate buy-down credit?
- Why hasn't it sold? Are there any deal-killer items the seller is aware of (foundation, flood, title, zoning, code violations)?
- Is there a deadline driving the sale (1031 exchange, divorce, estate, relocation)? That informs how much negotiation room exists.
- Schools are D-rated, which usually means shorter tenancies and higher turnover. Who's the typical renter profile here, and what's been the actual vacancy rate?
- What's the average days-on-market for RENTAL listings here right now (not sales)? A rising rental-DOM trend means longer vacancies and softer asking-rent achievability than the comps imply.
- What's the recent tenant-quality profile in this submarket — average credit score on applications, eviction rate, late-payment / NSF rate, and stable-employment percentage? A property-management company in the area should have these aggregated.
- How much new for-sale + rental construction is in the pipeline within 1–3 miles? Heavy new supply typically softens prices + rents 12–24 months out; constrained supply supports both.
Investment metrics
- 1% rule
- 1.59% ✓
- Cap rate
- 12.49%
- Cash-on-cash
- 22.14%
- DSCR
- 1.98
- GRM
- 5.2
CMA / ARV
No comps found within radius.
Projected returns pro-forma
-3.0% appreciation · 0.0% rent growth · sell at horizon
- IRR
- 11.3%
- Equity multiple
- 1.43×
- Total profit
- $9,173
- Equity at exit
- $11,317
- IRR
- 17.7%
- Equity multiple
- 2.25×
- Total profit
- $26,636
- Equity at exit
- $6,562
Cash invested: $21,252 (down + closing). Projections, not guarantees.
Landlord ↔ Tenant lean methodology
- Overall (STATE)
- 87 Strongly Landlord-Friendly
- State Florida
- 87 Strongly Landlord-Friendly · R+3
- County
- — inherits STATE
- City
- — inherits STATE
ZIP-level market 33870
- Home prices YoY
- -20.0%
- Rents YoY
- -0.3%
- Active inventory
- 475
- Price-to-rent
- 5.2×
Monthly cashflow live
- Estimated rent
- $1,207 medium interval (Pro) →
- Mortgage (P&I)
- −$398
- Tax from tax record
- −$132 /mo · $1,581/yr
- Insurance
- −$32
- HOA
- −$0
- Vacancy / Maint / Mgmt
- −$253
- Net cashflow
- $392
Break-even live
Sensitivity live
| Price | -10% $435 | -5% $414 | +0% $392 | +5% $371 | +10% $349 |
|---|---|---|---|---|---|
| Rent | -10% $297 | -5% $344 | +0% $392 | +5% $440 | +10% $487 |
| Rate | -1.0pp $430 | -0.5pp $411 | base $392 | +0.5pp $372 | +1.0pp $352 |
UW: 25.0% down · 7.5% · 30yr · 1.5% tax · 5.0% vac · 8.0% maint · 8.0% mgmt
Financing live
Cash to close
- Down payment
- $18,975
- Closing costs
- $2,277
- Reserves months
- —
- Total cash needed
- —
Loan-product check · same deal, 3 products live
Conventional
25% down · 7.5% · 30yr
- Down + closing
- —
- Monthly P&I
- —
- Monthly cashflow
- —
- DSCR
- —
- Eligible?
- —
Personal DTI + credit; lowest rate.
DSCR
20% down · 8.5% · 30yr
- Down + closing
- —
- Monthly P&I
- —
- Monthly cashflow
- —
- DSCR
- —
- Eligible?
- —
No personal income docs; deal must DSCR.
Hard money
10% down · 12.0% · 12mo
- Down + closing
- —
- Monthly P&I
- —
- Monthly cashflow
- —
- DSCR
- —
- Eligible?
- —
Short-term bridge; refi at stabilization.
Listing history 35 events
-
2026-06-19days on market $75,900 Active 70 DOM
-
2026-06-18days on market $75,900 Active 69 DOM
-
2026-06-17days on market $75,900 Active 68 DOM
-
2026-06-16days on market $75,900 Active 67 DOM
-
2026-06-15days on market $75,900 Active 66 DOM
-
2026-06-14days on market $75,900 Active 64 DOM
-
2026-06-10days on market $75,900 Active 61 DOM
-
2026-06-09days on market $75,900 Active 60 DOM
-
2026-06-08days on market $75,900 Active 59 DOM
-
2026-06-07days on market $75,900 Active 58 DOM
-
2026-06-02days on market $75,900 Active 53 DOM
-
2026-06-01days on market $75,900 Active 52 DOM
-
2026-05-31days on market $75,900 Active 51 DOM
-
2026-05-30days on market $75,900 Active 50 DOM
-
2026-04-28price $75,900
-
2026-04-10$85,000 Active
-
2025-03-02status Pending
-
2025-02-19historical
-
2025-02-15price $75,900
-
2025-02-11price $77,500
-
2025-01-31price $79,900
-
2025-01-25price $82,900
-
2025-01-10price $87,500
-
2024-12-13price $95,000
-
2024-11-23price $100,000
-
2024-11-05$109,900 Active
-
2024-01-24price $99,999
-
2023-12-12price $105,000
-
2023-09-16price $109,999
-
2023-08-18$115,000 Active
-
2022-12-10historical
-
2022-06-13$99,999 Active
-
2022-05-26soldstatus $14,500
-
2022-05-26soldstatus $18,500
-
2021-12-01$20,000
ⓘ Source: listings_history table (triggers on properties + properties_extension) + one-shot
backfill from property_details.listing_events for pre-trigger history.
Tax reassessment forecast FL · Resets to sale price
- Current annual tax
- $1,581 · $132/mo
- Projected year-2 tax
- $1,581 · $132/mo
- Expected delta
- $0/yr ($0/mo · 0.0%)
ⓘ Screening estimate from a state-policy table — verify with the county assessor before closing.
Climate risk First Street
- Flood 1/10 Low FEMA zone X (unshaded) · 0% chance over 30 yrs
- Wildfire 5/10 Major
- Heat 9/10 Extreme 7 d/yr ≥108°F today · 25 d/yr by 30 yrs out
- Wind 10/10 Extreme 99% chance of damaging wind over 30 yrs
- Air quality 2/10 Low 1 unhealthy d/yr today · 1 by 30 yrs out
Nearby sold comps map
Loading sold comps map…
Walkable amenities ~0.75 mi
Loading nearby amenities…
Taxation est. · year 1
- Rental income
- $14,483
- − Mortgage interest
- −$4,252
- − Property taxes
- −$1,581
- − Insurance
- −$380
- − Repairs & maintenance
- −$1,159
- − Management
- −$1,159
- − Depreciation
- −$2,208
- Taxable income
- $3,745
- Est. tax owed @ 24.0%
- −$899
- After-tax cash flow
- $3,805/yr
For passive investors: Depreciation is non-cash, so a rental often shows a tax loss while cash-flowing — sheltering income. Rental losses are passive: they offset passive income freely, and up to $25,000/yr can offset ordinary (W-2) income if you actively participate and your MAGI is under $100k (phasing out to $0 by $150k); unused losses carry forward. On sale, claimed depreciation is recaptured at up to 25%, and gains may owe capital-gains tax (a 1031 exchange can defer both). Figures are a year-1 estimate at your 24.0% rate — not tax advice; consult a CPA.
Schools (NCES district)
- District
- Highlands
- NCES district ID
- 1200840
- Math proficiency
- 45% ▼ -7.00%
- Reading proficiency
- 43% ▼ -3.00%
- Median HH income
- $35,276
- Composite
- 36.42/100
- National rank
- #4672
- State rank
- #54 of 73 in FL
Livability — Sebring
- Score
- 66/100
- State rank
- #618
- US rank
- #11992
Category grades
Schools grade is shown separately in the Schools card above.
Census & demographics
- Census place
- Sebring, FL
- County
- Highlands County · 98,898 people
- City population
- 50,797
- Metro
- Sebring-Avon Park, FL
- Population (ZIP)
- 25,195
- Household income
- $49,942
- Rent vs Own
- Severe rent burden
- 994.0
Population outlook (Highlands County) Hauer SSP2
- Today (2025)
- 99,674 people
- By 2030
- 99,615 · -0.1%
- By 2040
- 99,342 · -0.3%
- By 2050
- 98,242 · -1.4%
- By 2075
- 93,291 · -6.4%
- By 2100
- 79,894 · -19.8%
Race, ethnicity, and origin ACS 2023
- Neighborhood character
- Diverse neighborhood (Simpson 0.57)
- Race & ethnicity
- White 60% Hispanic / Latino 22% Black 13% Two or more races 10% Asian 1%
- Hispanic origin (detail)
- Mexican 8% Puerto Rican 7% Cuban 5%
- Common ancestry
- Slovak 2% Romanian 1% Lithuanian 1%
- Foreign-born
- 10% · Canada, Jamaica, China
- Languages at home
- 80% English-only · Spanish 16% Other Indo-European 1% French/Haitian/Cajun 1%
Political lean MEDSL · Highlands
- 2024 margin
- Solid R (+40.8) · D 29.3% · R 70.1%
- 2008→2024 swing
- -22.7pp toward R · 2008: -18.1pp · 2024: -40.8pp
- All cycles
- 2024: R+40.8 2020: R+34.4 2016: R+32.0 2012: R+23.0 2008: R+18.1
Not yet ingested
- Civics
- —
Market trends
- HPI YoY
- ▼ -68.68%
- Current HPI
- 273.9861
- Rent YoY
- ▼ -0.29%
- Metro
- Sebring-Avon Park, FL
- State GDP YoY
- ▲ 3.28%
- F500 in state
- 36
Industry mix (Fortune 500 HQ in FL)
| Industry | F500 HQs | Revenue |
|---|---|---|
| Industrial Technology | 2 | $29B |
|
||
| Insurance | 2 | $17B |
|
||
| Retail | 1 | $60B |
|
||
| Technology Distribution | 1 | $58B |
|
||
| Homebuilding | 1 | $35B |
|
||
| Technology Manufacturing | 1 | $35B |
|
||
Price history
+279.5% since first listed21 events — show timeline
- 2026-04-28 Price Changed $75,900 HAOR as distributed by MLS GRID
- 2026-04-10 Listed $85,000 HAOR as distributed by MLS GRID
- 2025-03-02 Pending — Stellar MLS as Distributed by MLS Grid
- 2025-02-19 Listing Removed — Stellar MLS as Distributed by MLS Grid
- 2025-02-15 Price Changed $75,900 Stellar MLS as Distributed by MLS Grid
- 2025-02-11 Price Changed $77,500 Stellar MLS as Distributed by MLS Grid
- 2025-01-31 Price Changed $79,900 Stellar MLS as Distributed by MLS Grid
- 2025-01-25 Price Changed $82,900 Stellar MLS as Distributed by MLS Grid
- 2025-01-10 Price Changed $87,500 Stellar MLS as Distributed by MLS Grid
- 2024-12-13 Price Changed $95,000 Stellar MLS as Distributed by MLS Grid
- 2024-11-23 Price Changed $100,000 Stellar MLS as Distributed by MLS Grid
- 2024-11-05 Listed $109,900 Stellar MLS as Distributed by MLS Grid
- 2024-01-24 Price Changed $99,999 HAOR as distributed by MLS GRID
- 2023-12-12 Price Changed $105,000 HAOR as distributed by MLS GRID
- 2023-09-16 Price Changed $109,999 HAOR as distributed by MLS GRID
- 2023-08-18 Listed $115,000 HAOR as distributed by MLS GRID
- 2022-12-10 Listing Removed — Stellar MLS as Distributed by MLS Grid
- 2022-06-13 Listed $99,999 Stellar MLS as Distributed by MLS Grid
- 2022-05-26 Sold (Public Records) $18,500 Public Records
- 2022-05-26 Sold (MLS) $14,500 HAOR as distributed by MLS GRID
- 2021-12-01 Listed $20,000 HAOR as distributed by MLS GRID
Property tax history
+14.6%/yrLatest (2025): $1,581 · -2.6% YoY. Source: county tax records.
Cash-flow waterfall
monthlySold comps — $/sqft
last 12 mo · ≤1 miLoading sold comps…