 🏷️ Likely Rental
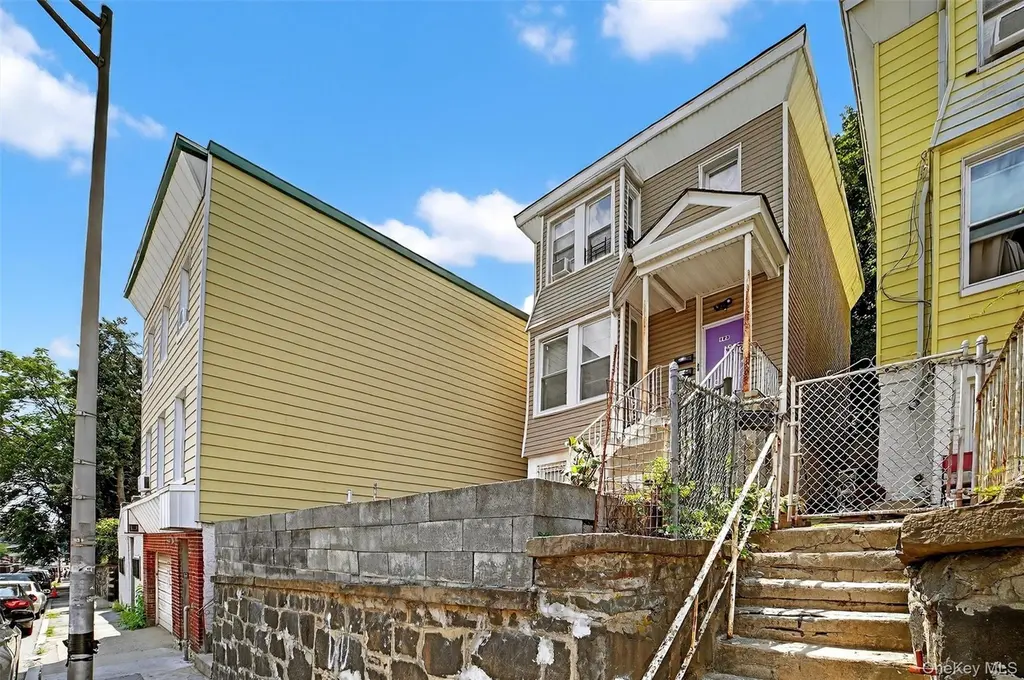
105 Palisade Ave · Yonkers, NY
Flood risk 1/10 · Minimal
- FEMA flood zone
- X (unshaded)
- Chance of flooding over 30 yrs
- 0.0%
- Est. flood insurance / yr
- $473 – $860
Fire risk 1/10 · Minimal
- Est. fire insurance / yr
- $691 – $1,283
Heat risk 6/10 · Moderate
- Hot days now (above 99°F)
- 7 days/yr
- Hot days in 30 yrs
- 15 days/yr
Wind risk 6/10 · Moderate
- Chance of severe wind over 30 yrs
- 27.0%
Air-quality risk 3/10 · Minor
- Unhealthy air days now
- 3 days/yr
- Unhealthy air days in 30 yrs
- 4 days/yr
Risk factors via First Street. Map © Google.
Why this score? — see what drove the B- grade
The composite is a weighted blend of 9 inputs, each scored 0–100. Each bar is that input's sub-score; the figure is the points it added to the 100-point composite (weight × sub-score).
- Cash flow +25.5/30.0
- ARV discount +15.0/15.0
- DSCR +8.5/10.0
- 1% rule +6.7/10.0
- Schools +4.1/10.0
- Rent growth +3.6/5.0
- Livability +3.4/5.0
- Condition / age +2.5/5.0
- Appreciation +0.0/10.0
$790,000
🖨 Deal sheet 📄 Offer letter ✓ Due diligence
Multi-family units
County records classify this as Multi-Family (2-4 Unit). Listing-text estimate: 3 units. confirmed
Listing remarks MLS
INVESTOR SPECIAL: 10% PRO-FORMA CAP RATE POTENTIAL. 105 Palisade is a high-alpha asset for the data-driven investor. This 3-unit configuration (2-unit legal w/ finished basement) offers a significant "Value-Add" bridge between current $5,415/mo gross income and a forecasted $8,255/mo market peak. Positioned in a high-growth Yonkers corridor with 3-4% annual appreciation forecasted for 2026, this property is ideal for "Smart-Home" optimization and ESG upgrades to drive premium rents. Sold as-is with paying tenants—one lease expiring 2/28/26 provides an immediate window for rental upside. High-speed fiber-ready and minutes from Metro-North, this is a low-latency investment in New York’s next tech-hub suburb. Capture the spread before the market corrects.
Key facts
- 2,178 sq ft lot
- Built 1925
- Listed 73 days
Neighborhood map
What this means for you Summary
Snapshot
- This is a 3 × 3-bed/1.3-bath units multifamily listed at $790k.
Deal economics
- At list price, monthly cash flow is $2k ($22k/yr) — positive. Per door: $617/mo.
- The deal already cash-flows at list — no discount required.
- Meets the 1% rule at list price ($9k rent vs $790k).
- Recommended offer: $743k (6.0% below list) — sets the bar for market timing.
- Cap rate 9.1% vs local median 5.3% in Yonkers — top-decile yield for the area; either an underpriced asset or a hidden risk that comps aren't pricing in. Stress-test before assuming the spread holds.
Location & tenants
- Location reads 68/100 on livability (#528 in NY) — a middle-class / working-renter tenant base. Strengths: employment A, commute B; Watch: amenities F, cost of living F.
- Yonkers City School District (suburban): math 41% / reading 54% proficiency, ranked #413 of 590 in NY (top 70%) — families likely to look elsewhere, expect single-tenant / working-renter base with shorter leases; 64% free/reduced lunch — lower-income household profile, screen leases tightly.
- Market conditions: Rents rising fast (+4.4%/yr); 183 active listings in the ZIP; 4 comparable units currently listed for rent nearby; rentals lingering (median 44d on market — plan ~5-8 weeks vacancy on turnover, expect pricing pressure); 50% of comp listings sitting > 30 days — soft ceiling on asking rent; 954 units permitted in Westchester County in 2024 (649 in 5+ unit buildings).
- At $9,255/mo this rent would consume 171% of the median local household income ($65k/yr) (locally 6045% of renters already pay >50% of income on rent) — very limited rent-growth headroom before tenants either downsize or default.
Forward outlook
- Local home prices are declining (-3.0%/yr); year-one equity from $5k of loan paydown is wiped out by about $24k of value loss. Plan a longer hold.
- Westchester County population projected at +10% by 2050 — modest demand growth; plan on rents tracking national, not racing it.
- At projected returns (-3.0% appreciation + 4.4% rent growth), your $221k cash investment doubles in ~10 years — after that, you're playing with house money.
Negotiation context
- It's been on market 73 days — a 6% lower offer ($743k) is reasonable based on typical stale-listing flexibility.
- 5 sale attempts since 15y ago with the ask held roughly flat each time — persistent listings suggest the price (not the market) is what's stuck; bring a comps-based counter.
- Current owner paid $85k; list at $790k implies a 829% gain — meaningful room to come down on a strong offer.
Risks & watch-outs
- Watch-outs: built in 1925 — expect roof / HVAC / electrical / plumbing capex.
- Climate carrying-cost: major wind risk, 27% chance of damaging wind over 30y; extreme-heat days projected 7→15/yr by 2055 (HVAC capex compounding) — expect insurance premiums to compound above CPI over the hold.
Questions for the listing agent
- It's been on market 73 days. Have you received any prior offers? Is the seller open to a 6% concession, seller financing, or rate buy-down credit?
- Can we see the unit-by-unit rent roll, current vacancy, and any below-market leases? What's the average tenancy length?
- What capital expenditures (roof, boiler, parking lot, exteriors) have been made in the last 5 years, and what's planned in the next 2?
- Built in 1925 — when were the roof, HVAC, electrical panel, plumbing, and water heater last replaced?
- Why hasn't it sold? Are there any deal-killer items the seller is aware of (foundation, flood, title, zoning, code violations)?
- Is there a deadline driving the sale (1031 exchange, divorce, estate, relocation)? That informs how much negotiation room exists.
- What's the average days-on-market for RENTAL listings here right now (not sales)? A rising rental-DOM trend means longer vacancies and softer asking-rent achievability than the comps imply.
- What's the recent tenant-quality profile in this submarket — average credit score on applications, eviction rate, late-payment / NSF rate, and stable-employment percentage? A property-management company in the area should have these aggregated.
- How much new apartment / multifamily construction is in the pipeline within 1–3 miles? Heavy new supply (>2% of stock underway) typically softens rents 12–24 months out; light construction supports rent growth.
Investment metrics
- 1% rule
- 1.17% ✓
- Cap rate
- 9.11%
- Cash-on-cash
- 10.05%
- DSCR
- 1.45
- GRM
- 7.1
CMA / ARV
- ARV (median comp)
- $1,075,481
- List price
- $790,000
- Delta
- -26.54%
- Verdict
- UNDERPRICED
- Comps
- 20 within 1.0 mi
Show comp detail 6 sales within ~0.75 mi
| Address | Dist | Beds/Ba | Sqft | Sold | Price | $/sf | Match |
|---|---|---|---|---|---|---|---|
| 26 Vineyard Ave | 0.43mi | 4/3.5 (-1) | 1,680 (+3%) | 6mo | $500,000 | $298 | 60 |
| 42 Alder St | 0.70mi | 6/2.0 (+1) | 1,620 (-0%) | 1mo | $900,000 | $556 | 59 |
| 10 Cliff St | 0.57mi | 5/2.0 | 1,662 (+2%) | 14mo | $580,000 | $349 | 56 |
| 21 Henrietta St | 0.61mi | 4/3.0 (-1) | 1,620 (-0%) | 13mo | $692,500 | $427 | 53 |
| 162 Oak St | 0.54mi | 4/2.0 (-1) | 1,638 (+1%) | 19mo | $230,000 | $140 | 51 |
| 10 Garfield St | 0.49mi | 5/2.0 | 1,460 (-10%) | 24mo | $525,000 | $360 | 38 |
Match score weights: distance 35% · size 25% · config 20% · recency 20%. Top-matched comps best support the ARV.
Projected returns pro-forma
-3.0% appreciation · 4.39% rent growth · sell at horizon
- IRR
- 0.4%
- Equity multiple
- 1.01×
- Total profit
- $3,199
- Equity at exit
- $117,792
- IRR
- 11.4%
- Equity multiple
- 1.95×
- Total profit
- $210,630
- Equity at exit
- $68,305
Cash invested: $221,200 (down + closing). Projections, not guarantees.
Landlord ↔ Tenant lean methodology
- Overall (CITY)
- 5 Strongly Tenant-Friendly
- State New York
- 15 Strongly Tenant-Friendly · D+10
- County
- — inherits STATE
- City Yonkers
- 5 Strongly Tenant-Friendly · D+20
ZIP-level market 10701
- Rents YoY
- 4.4%
- Active inventory
- 183
- Price-to-rent
- 21.3×
Monthly cashflow live
- Estimated rent
- $9,255 high interval (Pro) →
- Mortgage (P&I)
- −$4,143
- Tax est. 1.5%
- −$988 /mo · $11,850/yr
- Insurance
- −$329
- HOA
- −$0
- Vacancy / Maint / Mgmt
- −$1,944
- Net cashflow
- $1,852
Break-even live
3-unit breakdown (identical units grouped — click to expand)
| Units | Beds | Baths | Est. rent |
|---|---|---|---|
| 3× units | 3 | 1.3 | $9,255 |
| #1 | 3 | 1.3 | $3,085 |
| #2 | 3 | 1.3 | $3,085 |
| #3 | 3 | 1.3 | $3,085 |
| Total (3 units) | $9,255 | ||
UW: 25.0% down · 7.5% · 30yr · 1.5% tax · 5.0% vac · 8.0% maint · 8.0% mgmt
Financing live
Cash to close
- Down payment
- $197,500
- Closing costs
- $23,700
- Reserves months
- —
- Total cash needed
- —
Loan-product check · same deal, 3 products live
Conventional
25% down · 7.5% · 30yr
- Down + closing
- —
- Monthly P&I
- —
- Monthly cashflow
- —
- DSCR
- —
- Eligible?
- —
Personal DTI + credit; lowest rate.
DSCR
20% down · 8.5% · 30yr
- Down + closing
- —
- Monthly P&I
- —
- Monthly cashflow
- —
- DSCR
- —
- Eligible?
- —
No personal income docs; deal must DSCR.
Hard money
10% down · 12.0% · 12mo
- Down + closing
- —
- Monthly P&I
- —
- Monthly cashflow
- —
- DSCR
- —
- Eligible?
- —
Short-term bridge; refi at stabilization.
Rent comps 4 comps
| Address | Beds | Baths | Sqft | Rent | $/sqft | DOM | Units | Dist |
|---|---|---|---|---|---|---|---|---|
| 37 Troy Ln Unit 1 Yonkers, NY | 4.0 | 1.5 | 1500 | $4,200 | $2.80 | 7d | 1 | 1.00mi |
| 80 Elliott Ave Unit 3rd Floor Yonkers, NY | 4.0 | 1.0 | 1500 | $4,100 | $2.73 | 43d | 1 | 1.13mi |
| 11 Lawrence St Unit 1L Yonkers, NY | 4.0 | 1.0 | 2000 | $3,400 | $1.70 | 19d | 1 | 1.44mi |
| 497 Van Cortlandt Park Ave Yonkers, NY | 4.0 | 1.0 | 1200 | $3,500 | $2.92 | 43d | 1 | 1.47mi |
Listing history 29 events
-
2026-06-18days on market $790,000 Active 73 DOM
-
2026-06-17days on market $790,000 Active 72 DOM
-
2026-06-16days on market $790,000 Active 71 DOM
-
2026-06-15days on market $790,000 Active 70 DOM
-
2026-06-13days on market $790,000 Active 68 DOM
-
2026-06-09days on market $790,000 Active 64 DOM
-
2026-06-08days on market $790,000 Active 63 DOM
-
2026-06-07days on market $790,000 Active 62 DOM
-
2026-06-04days on market $790,000 Active 59 DOM
-
2026-06-03days on market $790,000 Active 58 DOM
-
2026-06-02days on market $790,000 Active 57 DOM
-
2026-06-01days on market $790,000 Active 56 DOM
-
2026-05-31days on market $790,000 Active 55 DOM
-
2026-04-06$790,000 Active 794-char remark
Show marketing remark (794 chars)
INVESTOR SPECIAL: 10% PRO-FORMA CAP RATE POTENTIAL. 105 Palisade is a high-alpha asset for the data-driven investor. This 3-unit configuration (2-unit legal w/ finished basement) offers a significant "Value-Add" bridge between current $5,415/mo gross income and a forecasted $8,255/mo market peak. Positioned in a high-growth Yonkers corridor with 3-4% annual appreciation forecasted for 2026, this property is ideal for "Smart-Home" optimization and ESG upgrades to drive premium rents. Sold as-is with paying tenants—one lease expiring 2/28/26 provides an immediate window for rental upside. High-speed fiber-ready and minutes from Metro-North, this is a low-latency investment in New York’s next tech-hub suburb. Capture the spread before the market corrects.
-
2026-04-01historical
-
2026-03-02price $790,000
-
2025-10-14price $800,000
-
2025-09-02$875,000 Active
-
2015-12-22soldstatus $85,000
-
2015-03-31historical Withdrawn
-
2015-03-31historical
-
2014-12-11Active
-
2014-12-11$150,000
-
2014-04-07price $45,000
-
2014-03-15price $45,199
-
2012-03-01soldstatus $45,199 Sold
-
2011-11-16historical
-
2011-10-25$45,000 Active
-
1987-01-21soldstatus $40,000
ⓘ Source: listings_history table (triggers on properties + properties_extension) + one-shot
backfill from property_details.listing_events for pre-trigger history.
Climate risk First Street
- Flood 1/10 Low FEMA zone X (unshaded) · 0% chance over 30 yrs
- Wildfire 1/10 Low
- Heat 6/10 Major 7 d/yr ≥99°F today · 15 d/yr by 30 yrs out
- Wind 6/10 Major 27% chance of damaging wind over 30 yrs
- Air quality 3/10 Moderate 3 unhealthy d/yr today · 4 by 30 yrs out
Nearby sold comps map
Loading sold comps map…
Walkable amenities ~0.75 mi
Loading nearby amenities…
Taxation est. · year 1
- Rental income
- $111,060
- − Mortgage interest
- −$44,252
- − Property taxes
- −$11,850
- − Insurance
- −$3,950
- − Repairs & maintenance
- −$8,885
- − Management
- −$8,885
- − Depreciation
- −$22,982
- Taxable income
- $10,256
- Est. tax owed @ 24.0%
- −$2,462
- After-tax cash flow
- $19,762/yr
For passive investors: Depreciation is non-cash, so a rental often shows a tax loss while cash-flowing — sheltering income. Rental losses are passive: they offset passive income freely, and up to $25,000/yr can offset ordinary (W-2) income if you actively participate and your MAGI is under $100k (phasing out to $0 by $150k); unused losses carry forward. On sale, claimed depreciation is recaptured at up to 25%, and gains may owe capital-gains tax (a 1031 exchange can defer both). Figures are a year-1 estimate at your 24.0% rate — not tax advice; consult a CPA.
Schools (NCES district)
- District
- Yonkers City School District
- NCES district ID
- 3631920
- Math proficiency
- 41% ▼ -1.00%
- Reading proficiency
- 54% ▲ 14.00%
- Median HH income
- $58,042
- Composite
- 41.43/100
- National rank
- #3471
- State rank
- #413 of 590 in NY
Livability — Yonkers
- Score
- 68/100
- State rank
- #528
- US rank
- #9394
Category grades
Schools grade is shown separately in the Schools card above.
Census & demographics
- Census place
- Yonkers, NY
- County
- Westchester County · 709,332 people
- City population
- 212,407
- Metro
- New York-Newark-Jersey City, NY-NJ-PA
- Population (ZIP)
- 70,676
- Household income
- $64,776
- Rent vs Own
- Severe rent burden
- 6045.0
Population outlook (Westchester County) Hauer SSP2
- Today (2025)
- 1,028,035 people
- By 2030
- 1,051,636 · +2.3%
- By 2040
- 1,098,520 · +6.9%
- By 2050
- 1,136,044 · +10.5%
- By 2075
- 1,196,925 · +16.4%
- By 2100
- 1,175,147 · +14.3%
Race, ethnicity, and origin ACS 2023
- Neighborhood character
- Diverse neighborhood (Simpson 0.65)
- Race & ethnicity
- Hispanic / Latino 52% White 21% Black 21% Two or more races 18% Asian 3% Native American 1%
- Hispanic origin (detail)
- Mexican 11% Puerto Rican 9% Dominican 19%
- Common ancestry
- Romanian 1% Russian 1% Subsaharan African 1%
- Foreign-born
- 35% · Canada, Jamaica, South Korea
- Languages at home
- 45% English-only · Spanish 42% Other Indo-European 3% Arabic 2%
Political lean MEDSL · Westchester
- 2024 margin
- Strong D (+26.3) · D 63.1% · R 36.9%
- 2008→2024 swing
- -1.3pp toward R · 2008: 27.6pp · 2024: 26.3pp
- All cycles
- 2024: D+26.3 2020: D+36.3 2016: D+32.8 2012: D+22.2 2008: D+27.6
Not yet ingested
- Civics
- —
Market trends
- HPI YoY
- ▼ -373.14%
- Current HPI
- 332.0999
- Rent YoY
- ▲ 4.39%
- Metro
- New York-Newark-Jersey City, NY-NJ-PA
- State GDP YoY
- ▲ 2.60%
- F500 in state
- 92
Industry mix (Fortune 500 HQ in NY)
| Industry | F500 HQs | Revenue |
|---|---|---|
| Financial Services | 10 | $950B |
|
||
| Consumer Goods | 9 | $162B |
|
||
| Insurance | 4 | $225B |
|
||
| Telecommunications | 2 | $144B |
|
||
| Pharmaceuticals | 2 | $112B |
|
||
| Media / Entertainment | 2 | $69B |
|
||
Price history
+1875.0% since first listed16 events — show timeline
- 2026-04-06 Listed $790,000 OneKey® MLS as Distributed by MLS Grid
- 2026-04-01 Listing Removed — OneKey® MLS as Distributed by MLS Grid
- 2026-03-02 Price Changed $790,000 OneKey® MLS as Distributed by MLS Grid
- 2025-10-14 Price Changed $800,000 OneKey® MLS as Distributed by MLS Grid
- 2025-09-02 Listed $875,000 OneKey® MLS as Distributed by MLS Grid
- 2015-12-22 Sold (Public Records) $85,000 Public Records
- 2015-03-31 Delisted — HGMLS
- 2015-03-31 Listing Removed — OneKey® MLS as Distributed by MLS Grid
- 2014-12-11 Listed — HGMLS
- 2014-12-11 Listed $150,000 OneKey® MLS as Distributed by MLS Grid
- 2014-04-07 Price Changed $45,000 HGMLS
- 2014-03-15 Price Changed $45,199 HGMLS
- 2012-03-01 Sold (MLS) $45,199 HGMLS
- 2011-11-16 Delisted — HGMLS
- 2011-10-25 Listed $45,000 HGMLS
- 1987-01-21 Sold (Public Records) $40,000 Public Records
Property tax history
-24.7%/yrLatest (2025): $1,227 · +0.8% YoY. Source: county tax records.
Cash-flow waterfall
monthlySold comps — $/sqft
last 12 mo · ≤1 miLoading sold comps…