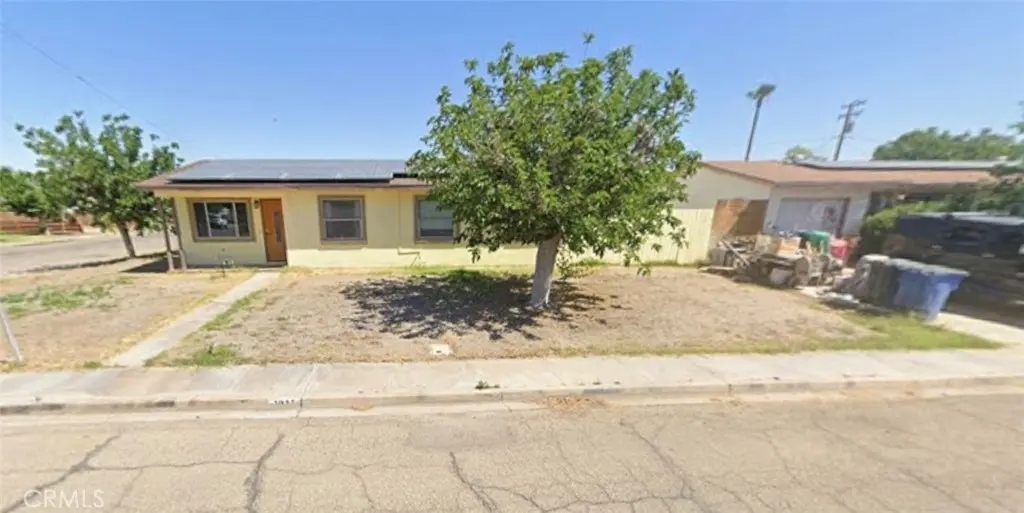
1011 E California · Blythe, CA
Flood risk 1/10 · Minimal
- FEMA flood zone
- D
- Chance of flooding over 30 yrs
- 0.0%
- Est. flood insurance / yr
- $544 – $1,084
Fire risk 1/10 · Minimal
- Est. fire insurance / yr
- $659 – $1,223
Heat risk 9/10 · Severe
- Hot days now (above 116°F)
- 7 days/yr
- Hot days in 30 yrs
- 18 days/yr
Wind risk 1/10 · Minimal
- Chance of severe wind over 30 yrs
- —
Air-quality risk 2/10 · Minimal
- Unhealthy air days now
- 1 days/yr
- Unhealthy air days in 30 yrs
- 1 days/yr
Risk factors via First Street. Map © Google.
Why this score? — see what drove the C- grade
The composite is a weighted blend of 9 inputs, each scored 0–100. Each bar is that input's sub-score; the figure is the points it added to the 100-point composite (weight × sub-score).
- Cash flow +15.6/30.0
- ARV discount +15.0/15.0
- DSCR +4.8/10.0
- 1% rule +4.3/10.0
- Livability +3.7/5.0
- Schools +2.6/10.0
- Rent growth +2.5/5.0
- Condition / age +2.5/5.0
- Appreciation +0.0/10.0
$185,000
🖨 Deal sheet 📄 Offer letter ✓ Due diligence
Listing remarks
Exceptional opportunity to own a home with built in equity potential at an attractive price point. Recently repositioned to provide outstanding value for today’s buyer, this property offers the chance to personalize and create long term value while enjoying the comfort of an established neighborhood. The home features spacious living areas filled with natural light, ceiling fans throughout, an attached garage, RV access, ample outdoor space, central air conditioning, and solar to help support everyday comfort and efficiency. Conveniently located near local schools, shopping, dining, and freeway access, this property presents a rare combination of affordability, functionality, potentia
Key facts
- Ample outdoor space
- Rv access
- Ceiling fans
Tags
Property features AI
Finance
- Other: Single-unit property; No accessory dwelling unit (ADU); Living area and lot size sourced from assessor's data
- HOA & community: Property is in a rural/suburban community
Exterior
- Parking: Attached garage with 2 garage spaces; Driveway parking; RV access/parking; Boat parking; Total of 2 parking spaces
- Utilities: Public sewer; District/public water; No additional utilities listed
- Home design: House (attached property, end unit with 2+ common walls); One story; Estimated year built
- Construction: Asphalt roof; Concrete slab foundation
- Exterior features: Chain link fencing; No pool
Interior
- Kitchen: No appliances listed
- Bedrooms: Four main-level bedrooms
- Bathrooms: Two full bathrooms
- Heating & cooling: Central heating (furnace); Central cooling
- Interior features: Single-level home (one story); All bedrooms on the main level; Entry at level 1; Main level has 4 bedrooms and 2 bathrooms
- Laundry & utility: Washer hookup; Gas dryer hookup
Neighborhood map
What this means for you Summary
Snapshot
- This is a 4-bed/2.0-bath single-family listed at $185k.
Deal economics
- At list price, monthly cash flow is $79 ($949/yr) — positive.
- The deal already cash-flows at list — no discount required.
- To meet the 1% rule (rent ≥ 1% of price), the offer needs to be $172k (7.1% below list).
- Recommended offer: $172k (7.1% below list) — sets the bar for 1% rule.
- Cap rate 6.8% vs local median 4.6% in Blythe — top-decile yield for the area; either an underpriced asset or a hidden risk that comps aren't pricing in. Stress-test before assuming the spread holds.
Location & tenants
- Location reads 74/100 on livability (#143 in CA, #4,910 nationally) — a middle-class / working-renter tenant base. Strengths: commute A+, housing A+, health & safety A+; Watch: employment D, schools F, amenities F.
- Palo Verde Unified (town): math 20% / reading 34% proficiency, ranked #1,133 of 1,400 in CA (top 81%) — low school quality limits family demand, transient renter base, plan for 1-2y turnover; 64% free/reduced lunch — lower-income household profile, screen leases tightly.
- Market conditions: 189 active listings in the ZIP; 3 comparable units currently listed for rent nearby; rentals leasing fast (median 13d on market — plan ~1-2 weeks tenant-placement turnaround); 9,195 units permitted in Riverside County in 2024 (1,512 in 5+ unit buildings).
Forward outlook
- Local home prices are declining (-3.0%/yr); year-one equity from $1k of loan paydown is wiped out by about $6k of value loss. Plan a longer hold.
- Riverside County population projected at +22% by 2050 — long-run rental-demand tailwind backs the buy-and-hold thesis.
Negotiation context
- It's been on market 43 days — a 3% lower offer ($179k) is reasonable based on typical stale-listing flexibility.
- 2 sale attempts with the ask held roughly flat each time — persistent listings suggest the price (not the market) is what's stuck; bring a comps-based counter.
- Current owner paid $108k; list at $185k implies a 71% gain — meaningful room to come down on a strong offer.
Risks & watch-outs
- Climate carrying-cost: extreme-heat days projected 7→18/yr by 2055 (HVAC capex compounding) — expect insurance premiums to compound above CPI over the hold.
Questions for the listing agent
- It's been on market 43 days. Have you received any prior offers? Is the seller open to a 7% concession, seller financing, or rate buy-down credit?
- Built in 1966 — when were the roof, HVAC, electrical panel, plumbing, and water heater last replaced?
- Is there a deadline driving the sale (1031 exchange, divorce, estate, relocation)? That informs how much negotiation room exists.
- Schools are F-rated, which usually means shorter tenancies and higher turnover. Who's the typical renter profile here, and what's been the actual vacancy rate?
- What's the average days-on-market for RENTAL listings here right now (not sales)? A rising rental-DOM trend means longer vacancies and softer asking-rent achievability than the comps imply.
- What's the recent tenant-quality profile in this submarket — average credit score on applications, eviction rate, late-payment / NSF rate, and stable-employment percentage? A property-management company in the area should have these aggregated.
- How much new for-sale + rental construction is in the pipeline within 1–3 miles? Heavy new supply typically softens prices + rents 12–24 months out; constrained supply supports both.
Investment metrics
- 1% rule
- 0.93% ✗
- Cap rate
- 6.81%
- Cash-on-cash
- 1.83%
- DSCR
- 1.08
- GRM
- 9.0
CMA / ARV
- ARV (median comp)
- $273,744
- List price
- $185,000
- Delta
- -32.42%
- Verdict
- UNDERPRICED
- Comps
- 20 within 1.0 mi
Show comp detail 12 sales within ~0.75 mi
| Address | Dist | Beds/Ba | Sqft | Sold | Price | $/sf | Match |
|---|---|---|---|---|---|---|---|
| 431 N 9th | 0.15mi | 3/2.0 (-1) | 1,636 (-2%) | 6mo | $210,000 | $128 | 80 |
| 340 N 9th | 0.25mi | 4/2.0 | 1,571 (-6%) | 0mo | $241,000 | $153 | 79 |
| 391 N 9th St | 0.20mi | 4/2.0 | 1,571 (-6%) | 5mo | $240,000 | $153 | 77 |
| 586 N 6th St | 0.26mi | 4/2.0 | 1,724 (+4%) | 13mo | $230,000 | $133 | 71 |
| 449 N 7th | 0.25mi | 4/2.0 | 1,524 (-8%) | 6mo | $55,000 | $36 | 70 |
| 610 E Chanslor Way | 0.30mi | 5/2.0 (+1) | 1,745 (+5%) | 4mo | $208,000 | $119 | 70 |
| 943 E Murphy St | 0.43mi | 4/3.0 | 1,599 (-4%) | 9mo | $208,000 | $130 | 62 |
| 418 N 2nd St | 0.54mi | 5/3.0 (+1) | 1,692 (+2%) | 12mo | $230,000 | $136 | 52 |
| 445 N 2md | 0.57mi | 3/2.0 (-1) | 1,750 (+5%) | 12mo | $255,000 | $146 | 50 |
| 158 Eunice Cir | 0.68mi | 3/2.0 (-1) | 1,426 (-14%) | 1mo | $290,000 | $203 | 39 |
| 275 Eunice Cir | 0.60mi | 3/2.0 (-1) | 1,422 (-14%) | 8mo | $259,000 | $182 | 36 |
| 173 Eunice Cir | 0.71mi | 3/2.0 (-1) | 1,422 (-14%) | 5mo | $259,000 | $182 | 34 |
Match score weights: distance 35% · size 25% · config 20% · recency 20%. Top-matched comps best support the ARV.
Projected returns pro-forma
-3.0% appreciation · 3.0% rent growth · sell at horizon
- IRR
- -13.4%
- Equity multiple
- 0.52×
- Total profit
- $-24,917
- Equity at exit
- $27,584
- IRR
- -4.4%
- Equity multiple
- 0.71×
- Total profit
- $-15,109
- Equity at exit
- $15,995
Cash invested: $51,800 (down + closing). Projections, not guarantees.
Landlord ↔ Tenant lean methodology
- Overall (STATE)
- 18 Strongly Tenant-Friendly
- State California
- 18 Strongly Tenant-Friendly · D+13
- County
- — inherits STATE
- City
- — inherits STATE
ZIP-level market 92225
- Home prices YoY
- -15.8%
- Active inventory
- 189
- Price-to-rent
- 9.0×
Monthly cashflow live
- Estimated rent
- $1,718 medium interval (Pro) →
- Mortgage (P&I)
- −$970
- Tax est. 1.5%
- −$231 /mo · $2,775/yr
- Insurance
- −$77
- HOA
- −$0
- Vacancy / Maint / Mgmt
- −$361
- Net cashflow
- $79
Break-even live
UW: 25.0% down · 7.5% · 30yr · 1.5% tax · 5.0% vac · 8.0% maint · 8.0% mgmt
Financing live
Cash to close
- Down payment
- $46,250
- Closing costs
- $5,550
- Reserves months
- —
- Total cash needed
- —
Loan-product check · same deal, 3 products live
Conventional
25% down · 7.5% · 30yr
- Down + closing
- —
- Monthly P&I
- —
- Monthly cashflow
- —
- DSCR
- —
- Eligible?
- —
Personal DTI + credit; lowest rate.
DSCR
20% down · 8.5% · 30yr
- Down + closing
- —
- Monthly P&I
- —
- Monthly cashflow
- —
- DSCR
- —
- Eligible?
- —
No personal income docs; deal must DSCR.
Hard money
10% down · 12.0% · 12mo
- Down + closing
- —
- Monthly P&I
- —
- Monthly cashflow
- —
- DSCR
- —
- Eligible?
- —
Short-term bridge; refi at stabilization.
Rent comps 3 comps
| Address | Beds | Baths | Sqft | Rent | $/sqft | DOM | Units | Dist |
|---|---|---|---|---|---|---|---|---|
| 450 W Barnard St Blythe, CA | 2.0–3.0 | 1.0–2.0 | 935 | $1,095 | $1.17 | 13d | 2 | 1.03mi |
| 400 N Palm Dr Blythe, CA | 2.0–3.0 | 1.0–1.5 | 928 | $1,100 | $1.18 | 13d | 1 | 1.04mi |
| 460 River Valley Ave Blythe, CA | 3.0 | 2.0 | 1344 | $2,600 | $1.93 | 13d | 1 | 1.06mi |
Listing history 20 events
-
2026-06-19days on market $185,000 Active 43 DOM
-
2026-06-18days on market $185,000 Active 42 DOM
-
2026-06-17days on market $185,000 Active 41 DOM
-
2026-06-16days on market $185,000 Active 40 DOM
-
2026-06-15days on market $185,000 Active 39 DOM
-
2026-06-14days on market $185,000 Active 37 DOM
-
2026-06-12days on market $185,000 Active 36 DOM
-
2026-06-09days on market $185,000 Active 33 DOM
-
2026-06-08days on market $185,000 Active 32 DOM
-
2026-06-07days on market $185,000 Active 31 DOM
-
2026-06-07days on market $185,000 Active 30 DOM
-
2026-06-04days on market $185,000 Active 27 DOM
-
2026-06-02days on market $185,000 Active 26 DOM
-
2026-06-01days on market $185,000 Active 25 DOM
-
2026-05-31days on market $185,000 Active 24 DOM
-
2026-05-31days on market $185,000 Active 23 DOM
-
2026-05-07$185,000 Active 894-char remark
-
2025-09-19price
-
2025-08-15Active
-
2002-12-02soldstatus $108,000
ⓘ Source: listings_history table (triggers on properties + properties_extension) + one-shot
backfill from property_details.listing_events for pre-trigger history.
Climate risk First Street
- Flood 1/10 Low FEMA zone D · 0% chance over 30 yrs
- Wildfire 1/10 Low
- Heat 9/10 Extreme 7 d/yr ≥116°F today · 18 d/yr by 30 yrs out
- Wind 1/10 Low
- Air quality 2/10 Low 1 unhealthy d/yr today · 1 by 30 yrs out
Nearby sold comps map
Loading sold comps map…
Walkable amenities ~0.75 mi
Loading nearby amenities…
Taxation est. · year 1
- Rental income
- $20,621
- − Mortgage interest
- −$10,363
- − Property taxes
- −$2,775
- − Insurance
- −$925
- − Repairs & maintenance
- −$1,650
- − Management
- −$1,650
- − Depreciation
- −$5,382
- Taxable loss
- −$2,123
- Est. tax savings @ 24.0%
- +$510
- After-tax cash flow
- $1,458/yr
For passive investors: Depreciation is non-cash, so a rental often shows a tax loss while cash-flowing — sheltering income. Rental losses are passive: they offset passive income freely, and up to $25,000/yr can offset ordinary (W-2) income if you actively participate and your MAGI is under $100k (phasing out to $0 by $150k); unused losses carry forward. On sale, claimed depreciation is recaptured at up to 25%, and gains may owe capital-gains tax (a 1031 exchange can defer both). Figures are a year-1 estimate at your 24.0% rate — not tax advice; consult a CPA.
Schools (NCES district)
- District
- Palo Verde Unified
- NCES district ID
- 0629640
- Math proficiency
- 20% ▲ 3.00%
- Reading proficiency
- 34% ▲ 5.00%
- Median HH income
- $40,808
- Composite
- 25.77/100
- National rank
- #12796
- State rank
- #1133 of 1400 in CA
Livability — Blythe
- Score
- 74/100
- State rank
- #143
- US rank
- #4910
Category grades
Schools grade is shown separately in the Schools card above.
Census & demographics
- Census place
- Blythe, CA
- Population (ZIP)
- 21,101
Population outlook (Riverside County) Hauer SSP2
- Today (2025)
- 2,664,475 people
- By 2030
- 2,802,692 · +5.2%
- By 2040
- 3,050,904 · +14.5%
- By 2050
- 3,256,783 · +22.2%
- By 2075
- 3,655,058 · +37.2%
- By 2100
- 3,766,594 · +41.4%
Race, ethnicity, and origin ACS 2023
- Neighborhood character
- Diverse neighborhood (Simpson 0.58)
- Race & ethnicity
- Hispanic / Latino 59% White 26% Two or more races 13% Black 10% Asian 2% Native American 2%
- Hispanic origin (detail)
- Mexican 54%
- Common ancestry
- Lithuanian 1% Romanian 1% Iranian 1%
- Foreign-born
- 18% · Canada
- Languages at home
- 55% English-only · Spanish 42% Other Indo-European 1% Tagalog/Filipino 0%
Political lean MEDSL · Riverside
- 2024 margin
- Toss-up / Even · D 48.0% · R 49.3% · Other 2.6%
- 2008→2024 swing
- -3.6pp toward R · 2008: 2.3pp · 2024: -1.3pp
- All cycles
- 2024: R+1.3 2020: D+8.0 2016: D+4.3 2012: R+0.4 2008: D+2.3
Not yet ingested
- Civics
- —
Market trends
- HPI YoY
- ▼ -40.53%
- Current HPI
- 215.4794
- Rent YoY
- —
- Metro
- —
- State GDP YoY
- ▲ 3.21%
- F500 in state
- 116
Industry mix (Fortune 500 HQ in CA)
| Industry | F500 HQs | Revenue |
|---|---|---|
| Technology | 27 | $1,492B |
|
||
| Financial Services | 3 | $174B |
|
||
| Retail | 3 | $44B |
|
||
| Insurance | 3 | $26B |
|
||
| Media / Entertainment | 2 | $115B |
|
||
| Pharmaceuticals / Biotech | 2 | $62B |
|
||
Price history
+71.3% since first listed4 events — show timeline
- 2026-05-07 Listed $185,000 CRMLS
- 2025-09-19 Price Changed — TheMLS
- 2025-08-15 Listed — TheMLS
- 2002-12-02 Sold (Public Records) $108,000 Public Records
Property tax history
-13.5%/yrLatest (2025): $117 · -17.0% YoY. Source: county tax records.
Cash-flow waterfall
monthlySold comps — $/sqft
last 12 mo · ≤1 miLoading sold comps…