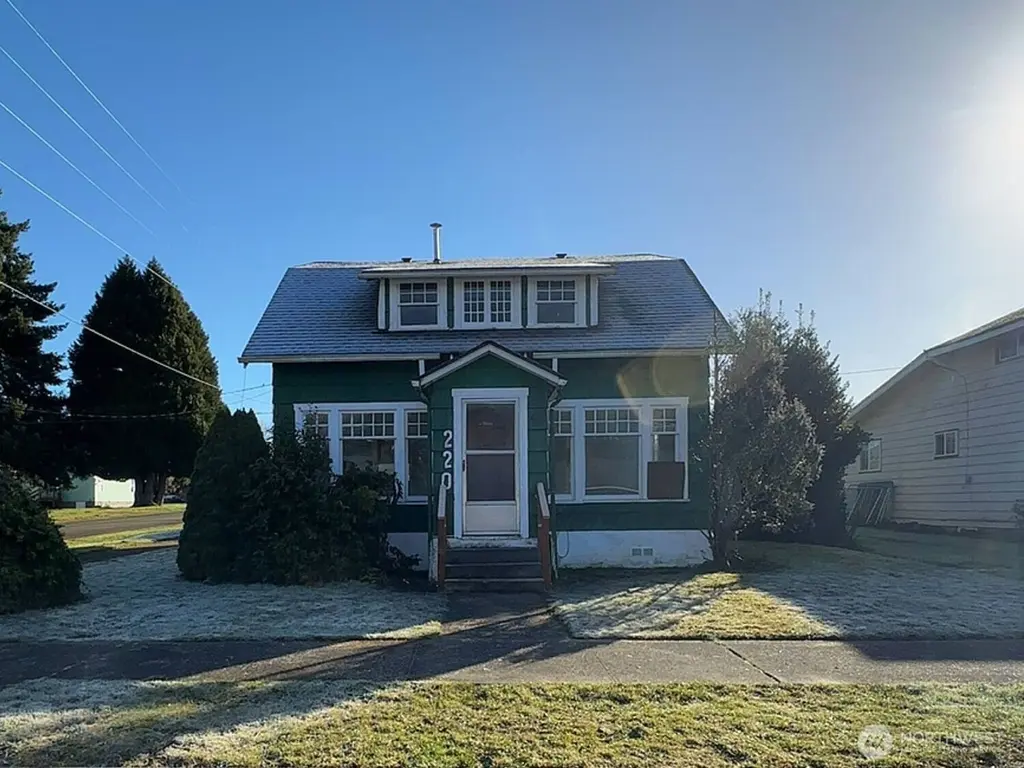
220 N 3rd St · Pe Ell, WA
Flood risk 1/10 · Minimal
- FEMA flood zone
- X
- Chance of flooding over 30 yrs
- 0.0%
- Est. flood insurance / yr
- $507 – $1,088
Fire risk 3/10 · Minor
- Est. fire insurance / yr
- $604 – $1,122
Heat risk 2/10 · Minimal
- Hot days now (above 88°F)
- 8 days/yr
- Hot days in 30 yrs
- 16 days/yr
Wind risk 1/10 · Minimal
- Chance of severe wind over 30 yrs
- —
Air-quality risk 6/10 · Moderate
- Unhealthy air days now
- 7 days/yr
- Unhealthy air days in 30 yrs
- 7 days/yr
Risk factors via First Street. Map © Google.
Why this score? — see what drove the C+ grade
The composite is a weighted blend of 9 inputs, each scored 0–100. Each bar is that input's sub-score; the figure is the points it added to the 100-point composite (weight × sub-score).
- Cash flow +19.6/30.0
- ARV discount +15.0/15.0
- DSCR +6.2/10.0
- Appreciation +6.1/10.0
- 1% rule +5.0/10.0
- Schools +4.6/10.0
- Livability +3.2/5.0
- Rent growth +2.5/5.0
- Condition / age +2.5/5.0
$145,000
🖨 Deal sheet 📄 Offer letter ✓ Due diligence
Listing remarks
Check out this 1925 charmer on a large corner lot! This home offers so much original character and it's just waiting for you to bring it back to life. Inside, you will find 5 bedrooms and 1.75 bathrooms spread out over 1,376 square feet of living space. Featuring original hardwood floors throughout the living room and the ground-floor bedroom. In addition the main floor houses a kitchen with eating space and bathroom. Upstairs, you find four additional bedrooms and a second bathroom accented by a clawfoot tub. Parking and storage is facilitated by a single car detached garage. Step outside to the partially fenced yard with plenty of space for activities. Close to all local amenities so make
Key facts
- Large corner lot
- Clawfoot tub
- 6,098 sq ft lot
Tags
Neighborhood map
What this means for you Summary
Snapshot
- This is a 3-bed/2.0-bath single-family listed at $145k.
Deal economics
- At list price, monthly cash flow is $168 ($2k/yr) — positive.
- The deal already cash-flows at list — no discount required.
- Meets the 1% rule at list price ($1k rent vs $145k).
- Recommended offer: $136k (6.0% below list) — sets the bar for market timing.
Location & tenants
- Location reads 65/100 on livability (#348 in WA) — a middle-class / working-renter tenant base. Strengths: cost of living A+, housing A+, employment A-; Watch: health & safety C-, crime F, amenities F.
- Pe Ell School District (rural): math 45% / reading 60% proficiency, ranked #133 of 291 in WA (top 46%) — acceptable for families but not a draw, mixed tenant base, ~2y average lease.
- Market conditions: 15 active listings in the ZIP; 265 units permitted in Lewis County in 2024 (44 in 5+ unit buildings).
Forward outlook
- In year one you build about $4k of equity ($1k loan paydown + $3k appreciation (2.3% local appreciation)).
- Lewis County population projected at -11% by 2050 — secular population decline; favor cash flow + early exit over multi-decade hold.
- At projected returns (2.3% appreciation + 3.0% rent growth), your $41k cash investment doubles in ~6 years — after that, you're playing with house money.
- By year 8, paydown + projected appreciation supports a ~$32k cash-out refi (75% LTV) — recoverable capital for the next deal without selling this one.
Negotiation context
- It's been on market 73 days — a 6% lower offer ($136k) is reasonable based on typical stale-listing flexibility.
- 4 sale attempts since 5y ago; this cycle's ask has dropped $20k (12%) from the opening price — seller is motivated, your offer sets the floor, not the list.
Risks & watch-outs
- Watch-outs: built in 1925 — expect roof / HVAC / electrical / plumbing capex.
Questions for the listing agent
- It's been on market 73 days. Have you received any prior offers? Is the seller open to a 6% concession, seller financing, or rate buy-down credit?
- Built in 1925 — when were the roof, HVAC, electrical panel, plumbing, and water heater last replaced?
- Why hasn't it sold? Are there any deal-killer items the seller is aware of (foundation, flood, title, zoning, code violations)?
- Is there a deadline driving the sale (1031 exchange, divorce, estate, relocation)? That informs how much negotiation room exists.
- Schools are B-rated — typically a magnet for longer-tenancy family renters. What's the average tenant stay here, and is there a school-zone premium baked into asking?
- Crime grade is F in this area — have there been break-ins, vandalism, or insurance claims at this property in the last 3 years? What carrier currently insures it and at what premium?
- What's the average days-on-market for RENTAL listings here right now (not sales)? A rising rental-DOM trend means longer vacancies and softer asking-rent achievability than the comps imply.
- What's the recent tenant-quality profile in this submarket — average credit score on applications, eviction rate, late-payment / NSF rate, and stable-employment percentage? A property-management company in the area should have these aggregated.
- How much new for-sale + rental construction is in the pipeline within 1–3 miles? Heavy new supply typically softens prices + rents 12–24 months out; constrained supply supports both.
Investment metrics
- 1% rule
- 1.00% ✓
- Cap rate
- 7.68%
- Cash-on-cash
- 4.96%
- DSCR
- 1.22
- GRM
- 8.3
CMA / ARV
- ARV (on-the-fly)
- $276,576
- Comps found
- 6
Show comp detail 6 sales within ~0.75 mi
| Address | Dist | Beds/Ba | Sqft | Sold | Price | $/sf | Match |
|---|---|---|---|---|---|---|---|
| 303 N 2nd St | 0.04mi | 3/1.0 | 1,362 (-1%) | 10mo | $339,900 | $250 | 84 |
| 316 W 4th Ave | 0.10mi | 3/2.0 | 1,416 (+3%) | 14mo | $285,000 | $201 | 78 |
| 217 E Pe Ell Ave | 0.24mi | 3/1.0 | 1,372 (-0%) | 8mo | $255,000 | $186 | 78 |
| 204 Chehalis Ave | 0.16mi | 3/1.0 | 1,464 (+6%) | 6mo | $279,000 | $191 | 73 |
| 503 E Pe Ell Ave | 0.42mi | 3/1.0 | 1,560 (+13%) | 1mo | $217,000 | $139 | 54 |
| 415 E Pe Ell Ave | 0.39mi | 2/1.5 (-1) | 1,563 (+14%) | 14mo | $325,000 | $208 | 40 |
Match score weights: distance 35% · size 25% · config 20% · recency 20%. Top-matched comps best support the ARV.
Projected returns pro-forma
2.3% appreciation · 3.0% rent growth · sell at horizon
- IRR
- 10.2%
- Equity multiple
- 1.56×
- Total profit
- $22,855
- Equity at exit
- $59,555
- IRR
- 13.0%
- Equity multiple
- 2.80×
- Total profit
- $73,221
- Equity at exit
- $87,613
Cash invested: $40,600 (down + closing). Projections, not guarantees.
Landlord ↔ Tenant lean methodology
- Overall (STATE)
- 28 Tenant-Leaning
- State Washington
- 28 Tenant-Leaning · D+8
- County
- — inherits STATE
- City
- — inherits STATE
ZIP-level market 98572
- Home prices YoY
- 0.9%
- Active inventory
- 15
- Price-to-rent
- 8.3×
Monthly cashflow live
- Estimated rent
- $1,457 medium interval (Pro) →
- Mortgage (P&I)
- −$760
- Tax from tax record
- −$163 /mo · $1,952/yr
- Insurance
- −$60
- HOA
- −$0
- Vacancy / Maint / Mgmt
- −$306
- Net cashflow
- $168
Break-even live
UW: 25.0% down · 7.5% · 30yr · 1.5% tax · 5.0% vac · 8.0% maint · 8.0% mgmt
Financing live
Cash to close
- Down payment
- $36,250
- Closing costs
- $4,350
- Reserves months
- —
- Total cash needed
- —
Loan-product check · same deal, 3 products live
Conventional
25% down · 7.5% · 30yr
- Down + closing
- —
- Monthly P&I
- —
- Monthly cashflow
- —
- DSCR
- —
- Eligible?
- —
Personal DTI + credit; lowest rate.
DSCR
20% down · 8.5% · 30yr
- Down + closing
- —
- Monthly P&I
- —
- Monthly cashflow
- —
- DSCR
- —
- Eligible?
- —
No personal income docs; deal must DSCR.
Hard money
10% down · 12.0% · 12mo
- Down + closing
- —
- Monthly P&I
- —
- Monthly cashflow
- —
- DSCR
- —
- Eligible?
- —
Short-term bridge; refi at stabilization.
Listing history 14 events
-
2026-05-18price $145,000
-
2026-04-17price $155,000
-
2026-03-15$165,000 Active
-
2023-04-07soldstatus $270,000 Closed
-
2023-02-28status Pending
-
2023-02-03price $265,000
-
2022-12-30price $275,000
-
2022-08-05status Active Under Contract
-
2022-08-04status Pending
-
2022-03-10status Active
-
2022-02-07status Pending
-
2022-01-26price $279,000
-
2021-10-02price $289,000
-
2021-07-06$299,000 Active
ⓘ Source: listings_history table (triggers on properties + properties_extension) + one-shot
backfill from property_details.listing_events for pre-trigger history.
Tax reassessment forecast WA · Resets to sale price
- Current annual tax
- $1,952 · $163/mo
- Projected year-2 tax
- $1,952 · $163/mo
- Expected delta
- $0/yr ($0/mo · 0.0%)
ⓘ Screening estimate from a state-policy table — verify with the county assessor before closing.
Climate risk First Street
- Flood 1/10 Low FEMA zone X · 0% chance over 30 yrs
- Wildfire 3/10 Moderate
- Heat 2/10 Low 8 d/yr ≥88°F today · 16 d/yr by 30 yrs out
- Wind 1/10 Low
- Air quality 6/10 Major 7 unhealthy d/yr today · 7 by 30 yrs out
Nearby sold comps map
Loading sold comps map…
Walkable amenities ~0.75 mi
Loading nearby amenities…
Taxation est. · year 1
- Rental income
- $17,486
- − Mortgage interest
- −$8,122
- − Property taxes
- −$1,952
- − Insurance
- −$725
- − Repairs & maintenance
- −$1,399
- − Management
- −$1,399
- − Depreciation
- −$4,218
- Taxable loss
- −$329
- Est. tax savings @ 24.0%
- +$79
- After-tax cash flow
- $2,092/yr
For passive investors: Depreciation is non-cash, so a rental often shows a tax loss while cash-flowing — sheltering income. Rental losses are passive: they offset passive income freely, and up to $25,000/yr can offset ordinary (W-2) income if you actively participate and your MAGI is under $100k (phasing out to $0 by $150k); unused losses carry forward. On sale, claimed depreciation is recaptured at up to 25%, and gains may owe capital-gains tax (a 1031 exchange can defer both). Figures are a year-1 estimate at your 24.0% rate — not tax advice; consult a CPA.
Schools (NCES district)
- District
- Pe Ell School District
- NCES district ID
- 5306660
- Math proficiency
- 45% ▬ 0.00%
- Reading proficiency
- 60% ▬ 0.00%
- Median HH income
- $45,419
- Composite
- 46.3/100
- National rank
- #5395
- State rank
- #133 of 291 in WA
Livability — Pe Ell
- Score
- 65/100
- State rank
- #348
- US rank
- #13198
Category grades
Schools grade is shown separately in the Schools card above.
Census & demographics
- Census place
- Pe Ell, WA
- Population (ZIP)
- 806
Population outlook (Lewis County) Hauer SSP2
- Today (2025)
- 75,749 people
- By 2030
- 74,647 · -1.5%
- By 2040
- 71,310 · -5.9%
- By 2050
- 67,748 · -10.6%
- By 2075
- 59,829 · -21.0%
- By 2100
- 52,293 · -31.0%
Race, ethnicity, and origin ACS 2023
- Neighborhood character
- Predominantly White (87%)
- Race & ethnicity
- White 87% Hispanic / Latino 8% Two or more races 8%
- Hispanic origin (detail)
- Mexican 6%
- Common ancestry
- Romanian 20% Portuguese 5% Lithuanian 3%
- Foreign-born
- 1% · Canada, Jamaica
- Languages at home
- 98% English-only · Spanish 2%
Political lean MEDSL · Lewis
- 2024 margin
- Solid R (+33.0) · D 32.0% · R 65.0% · Other 3.0%
- 2008→2024 swing
- -13.8pp toward R · 2008: -19.2pp · 2024: -33.0pp
- All cycles
- 2024: R+33.0 2020: R+32.8 2016: R+36.2 2012: R+23.5 2008: R+19.2
Not yet ingested
- Civics
- —
Market trends
- HPI YoY
- ▲ 2.30%
- Current HPI
- 243.7525
- Rent YoY
- —
- Metro
- —
- State GDP YoY
- ▲ 4.65%
- F500 in state
- 22
Industry mix (Fortune 500 HQ in WA)
| Industry | F500 HQs | Revenue |
|---|---|---|
| Retail | 2 | $269B |
|
||
| Technology / Retail | 1 | $638B |
|
||
| Technology | 1 | $245B |
|
||
| Telecommunications | 1 | $38B |
|
||
| Food / Beverage | 1 | $36B |
|
||
| Automotive / Trucks | 1 | $34B |
|
||
Price history
-51.5% since first listed14 events — show timeline
- 2026-05-18 Price Changed $145,000 NWMLS as Distributed by MLS Grid
- 2026-04-17 Price Changed $155,000 NWMLS as Distributed by MLS Grid
- 2026-03-15 Listed $165,000 NWMLS as Distributed by MLS Grid
- 2023-04-07 Sold (MLS) $270,000 NWMLS as Distributed by MLS Grid
- 2023-02-28 Pending — NWMLS as Distributed by MLS Grid
- 2023-02-03 Price Changed $265,000 NWMLS as Distributed by MLS Grid
- 2022-12-30 Price Changed $275,000 NWMLS as Distributed by MLS Grid
- 2022-08-05 Relisted — NWMLS as Distributed by MLS Grid
- 2022-08-04 Pending — NWMLS as Distributed by MLS Grid
- 2022-03-10 Relisted — NWMLS as Distributed by MLS Grid
- 2022-02-07 Pending — NWMLS as Distributed by MLS Grid
- 2022-01-26 Price Changed $279,000 NWMLS as Distributed by MLS Grid
- 2021-10-02 Price Changed $289,000 NWMLS as Distributed by MLS Grid
- 2021-07-06 Listed $299,000 NWMLS as Distributed by MLS Grid
Property tax history
+4.6%/yrLatest (2026): $1,952 · +5.8% YoY. Source: county tax records.
Cash-flow waterfall
monthlySold comps — $/sqft
last 12 mo · ≤1 miLoading sold comps…