 Duplex
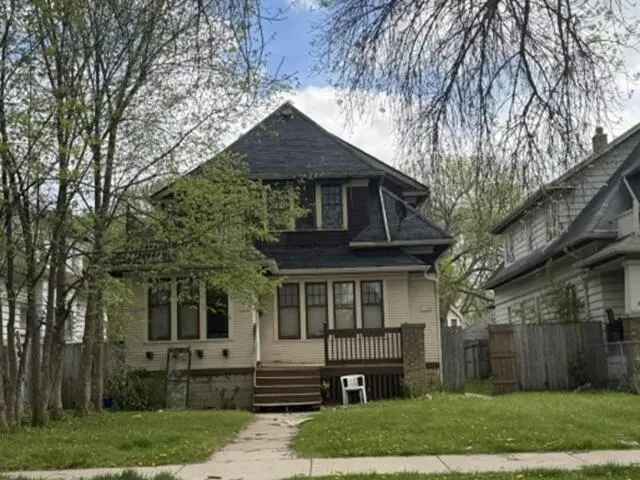
3530 N 39th St · Milwaukee, WI
Flood risk 1/10 · Minimal
- FEMA flood zone
- X (unshaded)
- Chance of flooding over 30 yrs
- 0.0%
- Est. flood insurance / yr
- $473 – $860
Fire risk 1/10 · Minimal
- Est. fire insurance / yr
- $636 – $1,182
Heat risk 2/10 · Minimal
- Hot days now (above 98°F)
- 7 days/yr
- Hot days in 30 yrs
- 13 days/yr
Wind risk 2/10 · Minimal
- Chance of severe wind over 30 yrs
- —
Air-quality risk 2/10 · Minimal
- Unhealthy air days now
- 2 days/yr
- Unhealthy air days in 30 yrs
- 2 days/yr
Risk factors via First Street. Map © Google.
Why this score? — see what drove the A- grade
The composite is a weighted blend of 9 inputs, each scored 0–100. Each bar is that input's sub-score; the figure is the points it added to the 100-point composite (weight × sub-score).
- Cash flow +30.0/30.0
- ARV discount +15.0/15.0
- 1% rule +10.0/10.0
- DSCR +10.0/10.0
- Appreciation +5.7/10.0
- Rent growth +4.3/5.0
- Livability +4.0/5.0
- Condition / age +2.5/5.0
- Schools +1.2/10.0
$78,000
🖨 Deal sheet 📄 Offer letter ✓ Due diligence
Multi-family units
County records classify this as Multi-Family (2-4 Unit). Listing-text estimate: 2 units. confirmed
Listing remarks
Built in 1928, this 2-unit duplex offers a total of approximately 2143 finished square feet, total of four bedrooms and two full baths, unfinished basement and detached two car garage. This property sits on an approximate 5740 sqft lot. Exterior defects observed are paint for wood trim and new roof for house and garage.
Key facts
- 5,662 sq ft lot
- 2 garage spots
- Built 1928
Property features AI
Exterior
- Parking: Detached 2-car garage; One additional parking space
- Utilities: Municipal water; Municipal sewer
- Home design: Two-story duplex (multi-family, 2 units)
- Construction: Information sourced from assessor/public record
- Exterior features: Other exterior; Lot size about 0.13 acre; Zoned RT2 (two-family)
Interior
- Kitchen: Upper-level kitchen in one unit (approx. 10 x 10)
- Bedrooms: Two 2-bedroom units (one unit has an upper-level master bedroom)
- Bathrooms: Each unit has one full bathroom
- Interior features: Partial basement
Neighborhood map
What this means for you Summary
Snapshot
- This is a 2 × 2-bed/1.0-bath units multifamily listed at $78k.
Deal economics
- At list price, monthly cash flow is $1k ($15k/yr) — positive. Per door: $611/mo.
- The deal already cash-flows at list — no discount required.
- Meets the 1% rule at list price ($2k rent vs $78k).
- Recommended offer: $77k (1.5% below list) — sets the bar for market timing.
- Cap rate 25.1% vs local median 5.1% in Milwaukee — top-decile yield for the area; either an underpriced asset or a hidden risk that comps aren't pricing in. Stress-test before assuming the spread holds.
Location & tenants
- Location reads 81/100 on livability (#55 in WI, #1,534 nationally) — a professional / high-income tenant draw. Strengths: amenities A+, commute A+, cost of living A+; Watch: employment D+, schools F, crime F.
- Milwaukee School District (urban): math 10% / reading 18% proficiency, ranked #337 of 342 in WI (top 98%) — low school quality limits family demand, transient renter base, plan for 1-2y turnover; 77% free/reduced lunch — lower-income household profile, screen leases tightly.
- Market conditions: Rents rising fast (+7.0%/yr); 126 active listings in the ZIP; 6 comparable units currently listed for rent nearby; rentals at typical pace (median 24d on market — plan ~3-4 weeks tenant-placement turnaround); 1,017 units permitted in Milwaukee County in 2024 (803 in 5+ unit buildings).
- At $2,228/mo this rent would consume 57% of the median local household income ($47k/yr) (locally 2202% of renters already pay >50% of income on rent) — very limited rent-growth headroom before tenants either downsize or default.
Forward outlook
- In year one you build about $2k of equity ($539 loan paydown + $1k appreciation (1.3% local appreciation)).
- Milwaukee County population projected at +4% by 2050 — modest demand growth; plan on rents tracking national, not racing it.
- At projected returns (1.3% appreciation + 7.0% rent growth), your $22k cash investment doubles in ~2 years — after that, you're playing with house money.
Negotiation context
- It's been on market 20 days — a 2% lower offer ($77k) is reasonable based on typical stale-listing flexibility.
- Current owner paid $52k; list at $78k implies a 51% gain — meaningful room to come down on a strong offer.
Risks & watch-outs
- Watch-outs: built in 1928 — expect roof / HVAC / electrical / plumbing capex.
Questions for the listing agent
- Can we see the unit-by-unit rent roll, current vacancy, and any below-market leases? What's the average tenancy length?
- What capital expenditures (roof, boiler, parking lot, exteriors) have been made in the last 5 years, and what's planned in the next 2?
- Built in 1928 — when were the roof, HVAC, electrical panel, plumbing, and water heater last replaced?
- Is there a deadline driving the sale (1031 exchange, divorce, estate, relocation)? That informs how much negotiation room exists.
- Schools are F-rated, which usually means shorter tenancies and higher turnover. Who's the typical renter profile here, and what's been the actual vacancy rate?
- Crime grade is F in this area — have there been break-ins, vandalism, or insurance claims at this property in the last 3 years? What carrier currently insures it and at what premium?
- What's the average days-on-market for RENTAL listings here right now (not sales)? A rising rental-DOM trend means longer vacancies and softer asking-rent achievability than the comps imply.
- What's the recent tenant-quality profile in this submarket — average credit score on applications, eviction rate, late-payment / NSF rate, and stable-employment percentage? A property-management company in the area should have these aggregated.
- How much new apartment / multifamily construction is in the pipeline within 1–3 miles? Heavy new supply (>2% of stock underway) typically softens rents 12–24 months out; light construction supports rent growth.
Investment metrics
- 1% rule
- 2.86% ✓
- Cap rate
- 25.08%
- Cash-on-cash
- 67.09%
- DSCR
- 3.99
- GRM
- 2.9
CMA / ARV
- ARV (on-the-fly)
- $150,010
- Comps found
- 12
Show comp detail 12 sales within ~0.75 mi
| Address | Dist | Beds/Ba | Sqft | Sold | Price | $/sf | Match |
|---|---|---|---|---|---|---|---|
| 4228 W Auer Ave #4230 | 0.48mi | 4/2.0 | 2,148 (+0%) | 5mo | $106,000 | $49 | 73 |
| 4049 N Elmhurst Rd #4051 | 0.52mi | 4/2.0 | 2,122 (-1%) | 2mo | $170,000 | $80 | 72 |
| 3625 W Capitol Dr | 0.46mi | 4/2.0 | 2,100 (-2%) | 5mo | $165,000 | $79 | 71 |
| 3166 N 39th St #3168 | 0.45mi | 4/2.0 | 2,064 (-4%) | 2mo | $145,000 | $70 | 71 |
| 3148 N 39th St #3150 | 0.48mi | 4/2.0 | 2,044 (-5%) | 2mo | $128,888 | $63 | 68 |
| 2916 W Melvina St | 0.67mi | 4/2.0 | 2,184 (+2%) | 6mo | $88,250 | $40 | 60 |
| 3068 N 34th St Unit 3068A | 0.65mi | 5/2.0 (+1) | 2,087 (-3%) | 0mo | $110,000 | $53 | 60 |
| 3024 N 44th St | 0.72mi | 4/2.0 | 1,998 (-7%) | 1mo | $120,775 | $60 | 54 |
| 3925 N 40th St #3927 | 0.38mi | 4/2.0 | 2,443 (+14%) | 7mo | $229,000 | $94 | 54 |
| 2954 N 37th St #2956 | 0.73mi | 4/2.0 | 2,296 (+7%) | 7mo | $65,000 | $28 | 48 |
| 3373 N 47th St #3375 | 0.58mi | 4/2.0 | 1,840 (-14%) | 4mo | $192,000 | $104 | 46 |
| 3719 N 50th St Unit 3719A | 0.73mi | 3/2.0 (-1) | 1,822 (-15%) | 7mo | $175,000 | $96 | 30 |
Match score weights: distance 35% · size 25% · config 20% · recency 20%. Top-matched comps best support the ARV.
Projected returns pro-forma
1.33% appreciation · 7.01% rent growth · sell at horizon
- IRR
- 74.4%
- Equity multiple
- 5.12×
- Total profit
- $89,876
- Equity at exit
- $27,969
- IRR
- 76.4%
- Equity multiple
- 11.83×
- Total profit
- $236,447
- Equity at exit
- $38,228
Cash invested: $21,840 (down + closing). Projections, not guarantees.
Landlord ↔ Tenant lean methodology
- Overall (STATE)
- 73 Landlord-Friendly
- State Wisconsin
- 73 Landlord-Friendly · R+2
- County
- — inherits STATE
- City
- — inherits STATE
ZIP-level market 53216
- Home prices YoY
- 0.3%
- Rents YoY
- 7.0%
- Active inventory
- 126
- Price-to-rent
- 5.8×
Monthly cashflow live
- Estimated rent
- $2,228 high interval (Pro) →
- Mortgage (P&I)
- −$409
- Tax est. 1.5%
- −$98 /mo · $1,170/yr
- Insurance
- −$32
- HOA
- −$0
- Vacancy / Maint / Mgmt
- −$468
- Net cashflow
- $1,221
Break-even live
2-unit breakdown (identical units grouped — click to expand)
| Units | Beds | Baths | Est. rent |
|---|---|---|---|
| 2× units | 2 | 1 | $2,228 |
| #1 | 2 | 1 | $1,114 |
| #2 | 2 | 1 | $1,114 |
| Total (2 units) | $2,228 | ||
UW: 25.0% down · 7.5% · 30yr · 1.5% tax · 5.0% vac · 8.0% maint · 8.0% mgmt
Financing live
Cash to close
- Down payment
- $19,500
- Closing costs
- $2,340
- Reserves months
- —
- Total cash needed
- —
Loan-product check · same deal, 3 products live
Conventional
25% down · 7.5% · 30yr
- Down + closing
- —
- Monthly P&I
- —
- Monthly cashflow
- —
- DSCR
- —
- Eligible?
- —
Personal DTI + credit; lowest rate.
DSCR
20% down · 8.5% · 30yr
- Down + closing
- —
- Monthly P&I
- —
- Monthly cashflow
- —
- DSCR
- —
- Eligible?
- —
No personal income docs; deal must DSCR.
Hard money
10% down · 12.0% · 12mo
- Down + closing
- —
- Monthly P&I
- —
- Monthly cashflow
- —
- DSCR
- —
- Eligible?
- —
Short-term bridge; refi at stabilization.
Rent comps 6 comps
| Address | Beds | Baths | Sqft | Rent | $/sqft | DOM | Units | Dist |
|---|---|---|---|---|---|---|---|---|
| 3123 N 42nd St Milwaukee, WI | 4.0 | 1.0 | 1500 | $1,700 | $1.13 | 23d | 1 | 0.54mi |
| 2704 W Concordia Ave Unit Na Milwaukee, WI | 5.0 | 2.0 | 1856 | $2,500 | $1.35 | 23d | 1 | 0.78mi |
| 2976 N 49th St Milwaukee, WI | 3.0 | 1.0 | 1700 | $1,300 | $0.76 | 16d | 1 | 0.92mi |
| 2713 N 44th St Milwaukee, WI | 3.0 | 1.0 | 1450 | $1,350 | $0.93 | 43d | 1 | 1.08mi |
| 2116 W Atkinson Ave Unit A Milwaukee, WI | 4.0 | 1.0 | 1707 | $2,000 | $1.17 | 1d | 1 | 1.33mi |
| 2809 W Clarke St Unit 12811 Milwaukee, WI | 3.0 | 1.0 | 1400 | $1,200 | $0.86 | 16d | 1 | 1.35mi |
Listing history 10 events
-
2026-06-08statusdays on market $78,000 Pending 20 DOM
-
2026-06-07days on market $78,000 Active 19 DOM
-
2026-06-05days on market $78,000 Active 16 DOM
-
2026-06-03days on market $78,000 Active 15 DOM
-
2026-06-02days on market $78,000 Active 14 DOM
-
2026-06-01days on market $78,000 Active 13 DOM
-
2026-05-31days on market $78,000 Active 12 DOM
-
2026-05-19$78,000 Active
-
1999-05-19soldstatus $51,500
-
1985-10-01soldstatus $42,000
ⓘ Source: listings_history table (triggers on properties + properties_extension) + one-shot
backfill from property_details.listing_events for pre-trigger history.
Climate risk First Street
- Flood 1/10 Low FEMA zone X (unshaded) · 0% chance over 30 yrs
- Wildfire 1/10 Low
- Heat 2/10 Low 7 d/yr ≥98°F today · 13 d/yr by 30 yrs out
- Wind 2/10 Low
- Air quality 2/10 Low 2 unhealthy d/yr today · 2 by 30 yrs out
Nearby sold comps map
Loading sold comps map…
Walkable amenities ~0.75 mi
Loading nearby amenities…
Taxation est. · year 1
- Rental income
- $26,736
- − Mortgage interest
- −$4,369
- − Property taxes
- −$1,170
- − Insurance
- −$390
- − Repairs & maintenance
- −$2,139
- − Management
- −$2,139
- − Depreciation
- −$2,269
- Taxable income
- $14,260
- Est. tax owed @ 24.0%
- −$3,422
- After-tax cash flow
- $11,231/yr
For passive investors: Depreciation is non-cash, so a rental often shows a tax loss while cash-flowing — sheltering income. Rental losses are passive: they offset passive income freely, and up to $25,000/yr can offset ordinary (W-2) income if you actively participate and your MAGI is under $100k (phasing out to $0 by $150k); unused losses carry forward. On sale, claimed depreciation is recaptured at up to 25%, and gains may owe capital-gains tax (a 1031 exchange can defer both). Figures are a year-1 estimate at your 24.0% rate — not tax advice; consult a CPA.
Schools (NCES district)
- District
- Milwaukee School District
- NCES district ID
- 5509600
- Math proficiency
- 10% ▼ -5.00%
- Reading proficiency
- 18% ▬ 0.00%
- Median HH income
- $36,339
- Composite
- 11.61/100
- National rank
- #9696
- State rank
- #337 of 342 in WI
Livability — Milwaukee
- Score
- 81/100
- State rank
- #55
- US rank
- #1534
Category grades
Schools grade is shown separately in the Schools card above.
Census & demographics
- Census place
- Milwaukee, WI
- County
- Milwaukee County · 926,379 people
- City population
- 573,768
- Metro
- Milwaukee-Waukesha, WI
- Population (ZIP)
- 30,345
- Household income
- $46,752
- Rent vs Own
- Severe rent burden
- 2202.0
Population outlook (Milwaukee County) Hauer SSP2
- Today (2025)
- 995,758 people
- By 2030
- 1,009,124 · +1.3%
- By 2040
- 1,028,128 · +3.3%
- By 2050
- 1,040,066 · +4.4%
- By 2075
- 1,057,849 · +6.2%
- By 2100
- 1,039,774 · +4.4%
Race, ethnicity, and origin ACS 2023
- Neighborhood character
- Predominantly Black (81%)
- Race & ethnicity
- Black 81% White 9% Hispanic / Latino 5% Two or more races 5% Asian 3%
- Hispanic origin (detail)
- Mexican 2% Puerto Rican 3%
- Common ancestry
- Romanian 1%
- Foreign-born
- 3% · Canada, Philippines, China
- Languages at home
- 93% English-only · Spanish 4% Other Asian/Pacific 2%
Political lean MEDSL · Milwaukee
- 2024 margin
- Solid D (+38.5) · D 68.3% · R 29.8% · Other 1.8%
- 2008→2024 swing
- +2.7pp toward D · 2008: 35.9pp · 2024: 38.5pp
- All cycles
- 2024: D+38.5 2020: D+39.9 2016: D+37.5 2012: D+34.6 2008: D+35.9
Not yet ingested
- Civics
- —
Market trends
- HPI YoY
- ▲ 1.33%
- Current HPI
- 381.0954
- Rent YoY
- ▲ 7.01%
- Metro
- Milwaukee-Waukesha, WI
- State GDP YoY
- ▲ 2.10%
- F500 in state
- 20
Industry mix (Fortune 500 HQ in WI)
| Industry | F500 HQs | Revenue |
|---|---|---|
| Industrial Machinery | 4 | $23B |
|
||
| Industrial Technology | 2 | $36B |
|
||
| Insurance | 1 | $36B |
|
||
| Professional Services | 1 | $19B |
|
||
| Utilities | 1 | $9B |
|
||
| Consumer Goods | 1 | $3B |
|
||
Price history
+85.7% since first listed3 events — show timeline
- 2026-05-19 Listed $78,000 METROMLS
- 1999-05-19 Sold (Public Records) $51,500 Public Records
- 1985-10-01 Sold (Public Records) $42,000 Public Records
Property tax history
+2.4%/yrLatest (2024): $4,000 · +15.8% YoY. Source: county tax records.
Cash-flow waterfall
monthlySold comps — $/sqft
last 12 mo · ≤1 miLoading sold comps…