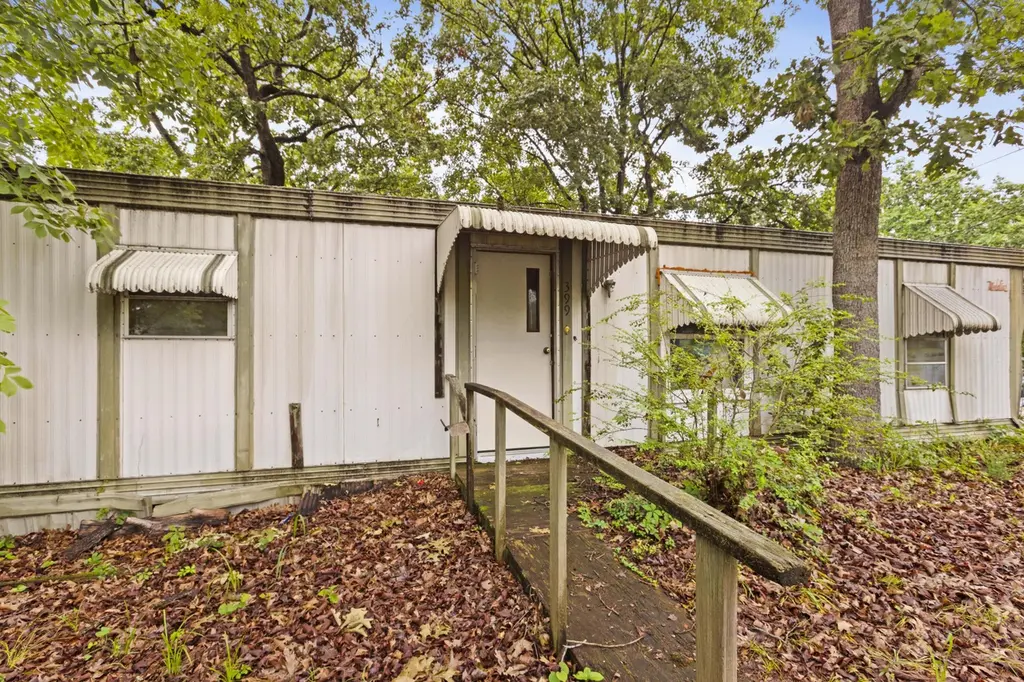
399 Laurel St · Hollister, MO
Flood risk 1/10 · Minimal
- FEMA flood zone
- X (unshaded)
- Chance of flooding over 30 yrs
- 0.0%
- Est. flood insurance / yr
- $473 – $860
Fire risk 3/10 · Minor
- Est. fire insurance / yr
- $1,054 – $1,958
Heat risk 5/10 · Moderate
- Hot days now (above 106°F)
- 7 days/yr
- Hot days in 30 yrs
- 19 days/yr
Wind risk 2/10 · Minimal
- Chance of severe wind over 30 yrs
- 1.0%
Air-quality risk 1/10 · Minimal
- Unhealthy air days now
- 0 days/yr
- Unhealthy air days in 30 yrs
- 0 days/yr
Risk factors via First Street. Map © Google.
Why this score? — see what drove the B- grade
The composite is a weighted blend of 9 inputs, each scored 0–100. Each bar is that input's sub-score; the figure is the points it added to the 100-point composite (weight × sub-score).
- Cash flow +30.0/30.0
- DSCR +10.0/10.0
- 1% rule +8.1/10.0
- ARV discount +7.5/15.0
- Schools +3.7/10.0
- Livability +3.6/5.0
- Rent growth +2.5/5.0
- Condition / age +2.5/5.0
- Appreciation +0.0/10.0
$65,500
🖨 Deal sheet 📄 Offer letter ✓ Due diligence
Listing remarks
Great location just minutes to Branson Landing! Handyman Special that needs some work but has great potential for the price. Home is split bedroom with open living and kitchen area, plus an additional add on room which could serve as a 3rd bedroom. Primary Bedroom also has 1/2 bath. Lot has additional parking pad and storage shed, with flat fenced front yard area great for kids and pets. Deck off of covered parking area overlooks large back yard, and lot is surrounded on 3 sides by street for easy access. Additional Parking Pad perfect for RV. Easy to show, so make your appointment today!
Key facts
- Large back yard
- 0.32 acre lot
- Garage
Tags
Property features AI
Exterior
- Parking: 1-car garage; Driveway; Covered parking; RV access/parking
- Utilities: Public water; Public sewer
- Home design: Mobile home (residential); One level
- Construction: 940 above-grade finished area
- Exterior features: Deck; Chain link fencing; Corner lot; Public-maintained asphalt city street frontage; 137 x 100 lot (0.32 acres); Shed(s)
Interior
- Kitchen: Dishwasher
- Bathrooms: 1 full bathroom; 1 half bathroom
- Heating & cooling: Central heating; Electric heating; Wall furnace; Window unit cooling
- Interior features: Dishwasher
Neighborhood map
What this means for you Summary
Snapshot
- This is a 2-bed/1.5-bath other listed at $66k.
Deal economics
- At list price, monthly cash flow is $290 ($3k/yr) — positive.
- The deal already cash-flows at list — no discount required.
- Meets the 1% rule at list price ($858 rent vs $66k).
- Cap rate 11.6% vs local median 2.5% in Hollister — top-decile yield for the area; either an underpriced asset or a hidden risk that comps aren't pricing in. Stress-test before assuming the spread holds.
Location & tenants
- Location reads 71/100 on livability (#109 in MO) — a middle-class / working-renter tenant base. Strengths: cost of living A+, housing A+, health & safety A+; Watch: amenities F, commute F, employment D-.
- Hollister R-V (town): math 40% / reading 49% proficiency, ranked #108 of 324 in MO (top 33%) — families likely to look elsewhere, expect single-tenant / working-renter base with shorter leases.
- Zoned schools: Hollister Elem. (math 43% / reading 50%, grade D-, #397 of 1,115 statewide, top 36%, 406 students, 66% FRL); Hollister Middle (math 35% / reading 44%, grade F, #189 of 391 statewide, top 51%, 291 students, 67% FRL); Hollister High (math 42% / reading 57%, grade D, #124 of 521 statewide, top 28%, 447 students, 54% FRL) — zoned schools at 62% FRL track the district average.
- Market conditions: 278 active listings in the ZIP; 3 comparable units currently listed for rent nearby; rentals lingering (median 44d on market — plan ~5-8 weeks vacancy on turnover, expect pricing pressure); 100% of comp listings sitting > 30 days — soft ceiling on asking rent; 331 units permitted in Taney County in 2024 (50 in 5+ unit buildings).
Forward outlook
- Local home prices are declining (-3.0%/yr); year-one equity from $453 of loan paydown is wiped out by about $2k of value loss. Plan a longer hold.
- Taney County population projected at +17% by 2050 — long-run rental-demand tailwind backs the buy-and-hold thesis.
- At projected returns (-3.0% appreciation + 3.0% rent growth), your $18k cash investment doubles in ~7 years — after that, you're playing with house money.
Negotiation context
- Only 9 days on market — expect competitive offers; lowballing is unlikely to land.
Risks & watch-outs
- Climate carrying-cost: extreme-heat days projected 7→19/yr by 2055 (HVAC capex compounding) — expect insurance premiums to compound above CPI over the hold.
Questions for the listing agent
- Built in 1974 — when were the roof, HVAC, electrical panel, plumbing, and water heater last replaced?
- Is there a deadline driving the sale (1031 exchange, divorce, estate, relocation)? That informs how much negotiation room exists.
- Schools are D-rated, which usually means shorter tenancies and higher turnover. Who's the typical renter profile here, and what's been the actual vacancy rate?
- What's the average days-on-market for RENTAL listings here right now (not sales)? A rising rental-DOM trend means longer vacancies and softer asking-rent achievability than the comps imply.
- What's the recent tenant-quality profile in this submarket — average credit score on applications, eviction rate, late-payment / NSF rate, and stable-employment percentage? A property-management company in the area should have these aggregated.
- How much new for-sale + rental construction is in the pipeline within 1–3 miles? Heavy new supply typically softens prices + rents 12–24 months out; constrained supply supports both.
Investment metrics
- 1% rule
- 1.31% ✓
- Cap rate
- 11.60%
- Cash-on-cash
- 18.96%
- DSCR
- 1.84
- GRM
- 6.4
CMA / ARV
No comps found within radius.
Projected returns pro-forma
-3.0% appreciation · 3.0% rent growth · sell at horizon
- IRR
- 10.8%
- Equity multiple
- 1.43×
- Total profit
- $7,819
- Equity at exit
- $9,766
- IRR
- 19.8%
- Equity multiple
- 2.66×
- Total profit
- $30,470
- Equity at exit
- $5,663
Cash invested: $18,340 (down + closing). Projections, not guarantees.
Landlord ↔ Tenant lean methodology
- Overall (STATE)
- 81 Strongly Landlord-Friendly
- State Missouri
- 81 Strongly Landlord-Friendly · R+10
- County
- — inherits STATE
- City
- — inherits STATE
ZIP-level market 65672
- Home prices YoY
- -12.6%
- Active inventory
- 278
- Price-to-rent
- 6.4×
Monthly cashflow live
- Estimated rent
- $858 medium interval (Pro) →
- Mortgage (P&I)
- −$343
- Tax from tax record
- −$17 /mo · $209/yr
- Insurance
- −$27
- HOA
- −$0
- Vacancy / Maint / Mgmt
- −$180
- Net cashflow
- $290
Break-even live
UW: 25.0% down · 7.5% · 30yr · 1.5% tax · 5.0% vac · 8.0% maint · 8.0% mgmt
Financing live
Cash to close
- Down payment
- $16,375
- Closing costs
- $1,965
- Reserves months
- —
- Total cash needed
- —
Loan-product check · same deal, 3 products live
Conventional
25% down · 7.5% · 30yr
- Down + closing
- —
- Monthly P&I
- —
- Monthly cashflow
- —
- DSCR
- —
- Eligible?
- —
Personal DTI + credit; lowest rate.
DSCR
20% down · 8.5% · 30yr
- Down + closing
- —
- Monthly P&I
- —
- Monthly cashflow
- —
- DSCR
- —
- Eligible?
- —
No personal income docs; deal must DSCR.
Hard money
10% down · 12.0% · 12mo
- Down + closing
- —
- Monthly P&I
- —
- Monthly cashflow
- —
- DSCR
- —
- Eligible?
- —
Short-term bridge; refi at stabilization.
Rent comps 3 comps
| Address | Beds | Baths | Sqft | Rent | $/sqft | DOM | Units | Dist |
|---|---|---|---|---|---|---|---|---|
| 174 Church St Unit 08 Hollister, MO | 1.0 | 1.0 | 650 | $695 | $1.07 | 43d | 1 | 0.17mi |
| 104 Matthews St Hollister, MO | 2.0 | 2.0 | 1000 | $1,000 | $1.00 | 43d | 1 | 0.75mi |
| 613 W Pacific St Branson, MO | 2.0 | 1.0 | 1122 | $1,495 | $1.33 | 43d | 1 | 1.14mi |
Listing history 8 events
-
2026-06-19days on market $65,500 Active 9 DOM
-
2026-06-18days on market $65,500 Active 8 DOM
-
2026-06-17days on market $65,500 Active 7 DOM
-
2026-06-16days on market $65,500 Active 6 DOM
-
2026-06-15days on market $65,500 Active 5 DOM
-
2026-06-14days on market $65,500 Active 3 DOM
-
2026-06-12remarks 595-char remark
-
2026-06-12$65,500 Active 2 DOM
ⓘ Source: listings_history table (triggers on properties + properties_extension) + one-shot
backfill from property_details.listing_events for pre-trigger history.
Tax reassessment forecast MO · Resets to sale price
- Current annual tax
- $209 · $17/mo
- Projected year-2 tax
- $635 · $53/mo
- Expected delta
- +$427/yr (+$36/mo · 204.4%)
ⓘ Screening estimate from a state-policy table — verify with the county assessor before closing.
Climate risk First Street
- Flood 1/10 Low FEMA zone X (unshaded) · 0% chance over 30 yrs
- Wildfire 3/10 Moderate
- Heat 5/10 Major 7 d/yr ≥106°F today · 19 d/yr by 30 yrs out
- Wind 2/10 Low 100% chance of damaging wind over 30 yrs
- Air quality 1/10 Low 0 unhealthy d/yr today · 0 by 30 yrs out
Nearby sold comps map
Loading sold comps map…
Walkable amenities ~0.75 mi
Loading nearby amenities…
Taxation est. · year 1
- Rental income
- $10,299
- − Mortgage interest
- −$3,669
- − Property taxes
- −$209
- − Insurance
- −$328
- − Repairs & maintenance
- −$824
- − Management
- −$824
- − Depreciation
- −$1,905
- Taxable income
- $2,540
- Est. tax owed @ 24.0%
- −$610
- After-tax cash flow
- $2,868/yr
For passive investors: Depreciation is non-cash, so a rental often shows a tax loss while cash-flowing — sheltering income. Rental losses are passive: they offset passive income freely, and up to $25,000/yr can offset ordinary (W-2) income if you actively participate and your MAGI is under $100k (phasing out to $0 by $150k); unused losses carry forward. On sale, claimed depreciation is recaptured at up to 25%, and gains may owe capital-gains tax (a 1031 exchange can defer both). Figures are a year-1 estimate at your 24.0% rate — not tax advice; consult a CPA.
Schools (NCES district)
- District
- Hollister R-V
- NCES district ID
- 2914550
- Math proficiency
- 40% ▲ 7.00%
- Reading proficiency
- 49% ▲ 5.00%
- Median HH income
- $38,213
- Composite
- 37.07/100
- National rank
- #4505
- State rank
- #108 of 324 in MO
Livability — Hollister
- Score
- 71/100
- State rank
- #109
- US rank
- #7035
Category grades
Schools grade is shown separately in the Schools card above.
Census & demographics
- Census place
- Hollister, MO
- Population (ZIP)
- 8,512
Population outlook (Taney County) Hauer SSP2
- Today (2025)
- 59,017 people
- By 2030
- 61,235 · +3.8%
- By 2040
- 65,225 · +10.5%
- By 2050
- 68,842 · +16.6%
- By 2075
- 77,705 · +31.7%
- By 2100
- 82,002 · +38.9%
Race, ethnicity, and origin ACS 2023
- Neighborhood character
- Predominantly White (89%)
- Race & ethnicity
- White 89% Hispanic / Latino 8% Two or more races 7%
- Hispanic origin (detail)
- Mexican 3% Cuban 2%
- Common ancestry
- Portuguese 4% Slovak 3% Iranian 2%
- Foreign-born
- 3% · Canada, Guatemala
- Languages at home
- 95% English-only · Spanish 4%
Political lean MEDSL · Taney
- 2024 margin
- Solid R (+59.3) · D 19.9% · R 79.2%
- 2008→2024 swing
- -22.2pp toward R · 2008: -37.2pp · 2024: -59.3pp
- All cycles
- 2024: R+59.3 2020: R+57.7 2016: R+59.3 2012: R+47.4 2008: R+37.2
Not yet ingested
- Civics
- —
Market trends
- HPI YoY
- ▼ -28.71%
- Current HPI
- 200.061
- Rent YoY
- —
- Metro
- —
- State GDP YoY
- ▲ 1.84%
- F500 in state
- 20
Industry mix (Fortune 500 HQ in MO)
| Industry | F500 HQs | Revenue |
|---|---|---|
| Healthcare | 1 | $163B |
|
||
| Insurance | 1 | $21B |
|
||
| Industrial Technology | 1 | $17B |
|
||
| Retail | 1 | $16B |
|
||
| Industrial Distribution | 1 | $10B |
|
||
| Utilities | 1 | $9B |
|
||
Price history
4 events — show timeline
- 2026-06-10 Listed $65,500 SOMO
- 2005-03-31 Sold (Public Records) — Public Records
- 1998-02-18 Sold (Public Records) — Public Records
- 1994-09-14 Sold (Public Records) — Public Records
Property tax history
+3.0%/yrLatest (2025): $209 · -0.2% YoY. Source: county tax records.
Cash-flow waterfall
monthlySold comps — $/sqft
last 12 mo · ≤1 miLoading sold comps…