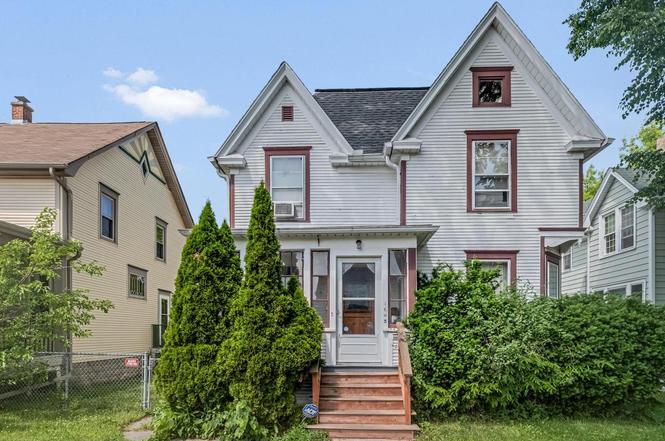
1648 Boyd Ave · Racine, WI
Flood risk 1/10 · Minimal
- FEMA flood zone
- X (unshaded)
- Chance of flooding over 30 yrs
- 0.0%
- Est. flood insurance / yr
- $507 – $1,088
Fire risk 1/10 · Minimal
- Est. fire insurance / yr
- $636 – $1,182
Heat risk 2/10 · Minimal
- Hot days now (above 95°F)
- 7 days/yr
- Hot days in 30 yrs
- 14 days/yr
Wind risk 2/10 · Minimal
- Chance of severe wind over 30 yrs
- —
Air-quality risk 3/10 · Minor
- Unhealthy air days now
- 3 days/yr
- Unhealthy air days in 30 yrs
- 3 days/yr
Risk factors via First Street. Map © Google.
Why this score? — see what drove the C+ grade
The composite is a weighted blend of 9 inputs, each scored 0–100. Each bar is that input's sub-score; the figure is the points it added to the 100-point composite (weight × sub-score).
- Cash flow +23.2/30.0
- ARV discount +15.0/15.0
- 1% rule +7.7/10.0
- DSCR +7.5/10.0
- Livability +4.0/5.0
- Rent growth +2.5/5.0
- Condition / age +2.5/5.0
- Schools +1.5/10.0
- Appreciation +0.0/10.0
$144,900
🖨 Deal sheet 📄 Offer letter ✓ Due diligence
Listing remarks MLS
Perfect home for a family! Three bedrooms on upper level with a full bathroom! Lower level has all new hardwood floors. Large fenced back yard with a patio/vineyard! Also included is a playhouse and a 1.5 car garage! Move in ready!
Key facts
- Dog park
- Ball fields
- Detached garage
Tags
Property features AI
Exterior
- Parking: Detached 1-car garage with opener; 1.5 garage parking spaces (total)
- Utilities: Municipal water; Municipal sewer
- Home design: Single-family home; 2-story; Year built per assessor/public record
- Construction: Wood exterior
- Exterior features: Deck; Fenced yard; Garden shed (outbuilding); Sidewalks
Interior
- Kitchen: Kitchen on main level — 12 x 9
- Bedrooms: Master bedroom (upper level) — 13 x 11; Bedroom 2 (upper level) — 12 x 11; Bedroom 3 (upper level) — 12 x 8
- Bathrooms: 1 full bathroom
- Heating & cooling: Central air; Forced air heating; Natural gas heating
- Interior features: Full basement; Den/office on main level
Neighborhood map
What this means for you Summary
Snapshot
- This is a 4-bed/1.0-bath single-family listed at $145k.
Deal economics
- At list price, monthly cash flow is $264 ($3k/yr) — positive.
- The deal already cash-flows at list — no discount required.
- Meets the 1% rule at list price ($2k rent vs $145k).
- Cap rate 8.5% vs local median 4.0% in Racine — top-decile yield for the area; either an underpriced asset or a hidden risk that comps aren't pricing in. Stress-test before assuming the spread holds.
Location & tenants
- Location reads 80/100 on livability (#58 in WI, #1,622 nationally) — a professional / high-income tenant draw. Strengths: commute A+, cost of living A+, housing A+; Watch: employment D, schools D-.
- Racine Unified School District (urban): math 12% / reading 20% proficiency, ranked #335 of 342 in WI (top 98%) — low school quality limits family demand, transient renter base, plan for 1-2y turnover.
- Market conditions: 45 active listings in the ZIP; 4 comparable units currently listed for rent nearby; rentals at typical pace (median 21d on market — plan ~3-4 weeks tenant-placement turnaround); 505 units permitted in Racine County in 2024 (287 in 5+ unit buildings).
- This rent runs 32% of the median local income ($69k/yr) — at the standard rent-burdened threshold; future hikes will face affordability resistance.
Forward outlook
- Local home prices are declining (-3.0%/yr); year-one equity from $1k of loan paydown is wiped out by about $4k of value loss. Plan a longer hold.
- Racine County population projected to shrink 7% by 2050 — rents likely to lag national; underwrite the cash flow, not the appreciation.
Negotiation context
- Only 8 days on market — expect competitive offers; lowballing is unlikely to land.
- 3 sale attempts since 13y ago with the ask held roughly flat each time — persistent listings suggest the price (not the market) is what's stuck; bring a comps-based counter.
- Current owner paid $77k; list at $145k implies a 88% gain — meaningful room to come down on a strong offer.
Risks & watch-outs
- Watch-outs: property tax is 3.0% of price; built in 1909 — expect roof / HVAC / electrical / plumbing capex.
Questions for the listing agent
- Built in 1909 — when were the roof, HVAC, electrical panel, plumbing, and water heater last replaced?
- Property tax is high relative to price — has the assessment been appealed recently, and will the sale trigger a re-assessment?
- Is there a deadline driving the sale (1031 exchange, divorce, estate, relocation)? That informs how much negotiation room exists.
- Schools are D-rated, which usually means shorter tenancies and higher turnover. Who's the typical renter profile here, and what's been the actual vacancy rate?
- What's the average days-on-market for RENTAL listings here right now (not sales)? A rising rental-DOM trend means longer vacancies and softer asking-rent achievability than the comps imply.
- What's the recent tenant-quality profile in this submarket — average credit score on applications, eviction rate, late-payment / NSF rate, and stable-employment percentage? A property-management company in the area should have these aggregated.
- How much new for-sale + rental construction is in the pipeline within 1–3 miles? Heavy new supply typically softens prices + rents 12–24 months out; constrained supply supports both.
Investment metrics
- 1% rule
- 1.27% ✓
- Cap rate
- 8.48%
- Cash-on-cash
- 7.80%
- DSCR
- 1.35
- GRM
- 6.6
CMA / ARV
- ARV (on-the-fly)
- $234,759
- Comps found
- 12
Show comp detail 12 sales within ~0.75 mi
| Address | Dist | Beds/Ba | Sqft | Sold | Price | $/sf | Match |
|---|---|---|---|---|---|---|---|
| 1604 Grange Ave | 0.20mi | 4/1.5 | 1,626 (+2%) | 1mo | $260,000 | $160 | 85 |
| 1701 Boyd Ave | 0.04mi | 3/1.5 (-1) | 1,503 (-6%) | 2mo | $200,900 | $134 | 80 |
| 1632 Holmes Ave | 0.07mi | 3/2.0 (-1) | 1,436 (-10%) | 1mo | $165,000 | $115 | 70 |
| 2717 Washington Ave | 0.39mi | 3/1.5 (-1) | 1,543 (-3%) | 2mo | $225,000 | $146 | 67 |
| 2910 Olive St | 0.65mi | 4/1.0 | 1,623 (+2%) | 0mo | $185,000 | $114 | 67 |
| 2045 Quincy Ave | 0.50mi | 3/1.0 (-1) | 1,517 (-5%) | 0mo | $242,000 | $160 | 63 |
| 1925 Kearney Ave | 0.31mi | 4/1.5 | 1,803 (+13%) | 2mo | $243,000 | $135 | 60 |
| 1949 Jay Eye See Ave | 0.43mi | 3/2.0 (-1) | 1,700 (+6%) | 1mo | $239,000 | $141 | 60 |
| 3325 15th St | 0.62mi | 3/2.0 (-1) | 1,645 (+3%) | 2mo | $245,000 | $149 | 56 |
| 2207 Hamilton Ave | 0.70mi | 3/1.5 (-1) | 1,622 (+2%) | 3mo | $240,000 | $148 | 56 |
| 1629 West Blvd | 0.40mi | 4/2.5 | 1,357 (-15%) | 2mo | $200,000 | $147 | 49 |
| 1330 Hayes Ave | 0.65mi | 5/2.0 (+1) | 1,400 (-12%) | 1mo | $265,000 | $189 | 39 |
Match score weights: distance 35% · size 25% · config 20% · recency 20%. Top-matched comps best support the ARV.
Projected returns pro-forma
-3.0% appreciation · 3.0% rent growth · sell at horizon
- IRR
- -4.3%
- Equity multiple
- 0.84×
- Total profit
- $-6,540
- Equity at exit
- $21,605
- IRR
- 5.5%
- Equity multiple
- 1.41×
- Total profit
- $16,508
- Equity at exit
- $12,528
Cash invested: $40,572 (down + closing). Projections, not guarantees.
Landlord ↔ Tenant lean methodology
- Overall (STATE)
- 73 Landlord-Friendly
- State Wisconsin
- 73 Landlord-Friendly · R+2
- County
- — inherits STATE
- City
- — inherits STATE
ZIP-level market 53405
- Active inventory
- 45
- Price-to-rent
- 6.6×
Monthly cashflow live
- Estimated rent
- $1,834 medium interval (Pro) →
- Mortgage (P&I)
- −$760
- Tax from tax record
- −$365 /mo · $4,379/yr
- Insurance
- −$60
- HOA
- −$0
- Vacancy / Maint / Mgmt
- −$385
- Net cashflow
- $264
Break-even live
UW: 25.0% down · 7.5% · 30yr · 1.5% tax · 5.0% vac · 8.0% maint · 8.0% mgmt
Financing live
Cash to close
- Down payment
- $36,225
- Closing costs
- $4,347
- Reserves months
- —
- Total cash needed
- —
Loan-product check · same deal, 3 products live
Conventional
25% down · 7.5% · 30yr
- Down + closing
- —
- Monthly P&I
- —
- Monthly cashflow
- —
- DSCR
- —
- Eligible?
- —
Personal DTI + credit; lowest rate.
DSCR
20% down · 8.5% · 30yr
- Down + closing
- —
- Monthly P&I
- —
- Monthly cashflow
- —
- DSCR
- —
- Eligible?
- —
No personal income docs; deal must DSCR.
Hard money
10% down · 12.0% · 12mo
- Down + closing
- —
- Monthly P&I
- —
- Monthly cashflow
- —
- DSCR
- —
- Eligible?
- —
Short-term bridge; refi at stabilization.
Rent comps 4 comps
| Address | Beds | Baths | Sqft | Rent | $/sqft | DOM | Units | Dist |
|---|---|---|---|---|---|---|---|---|
| 2328 21st St Racine, WI | 3.0 | 1.0 | 1239 | $1,750 | $1.41 | 13d | 1 | 0.45mi |
| 3224 Osborne Blvd Racine, WI | 3.0 | 2.0 | 1696 | $2,200 | $1.30 | 20d | 1 | 1.09mi |
| 1612 Winslow St Racine, WI | 3.0 | 1.0 | 1200 | $1,300 | $1.08 | 20d | 1 | 1.23mi |
| 1722 Wisconsin Ave Unit 2 Racine, WI | 3.0 | 1.0 | 1380 | $1,860 | $1.35 | 20d | 1 | 1.23mi |
Listing history 8 events
-
2026-06-19days on market $144,900 Active 8 DOM
-
2026-06-18days on market $144,900 Active 7 DOM
-
2026-06-17days on market $144,900 Active 6 DOM
-
2026-06-16days on market $144,900 Active 5 DOM
-
2026-06-15days on market $144,900 Active 4 DOM
-
2026-06-14days on market $144,900 Active 2 DOM
-
2026-06-13remarks 549-char remark
-
2026-06-13$144,900 Active 1 DOM
ⓘ Source: listings_history table (triggers on properties + properties_extension) + one-shot
backfill from property_details.listing_events for pre-trigger history.
Tax reassessment forecast WI · Partial reset (capped growth)
- Current annual tax
- $4,379 · $365/mo
- Projected year-2 tax
- $4,379 · $365/mo
- Expected delta
- $0/yr ($0/mo · 0.0%)
ⓘ Screening estimate from a state-policy table — verify with the county assessor before closing.
Climate risk First Street
- Flood 1/10 Low FEMA zone X (unshaded) · 0% chance over 30 yrs
- Wildfire 1/10 Low
- Heat 2/10 Low 7 d/yr ≥95°F today · 14 d/yr by 30 yrs out
- Wind 2/10 Low
- Air quality 3/10 Moderate 3 unhealthy d/yr today · 3 by 30 yrs out
Nearby sold comps map
Loading sold comps map…
Walkable amenities ~0.75 mi
Loading nearby amenities…
Taxation est. · year 1
- Rental income
- $22,008
- − Mortgage interest
- −$8,117
- − Property taxes
- −$4,379
- − Insurance
- −$724
- − Repairs & maintenance
- −$1,761
- − Management
- −$1,761
- − Depreciation
- −$4,215
- Taxable income
- $1,052
- Est. tax owed @ 24.0%
- −$253
- After-tax cash flow
- $2,913/yr
For passive investors: Depreciation is non-cash, so a rental often shows a tax loss while cash-flowing — sheltering income. Rental losses are passive: they offset passive income freely, and up to $25,000/yr can offset ordinary (W-2) income if you actively participate and your MAGI is under $100k (phasing out to $0 by $150k); unused losses carry forward. On sale, claimed depreciation is recaptured at up to 25%, and gains may owe capital-gains tax (a 1031 exchange can defer both). Figures are a year-1 estimate at your 24.0% rate — not tax advice; consult a CPA.
Schools (NCES district)
- District
- Racine Unified School District
- NCES district ID
- 5512360
- Math proficiency
- 12% ▼ -7.00%
- Reading proficiency
- 20% ▬ 0.00%
- Median HH income
- $50,716
- Composite
- 14.64/100
- National rank
- #9405
- State rank
- #335 of 342 in WI
Livability — Racine
- Score
- 80/100
- State rank
- #58
- US rank
- #1622
Category grades
Schools grade is shown separately in the Schools card above.
Census & demographics
- Census place
- Racine, WI
- County
- Racine County · 146,693 people
- City population
- 67,505
- Metro
- Racine, WI
- Population (ZIP)
- 26,793
- Household income
- $69,242
- Rent vs Own
- Severe rent burden
- 430.0
Population outlook (Racine County) Hauer SSP2
- Today (2025)
- 195,281 people
- By 2030
- 193,725 · -0.8%
- By 2040
- 188,159 · -3.6%
- By 2050
- 181,323 · -7.1%
- By 2075
- 174,342 · -10.7%
- By 2100
- 166,870 · -14.5%
Race, ethnicity, and origin ACS 2023
- Neighborhood character
- Diverse neighborhood (Simpson 0.56)
- Race & ethnicity
- White 63% Hispanic / Latino 17% Two or more races 15% Black 12% Asian 1%
- Hispanic origin (detail)
- Mexican 15% Puerto Rican 1%
- Common ancestry
- Romanian 7% Portuguese 4% Lithuanian 2%
- Foreign-born
- 4% · Canada
- Languages at home
- 91% English-only · Spanish 7% German/W. Germanic 1%
Political lean MEDSL · Racine
- 2024 margin
- Lean R (+6.2) · D 46.3% · R 52.5% · Other 1.2%
- 2008→2024 swing
- -13.6pp toward R · 2008: 7.4pp · 2024: -6.2pp
- All cycles
- 2024: R+6.2 2020: R+4.1 2016: R+4.4 2012: D+3.6 2008: D+7.4
Not yet ingested
- Civics
- —
Market trends
- HPI YoY
- ▼ -220.43%
- Current HPI
- 189.5192
- Rent YoY
- —
- Metro
- Racine, WI
- State GDP YoY
- ▲ 2.10%
- F500 in state
- 20
Industry mix (Fortune 500 HQ in WI)
| Industry | F500 HQs | Revenue |
|---|---|---|
| Industrial Machinery | 4 | $23B |
|
||
| Industrial Technology | 2 | $36B |
|
||
| Insurance | 1 | $36B |
|
||
| Professional Services | 1 | $19B |
|
||
| Utilities | 1 | $9B |
|
||
| Consumer Goods | 1 | $3B |
|
||
Price history
+88.4% since first listed6 events — show timeline
- 2026-06-11 Listed $144,900 METROMLS
- 2014-08-01 Listing Removed — METROMLS
- 2014-08-01 Listed $99,900 METROMLS
- 2013-02-10 Listing Removed — METROMLS
- 2013-02-10 Listed $119,900 METROMLS
- 2000-04-20 Sold (Public Records) $76,900 Public Records
Property tax history
+4.5%/yrLatest (2025): $4,379 · +11.0% YoY. Source: county tax records.
Cash-flow waterfall
monthlySold comps — $/sqft
last 12 mo · ≤1 miLoading sold comps…