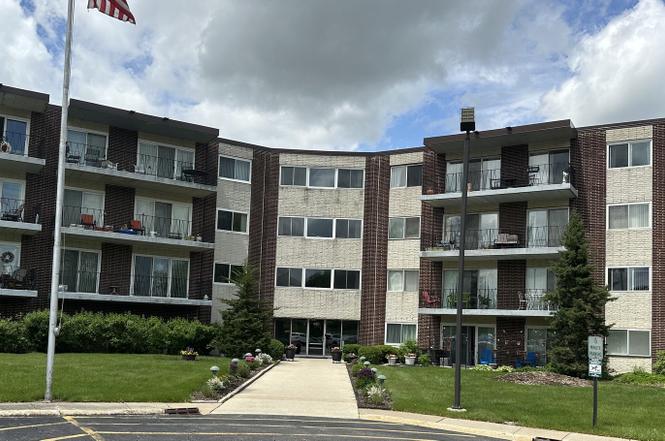
5540 Walnut Ave Unit 33A · Downers Grove, IL
Flood risk 1/10 · Minimal
- FEMA flood zone
- X (unshaded)
- Chance of flooding over 30 yrs
- 0.0%
- Est. flood insurance / yr
- $473 – $860
Fire risk 1/10 · Minimal
- Est. fire insurance / yr
- $804 – $1,492
Heat risk 3/10 · Minor
- Hot days now (above 104°F)
- 7 days/yr
- Hot days in 30 yrs
- 14 days/yr
Wind risk 2/10 · Minimal
- Chance of severe wind over 30 yrs
- —
Air-quality risk 3/10 · Minor
- Unhealthy air days now
- 3 days/yr
- Unhealthy air days in 30 yrs
- 3 days/yr
Risk factors via First Street. Map © Google.
Why this score? — see what drove the C grade
The composite is a weighted blend of 9 inputs, each scored 0–100. Each bar is that input's sub-score; the figure is the points it added to the 100-point composite (weight × sub-score).
- Cash flow +21.0/30.0
- ARV discount +7.5/15.0
- 1% rule +6.7/10.0
- DSCR +6.7/10.0
- Rent growth +4.4/5.0
- Livability +4.3/5.0
- Schools +3.4/10.0
- Condition / age +2.5/5.0
- Appreciation +0.0/10.0
$150,000
🖨 Deal sheet 📄 Offer letter ✓ Due diligence
Listing remarks MLS
There are no remarks available.
Key facts
- Conference room
- New interior doors
- Fitness room
Tags
Neighborhood map
What this means for you Summary
Snapshot
- This is a 1-bed/1.0-bath condo listed at $150k.
Deal economics
- At list price, monthly cash flow is $212 ($3k/yr) — positive.
- The deal already cash-flows at list — no discount required.
- Meets the 1% rule at list price ($2k rent vs $150k).
- Cap rate 8.0% vs local median 2.9% in Downers Grove — top-decile yield for the area; either an underpriced asset or a hidden risk that comps aren't pricing in. Stress-test before assuming the spread holds.
Location & tenants
- Location reads 86/100 on livability (#24 in IL, #452 nationally) — a professional / high-income tenant draw. Strengths: crime A+, commute A+, employment A+; Watch: cost of living F.
- Lisle CUSD 202 (suburban): math 37% / reading 39% proficiency, ranked #147 of 620 in IL (top 24%) — families likely to look elsewhere, expect single-tenant / working-renter base with shorter leases.
- Market conditions: Rents rising fast (+7.6%/yr); 72 active listings in the ZIP; 9 comparable units currently listed for rent nearby; rentals leasing fast (median 4d on market — plan ~1-2 weeks tenant-placement turnaround); high-income renter base; 1,378 units permitted in DuPage County in 2024 (594 in 5+ unit buildings).
- This rent is only 17% of the median local income ($123k/yr) — well below the 30% rent-burden line; pricing power to push rent on renewal without tenant pushback.
Forward outlook
- Local home prices are declining (-3.0%/yr); year-one equity from $1k of loan paydown is wiped out by about $4k of value loss. Plan a longer hold.
- At projected returns (-3.0% appreciation + 7.6% rent growth), your $42k cash investment doubles in ~9 years — after that, you're playing with house money.
Negotiation context
- Only 2 days on market — expect competitive offers; lowballing is unlikely to land.
- 3 sale attempts since 11y ago; this cycle's ask is 36% above the opening price — seller raised mid-cycle; expect resistance to lowballs.
- Current owner paid $117k; 28% above their basis — modest negotiation headroom, anchor on the comps not their cost.
Questions for the listing agent
- Built in 1967 — when were the roof, HVAC, electrical panel, plumbing, and water heater last replaced?
- What does the HOA fee cover, when was the last increase, and are there any pending special assessments or reserve-fund shortfalls?
- Any open or pending special assessments — roof, HVAC, plumbing, elevator, façade? What's the per-unit balance and payoff schedule, and is the seller paying it off at close or rolling it to the buyer?
- Is there a deadline driving the sale (1031 exchange, divorce, estate, relocation)? That informs how much negotiation room exists.
- Schools are B-rated — typically a magnet for longer-tenancy family renters. What's the average tenant stay here, and is there a school-zone premium baked into asking?
- What's the average days-on-market for RENTAL listings here right now (not sales)? A rising rental-DOM trend means longer vacancies and softer asking-rent achievability than the comps imply.
- What's the recent tenant-quality profile in this submarket — average credit score on applications, eviction rate, late-payment / NSF rate, and stable-employment percentage? A property-management company in the area should have these aggregated.
- How much new apartment / multifamily construction is in the pipeline within 1–3 miles? Heavy new supply (>2% of stock underway) typically softens rents 12–24 months out; light construction supports rent growth.
Investment metrics
- 1% rule
- 1.17% ✓
- Cap rate
- 7.99%
- Cash-on-cash
- 6.06%
- DSCR
- 1.27
- GRM
- 7.1
CMA / ARV
No comps found within radius.
Projected returns pro-forma
-3.0% appreciation · 7.64% rent growth · sell at horizon
- IRR
- -1.2%
- Equity multiple
- 0.95×
- Total profit
- $-2,080
- Equity at exit
- $22,365
- IRR
- 13.2%
- Equity multiple
- 2.31×
- Total profit
- $54,881
- Equity at exit
- $12,969
Cash invested: $42,000 (down + closing). Projections, not guarantees.
Landlord ↔ Tenant lean methodology
- Overall (STATE)
- 43 Moderately Tenant-Leaning
- State Illinois
- 43 Moderately Tenant-Leaning · D+7
- County
- — inherits STATE
- City
- — inherits STATE
ZIP-level market 60515
- Rents YoY
- 7.6%
- Active inventory
- 72
- Price-to-rent
- 7.1×
Monthly cashflow live
- Estimated rent
- $1,759 high interval (Pro) →
- Mortgage (P&I)
- −$787
- Tax from tax record
- −$146 /mo · $1,754/yr
- Insurance
- −$62
- HOA
- −$182
- Vacancy / Maint / Mgmt
- −$369
- Net cashflow
- $212
Break-even live
Sensitivity live
| Price | -10% $297 | -5% $255 | +0% $212 | +5% $170 | +10% $127 |
|---|---|---|---|---|---|
| Rent | -10% $73 | -5% $143 | +0% $212 | +5% $282 | +10% $351 |
| Rate | -1.0pp $288 | -0.5pp $250 | base $212 | +0.5pp $173 | +1.0pp $134 |
UW: 25.0% down · 7.5% · 30yr · 1.5% tax · 5.0% vac · 8.0% maint · 8.0% mgmt
Financing live
Cash to close
- Down payment
- $37,500
- Closing costs
- $4,500
- Reserves months
- —
- Total cash needed
- —
Loan-product check · same deal, 3 products live
Conventional
25% down · 7.5% · 30yr
- Down + closing
- —
- Monthly P&I
- —
- Monthly cashflow
- —
- DSCR
- —
- Eligible?
- —
Personal DTI + credit; lowest rate.
DSCR
20% down · 8.5% · 30yr
- Down + closing
- —
- Monthly P&I
- —
- Monthly cashflow
- —
- DSCR
- —
- Eligible?
- —
No personal income docs; deal must DSCR.
Hard money
10% down · 12.0% · 12mo
- Down + closing
- —
- Monthly P&I
- —
- Monthly cashflow
- —
- DSCR
- —
- Eligible?
- —
Short-term bridge; refi at stabilization.
Rent comps 9 comps
| Address | Beds | Baths | Sqft | Rent | $/sqft | DOM | Units | Dist |
|---|---|---|---|---|---|---|---|---|
| 5700 Walnut Ave Downers Grove, IL | 1.0–2.0 | 1.0–2.0 | 873 | $1,812 | $2.07 | 2d | 25 | 0.36mi |
| 420 Walnut Creek Ln Lisle, IL | 1.0 | 1.0 | 804 | $1,480 | $1.84 | 44d | 2 | 0.74mi |
| 430 Walnut Creek Ln Lisle, IL | 1.0 | 1.0 | 759 | $1,562 | $2.06 | 19d | 2 | 0.76mi |
| 4758 St Joseph Creek Rd Lisle, IL | 1.0 | 1.0 | 657 | $1,713 | $2.61 | 3d | 12 | 0.99mi |
| 4905 Belmont Rd Downers Grove, IL | 1.0 | 1.0 | 710 | $1,400 | $1.97 | 1d | 1 | 1.01mi |
| 1007 Front St Apt 202 Lisle, IL | 1.0 | 1.0 | 700 | $1,435 | $2.05 | 4d | 1 | 1.16mi |
| 1007 Front St Lisle, IL | 1.0 | 1.0 | 700 | $1,549 | $2.21 | 15d | 1 | 1.16mi |
| 1111 Burlington Ave #419 Lisle, IL | 2.0 | 2.0 | 750 | $2,150 | $2.87 | 44d | 1 | 1.31mi |
| 450 Warrenville Rd Lisle, IL | 1.0–2.0 | 1.0–2.0 | 1110 | $1,985 | $1.79 | 1d | 34 | 1.44mi |
HOA detail condo
- Monthly dues
- $182 · $2,184/yr
- Assessments
- None detected in remarks — confirm with the listing agent.
Listing history 7 events
-
2026-06-18days on market $150,000 Active 2 DOM
-
2026-06-17statusdays on market $150,000 Active 1 DOM
-
2026-06-16days on market $150,000 Active (Private) 6 DOM
-
2026-06-15days on market $150,000 Active (Private) 5 DOM
-
2026-06-13days on market $150,000 Active (Private) 3 DOM
-
2026-06-13remarks 699-char remark
-
2026-06-13$150,000 Active (Private) 2 DOM
ⓘ Source: listings_history table (triggers on properties + properties_extension) + one-shot
backfill from property_details.listing_events for pre-trigger history.
Tax reassessment forecast IL · Partial reset (capped growth)
- Current annual tax
- $1,754 · $146/mo
- Projected year-2 tax
- $2,580 · $215/mo
- Expected delta
- +$825/yr (+$69/mo · 47.1%)
ⓘ Screening estimate from a state-policy table — verify with the county assessor before closing.
Climate risk First Street
- Flood 1/10 Low FEMA zone X (unshaded) · 0% chance over 30 yrs
- Wildfire 1/10 Low
- Heat 3/10 Moderate 7 d/yr ≥104°F today · 14 d/yr by 30 yrs out
- Wind 2/10 Low
- Air quality 3/10 Moderate 3 unhealthy d/yr today · 3 by 30 yrs out
Nearby sold comps map
Loading sold comps map…
Walkable amenities ~0.75 mi
Loading nearby amenities…
Taxation est. · year 1
- Rental income
- $21,107
- − Mortgage interest
- −$8,402
- − Property taxes
- −$1,754
- − Insurance
- −$750
- − Repairs & maintenance
- −$1,689
- − Management
- −$1,689
- − HOA
- −$2,184
- − Depreciation
- −$4,364
- Taxable income
- $276
- Est. tax owed @ 24.0%
- −$66
- After-tax cash flow
- $2,481/yr
For passive investors: Depreciation is non-cash, so a rental often shows a tax loss while cash-flowing — sheltering income. Rental losses are passive: they offset passive income freely, and up to $25,000/yr can offset ordinary (W-2) income if you actively participate and your MAGI is under $100k (phasing out to $0 by $150k); unused losses carry forward. On sale, claimed depreciation is recaptured at up to 25%, and gains may owe capital-gains tax (a 1031 exchange can defer both). Figures are a year-1 estimate at your 24.0% rate — not tax advice; consult a CPA.
Schools (NCES district)
- District
- Lisle CUSD 202
- NCES district ID
- 1723200
- Math proficiency
- 37% ▼ -10.00%
- Reading proficiency
- 39% ▼ -8.00%
- Median HH income
- $65,134
- Composite
- 34.28/100
- National rank
- #5247
- State rank
- #147 of 620 in IL
Livability — Downers Grove
- Score
- 86/100
- State rank
- #24
- US rank
- #452
Category grades
Schools grade is shown separately in the Schools card above.
Census & demographics
- Census place
- Downers Grove, IL
- County
- DuPage County · 904,569 people
- City population
- 57,824
- Metro
- Chicago-Naperville-Elgin, IL-IN-WI
- Population (ZIP)
- 29,762
- Household income
- $123,197
- Rent vs Own
- Severe rent burden
- 697.0
Population outlook (DuPage County) Hauer SSP2
- Today (2025)
- 960,187 people
- By 2030
- 965,850 · +0.6%
- By 2040
- 965,812 · +0.6%
- By 2050
- 954,890 · -0.6%
- By 2075
- 910,185 · -5.2%
- By 2100
- 816,255 · -15.0%
Race, ethnicity, and origin ACS 2023
- Neighborhood character
- Predominantly White (84%)
- Race & ethnicity
- White 84% Asian 6% Two or more races 5% Hispanic / Latino 4% Black 2%
- Common ancestry
- Romanian 15% Lithuanian 3% Iranian 2%
- Foreign-born
- 8% · China, Canada, South Korea
- Languages at home
- 89% English-only · Other Indo-European 3% Russian/Polish/Slavic 2% Spanish 2%
Political lean MEDSL · DuPage
- 2024 margin
- D (+13.3) · D 55.9% · R 42.5% · Other 1.6%
- 2008→2024 swing
- +2.5pp toward D · 2008: 10.8pp · 2024: 13.3pp
- All cycles
- 2024: D+13.3 2020: D+18.1 2016: D+14.1 2012: D+1.0 2008: D+10.8
Not yet ingested
- Civics
- —
Market trends
- HPI YoY
- ▼ -361.64%
- Current HPI
- 222.0126
- Rent YoY
- ▲ 7.64%
- Metro
- Chicago-Naperville-Elgin, IL-IN-WI
- State GDP YoY
- ▲ 1.59%
- F500 in state
- 60
Industry mix (Fortune 500 HQ in IL)
| Industry | F500 HQs | Revenue |
|---|---|---|
| Insurance | 4 | $201B |
|
||
| Consumer Goods | 4 | $87B |
|
||
| Industrial Machinery | 3 | $64B |
|
||
| Healthcare | 2 | $55B |
|
||
| Retail / Pharmacy | 1 | $148B |
|
||
| Agriculture / Food | 1 | $86B |
|
||
Price history
+219.1% since first listed13 events — show timeline
- 2026-06-10 Coming Soon $150,000 MRED as Distributed by MLS Grid
- 2025-12-29 Listing Removed — MRED as Distributed by MLS Grid
- 2025-10-29 Listed — MRED as Distributed by MLS Grid
- 2024-06-27 Sold (Public Records) $117,000 Public Records
- 2024-05-31 Sold (MLS) $117,000 MRED as Distributed by MLS Grid
- 2024-05-11 Contingent — MRED as Distributed by MLS Grid
- 2024-05-09 Listed $110,000 MRED as Distributed by MLS Grid
- 2015-09-09 Sold (Public Records) $60,000 Public Records
- 2015-08-28 Sold (MLS) $59,900 MRED as Distributed by MLS Grid
- 2015-07-22 Contingent — MRED as Distributed by MLS Grid
- 2015-07-14 Listed $59,900 MRED as Distributed by MLS Grid
- 1996-11-01 Sold (Public Records) $52,500 Public Records
- 1991-12-30 Sold (Public Records) $47,000 Public Records
Property tax history
+0.8%/yrLatest (2024): $1,754 · +7.8% YoY. Source: county tax records.
Cash-flow waterfall
monthlySold comps — $/sqft
last 12 mo · ≤1 miLoading sold comps…