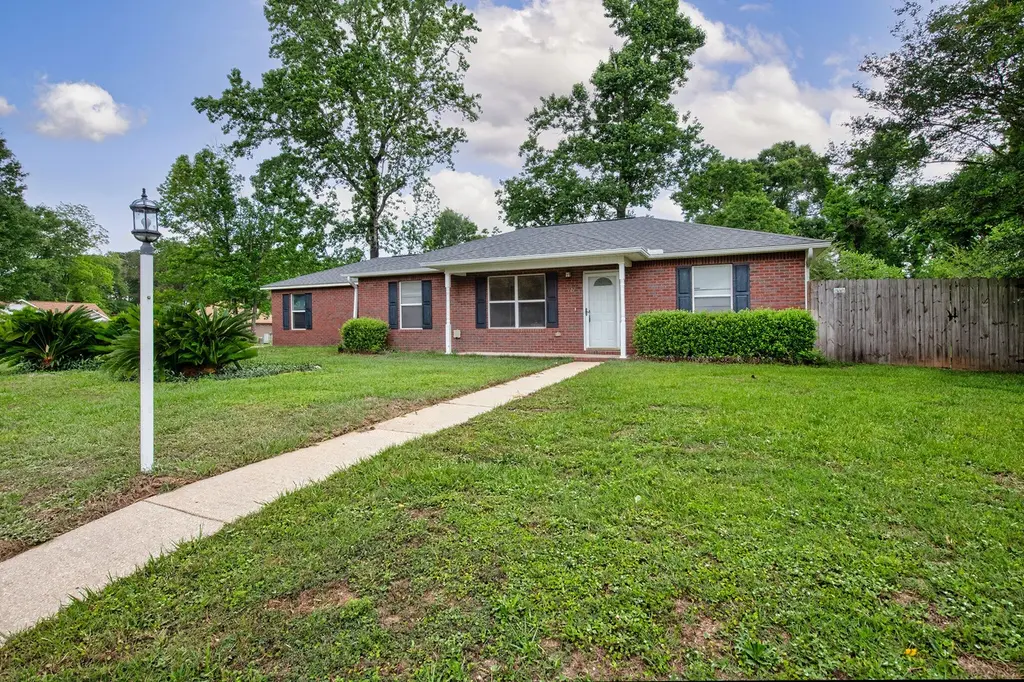
121 Dogwood Ln · Crestview, FL
Flood risk 1/10 · Minimal
- FEMA flood zone
- X (unshaded)
- Chance of flooding over 30 yrs
- 0.0%
- Est. flood insurance / yr
- $507 – $1,088
Fire risk 4/10 · Minor
- Est. fire insurance / yr
- $947 – $1,759
Heat risk 9/10 · Severe
- Hot days now (above 107°F)
- 7 days/yr
- Hot days in 30 yrs
- 19 days/yr
Wind risk 9/10 · Severe
- Chance of severe wind over 30 yrs
- 99.0%
Air-quality risk 2/10 · Minimal
- Unhealthy air days now
- 1 days/yr
- Unhealthy air days in 30 yrs
- 1 days/yr
Risk factors via First Street. Map © Google.
Why this score? — see what drove the D- grade
The composite is a weighted blend of 9 inputs, each scored 0–100. Each bar is that input's sub-score; the figure is the points it added to the 100-point composite (weight × sub-score).
- Cash flow +11.0/30.0
- ARV discount +8.5/15.0
- Schools +5.2/10.0
- Livability +3.8/5.0
- DSCR +3.2/10.0
- Rent growth +2.8/5.0
- Condition / age +2.5/5.0
- 1% rule +2.2/10.0
- Appreciation +0.0/10.0
$295,000
🖨 Deal sheet 📄 Offer letter ✓ Due diligence
Listing remarks
This brick home sits on a 0.5 acre corner lot with a fenced yard for privacy. As you enter the home, you are step into the spacious living room which flows into the dining area. The galley kitchen has new granite counter tops. The primary bedroom is off the living room with a full bath connecting to the laundry room. On the opposite side of the home are 2 additional bedrooms and a full bath. Both bathrooms have new granite counters. Laminate floors and a fresh coat of paint make this home even more welcoming. Double doors from the dining area open up to the fenced back yard with room for a pool. NO HOA. Schedule your visit today
Key facts
- 0.51 acre lot
- 2 garage spots
- Built 1998
Property features AI
Finance
- HOA & community: Located in the Dogwood Estates subdivision
Exterior
- Parking: Attached 2-car garage; Driveway with about 4 spaces
- Utilities: Electric service; Public water; Septic tank; TV cable
- Home design: Ranch-style single-story home; Built in 1998
- Construction: Shingle roof; Brick front siding with vinyl siding and vinyl trim; 1 story
- Exterior features: Privacy fencing; Open patio; Corner, irregular, level lot; Paved road access
Interior
- Kitchen: Dishwasher; Range hood; Refrigerator
- Bedrooms: 3 bedrooms; Primary bedroom on the first floor with walk-in closet and double vanity
- Flooring: Laminate flooring; Tile flooring
- Bathrooms: 2 full bathrooms; Primary bathroom has shower (no tub) and double vanity
- Heating & cooling: Central heating; Central air; Ceiling fans
- Interior features: Vaulted ceilings; Newly painted; Washer/dryer hookup
- Laundry & utility: Washer/dryer hookup; Electric water heater
Neighborhood map
What this means for you Summary
Snapshot
- This is a 3-bed/2.0-bath single-family listed at $295k.
Deal economics
- At list price, monthly cash flow is $-125 ($-1k/yr) — negative.
- To cash-flow at today's rent, offer at most $273k (7.5% below list).
- To meet the 1% rule (rent ≥ 1% of price), the offer needs to be $212k (28.0% below list).
- Recommended offer: $212k (28.0% below list) — sets the bar for 1% rule.
- Cap rate 5.8% vs local median 4.4% in Crestview — top-decile yield for the area; either an underpriced asset or a hidden risk that comps aren't pricing in. Stress-test before assuming the spread holds.
Location & tenants
- Location reads 75/100 on livability (#252 in FL, #3,858 nationally) — a middle-class / working-renter tenant base. Strengths: cost of living A+, housing A+, health & safety A+; Watch: employment D, amenities F, commute F.
- Okaloosa (other): math 60% / reading 60% proficiency, ranked #12 of 73 in FL (top 16%) — acceptable for families but not a draw, mixed tenant base, ~2y average lease.
- Zoned schools: Bob Sikes Elementary School (math 53% / reading 60%, grade C+, #816 of 2,144 statewide, top 39%, 829 students, 52% FRL); Crestview High School (math 49% / reading 54%, grade D+, #167 of 667 statewide, top 25%, 2,315 students, 42% FRL).
- Market conditions: Rents rising (+1.2%/yr); 349 active listings in the ZIP; 3 comparable units currently listed for rent nearby; rentals at typical pace (median 21d on market — plan ~3-4 weeks tenant-placement turnaround); solid renter incomes; 1,268 units permitted in Okaloosa County in 2024 (175 in 5+ unit buildings).
- This rent runs 33% of the median local income ($78k/yr) — at the standard rent-burdened threshold; future hikes will face affordability resistance.
Forward outlook
- Local home prices are declining (-3.0%/yr); year-one equity from $2k of loan paydown is wiped out by about $9k of value loss. Plan a longer hold.
- Okaloosa County population projected at +37% by 2050 — long-run rental-demand tailwind backs the buy-and-hold thesis.
Negotiation context
- It's been on market 39 days — a 3% lower offer ($286k) is reasonable based on typical stale-listing flexibility.
- 11 sale attempts since 21y ago with the ask held roughly flat each time — persistent listings suggest the price (not the market) is what's stuck; bring a comps-based counter.
- Current owner paid $154k; list at $295k implies a 92% gain — meaningful room to come down on a strong offer.
Risks & watch-outs
- Climate carrying-cost: severe wind risk, 99% chance of damaging wind over 30y; extreme-heat days projected 7→19/yr by 2055 (HVAC capex compounding) — expect insurance premiums to compound above CPI over the hold.
Questions for the listing agent
- What do current leases actually rent for vs. the listed asking? Can we see a recent rent roll and the last 12 months of T-12 income?
- It's been on market 39 days. Have you received any prior offers? Is the seller open to a 28% concession, seller financing, or rate buy-down credit?
- Is there a deadline driving the sale (1031 exchange, divorce, estate, relocation)? That informs how much negotiation room exists.
- Schools are B-rated — typically a magnet for longer-tenancy family renters. What's the average tenant stay here, and is there a school-zone premium baked into asking?
- The area grade is low — what's the realistic commute time and amenity access for the typical tenant pool here? Any planned neighborhood developments (good or bad) we should know about?
- What's the average days-on-market for RENTAL listings here right now (not sales)? A rising rental-DOM trend means longer vacancies and softer asking-rent achievability than the comps imply.
- What's the recent tenant-quality profile in this submarket — average credit score on applications, eviction rate, late-payment / NSF rate, and stable-employment percentage? A property-management company in the area should have these aggregated.
- How much new for-sale + rental construction is in the pipeline within 1–3 miles? Heavy new supply typically softens prices + rents 12–24 months out; constrained supply supports both.
Investment metrics
- 1% rule
- 0.72% ✗
- Cap rate
- 5.79%
- Cash-on-cash
- -1.81%
- DSCR
- 0.92
- GRM
- 11.6
CMA / ARV
- ARV (median comp)
- $301,457
- List price
- $295,000
- Delta
- -2.14%
- Verdict
- FAIR
- Comps
- 20 within 1.0 mi
Show comp detail 1 sale within ~0.75 mi
| Address | Dist | Beds/Ba | Sqft | Sold | Price | $/sf | Match |
|---|---|---|---|---|---|---|---|
| 139 Twin Oak Dr | 0.14mi | 3/2.0 | 1,247 (+6%) | 23mo | $278,500 | $223 | 64 |
Match score weights: distance 35% · size 25% · config 20% · recency 20%. Top-matched comps best support the ARV.
Projected returns pro-forma
-3.0% appreciation · 1.17% rent growth · sell at horizon
- IRR
- -21.2%
- Equity multiple
- 0.28×
- Total profit
- $-59,685
- Equity at exit
- $43,985
- IRR
- -18.9%
- Equity multiple
- 0.06×
- Total profit
- $-77,830
- Equity at exit
- $25,506
Cash invested: $82,600 (down + closing). Projections, not guarantees.
Landlord ↔ Tenant lean methodology
- Overall (STATE)
- 87 Strongly Landlord-Friendly
- State Florida
- 87 Strongly Landlord-Friendly · R+3
- County
- — inherits STATE
- City
- — inherits STATE
ZIP-level market 32536
- Home prices YoY
- -16.2%
- Rents YoY
- 1.2%
- Active inventory
- 349
- Price-to-rent
- 11.6×
Monthly cashflow live
- Estimated rent
- $2,123 medium interval (Pro) →
- Mortgage (P&I)
- −$1,547
- Tax from tax record
- −$132 /mo · $1,579/yr
- Insurance
- −$123
- HOA
- −$0
- Vacancy / Maint / Mgmt
- −$446
- Net cashflow
- $-125
Break-even live
UW: 25.0% down · 7.5% · 30yr · 1.5% tax · 5.0% vac · 8.0% maint · 8.0% mgmt
Financing live
Cash to close
- Down payment
- $73,750
- Closing costs
- $8,850
- Reserves months
- —
- Total cash needed
- —
Loan-product check · same deal, 3 products live
Conventional
25% down · 7.5% · 30yr
- Down + closing
- —
- Monthly P&I
- —
- Monthly cashflow
- —
- DSCR
- —
- Eligible?
- —
Personal DTI + credit; lowest rate.
DSCR
20% down · 8.5% · 30yr
- Down + closing
- —
- Monthly P&I
- —
- Monthly cashflow
- —
- DSCR
- —
- Eligible?
- —
No personal income docs; deal must DSCR.
Hard money
10% down · 12.0% · 12mo
- Down + closing
- —
- Monthly P&I
- —
- Monthly cashflow
- —
- DSCR
- —
- Eligible?
- —
Short-term bridge; refi at stabilization.
Rent comps 3 comps
| Address | Beds | Baths | Sqft | Rent | $/sqft | DOM | Units | Dist |
|---|---|---|---|---|---|---|---|---|
| 6260 Old Bethel Rd Crestview, FL | 1.0–3.0 | 1.0–2.0 | 1253 | $2,295 | $1.83 | 13d | 66 | 0.27mi |
| 2606 Saltgrass Way Crestview, FL | 4.0 | 2.0 | 1387 | $1,850 | $1.33 | 21d | 1 | 1.08mi |
| 205 Powell Dr Crestview, FL | 3.0 | 1.5 | 1008 | $1,400 | $1.39 | 43d | 1 | 1.12mi |
Listing history 33 events
-
2026-06-18days on market $295,000 Active 39 DOM
-
2026-06-17days on market $295,000 Active 38 DOM
-
2026-06-16days on market $295,000 Active 37 DOM
-
2026-06-15days on market $295,000 Active 36 DOM
-
2026-06-14days on market $295,000 Active 34 DOM
-
2026-06-13days on market $295,000 Active 33 DOM
-
2026-06-10days on market $295,000 Active 31 DOM
-
2026-06-09days on market $295,000 Active 30 DOM
-
2026-06-08days on market $295,000 Active 29 DOM
-
2026-06-07days on market $295,000 Active 28 DOM
-
2026-06-05days on market $295,000 Active 25 DOM
-
2026-06-02days on market $295,000 Active 23 DOM
-
2026-06-01days on market $295,000 Active 22 DOM
-
2026-05-31days on market $295,000 Active 21 DOM
-
2026-05-30days on market $295,000 Active 20 DOM
-
2026-05-10$295,000 Active 636-char remark
-
2017-05-22historical
-
2013-04-26$149,900
-
2013-04-26$149,900
-
2012-10-25$155,900
-
2008-08-21soldstatus $153,500
-
2008-08-15soldstatus $153,500
-
2007-11-16$157,000
-
2007-11-15historical
-
2007-05-15$176,000
-
2007-05-15$182,500
-
2007-05-15$176,000
-
2007-05-15$182,500
-
2007-05-15historical
-
2006-03-14historical
-
2005-09-14$219,900
-
2005-09-14$219,900
-
1998-10-01soldstatus $9,500
ⓘ Source: listings_history table (triggers on properties + properties_extension) + one-shot
backfill from property_details.listing_events for pre-trigger history.
Tax reassessment forecast FL · Resets to sale price
- Current annual tax
- $1,579 · $132/mo
- Projected year-2 tax
- $2,448 · $204/mo
- Expected delta
- +$869/yr (+$72/mo · 55.1%)
ⓘ Screening estimate from a state-policy table — verify with the county assessor before closing.
Climate risk First Street
- Flood 1/10 Low FEMA zone X (unshaded) · 0% chance over 30 yrs
- Wildfire 4/10 Moderate
- Heat 9/10 Extreme 7 d/yr ≥107°F today · 19 d/yr by 30 yrs out
- Wind 9/10 Extreme 99% chance of damaging wind over 30 yrs
- Air quality 2/10 Low 1 unhealthy d/yr today · 1 by 30 yrs out
Nearby sold comps map
Loading sold comps map…
Walkable amenities ~0.75 mi
Loading nearby amenities…
Taxation est. · year 1
- Rental income
- $25,473
- − Mortgage interest
- −$16,525
- − Property taxes
- −$1,579
- − Insurance
- −$1,475
- − Repairs & maintenance
- −$2,038
- − Management
- −$2,038
- − Depreciation
- −$8,582
- Taxable loss
- −$6,763
- Est. tax savings @ 24.0%
- +$1,623
- After-tax cash flow
- $129/yr
For passive investors: Depreciation is non-cash, so a rental often shows a tax loss while cash-flowing — sheltering income. Rental losses are passive: they offset passive income freely, and up to $25,000/yr can offset ordinary (W-2) income if you actively participate and your MAGI is under $100k (phasing out to $0 by $150k); unused losses carry forward. On sale, claimed depreciation is recaptured at up to 25%, and gains may owe capital-gains tax (a 1031 exchange can defer both). Figures are a year-1 estimate at your 24.0% rate — not tax advice; consult a CPA.
Schools (NCES district)
- District
- Okaloosa
- NCES district ID
- 1201380
- Math proficiency
- 60% ▼ -12.00%
- Reading proficiency
- 60% ▼ -4.00%
- Median HH income
- $55,601
- Composite
- 51.62/100
- National rank
- #1705
- State rank
- #12 of 73 in FL
Livability — Crestview
- Score
- 75/100
- State rank
- #252
- US rank
- #3858
Category grades
Schools grade is shown separately in the Schools card above.
Census & demographics
- County
- Okaloosa County · 194,352 people
- City population
- 58,889
- Metro
- Crestview-Fort Walton Beach-Destin, FL
- Population (ZIP)
- 25,599
- Household income
- $78,119
- Rent vs Own
- Severe rent burden
- 634.0
Population outlook (Okaloosa County) Hauer SSP2
- Today (2025)
- 235,133 people
- By 2030
- 253,483 · +7.8%
- By 2040
- 289,537 · +23.1%
- By 2050
- 322,954 · +37.3%
- By 2075
- 399,624 · +70.0%
- By 2100
- 425,311 · +80.9%
Race, ethnicity, and origin ACS 2023
- Neighborhood character
- Diverse neighborhood (Simpson 0.56)
- Race & ethnicity
- White 64% Black 16% Hispanic / Latino 12% Two or more races 9% Asian 3%
- Hispanic origin (detail)
- Mexican 4% Puerto Rican 2% Dominican 1%
- Common ancestry
- Lithuanian 2% Slovak 2% Italian 2%
- Foreign-born
- 6% · Canada, South Korea
- Languages at home
- 91% English-only · Spanish 7% Tagalog/Filipino 1%
Political lean MEDSL · Okaloosa
- 2024 margin
- Solid R (+42.4) · D 28.2% · R 70.7% · Other 1.1%
- 2008→2024 swing
- +2.5pp toward D · 2008: -44.9pp · 2024: -42.4pp
- All cycles
- 2024: R+42.4 2020: R+39.1 2016: R+47.8 2012: R+49.4 2008: R+44.9
Not yet ingested
- Civics
- —
Market trends
- HPI YoY
- ▼ -51.48%
- Current HPI
- 265.9926
- Rent YoY
- ▲ 1.17%
- Metro
- Crestview-Fort Walton Beach-Destin, FL
- State GDP YoY
- ▲ 3.28%
- F500 in state
- 36
Industry mix (Fortune 500 HQ in FL)
| Industry | F500 HQs | Revenue |
|---|---|---|
| Industrial Technology | 2 | $29B |
|
||
| Insurance | 2 | $17B |
|
||
| Retail | 1 | $60B |
|
||
| Technology Distribution | 1 | $58B |
|
||
| Homebuilding | 1 | $35B |
|
||
| Technology Manufacturing | 1 | $35B |
|
||
Price history
+3005.3% since first listed18 events — show timeline
- 2026-05-10 Listed $295,000 ECAR
- 2017-05-22 Listing Removed — NAMLS
- 2013-04-26 Listed $149,900 ECAR
- 2013-04-26 Listed $149,900 NAMLS
- 2012-10-25 Listed $155,900 ECAR
- 2008-08-21 Sold (Public Records) $153,500 Public Records
- 2008-08-15 Sold (MLS) $153,500 ECAR
- 2007-11-16 Listed $157,000 ECAR
- 2007-11-15 Listing Removed — NAMLS
- 2007-05-15 Listing Removed — NAMLS
- 2007-05-15 Listed $182,500 NAMLS
- 2007-05-15 Listed $176,000 NAMLS
- 2007-05-15 Listed $182,500 ECAR
- 2007-05-15 Listed $176,000 ECAR
- 2006-03-14 Listing Removed — NAMLS
- 2005-09-14 Listed $219,900 NAMLS
- 2005-09-14 Listed $219,900 ECAR
- 1998-10-01 Sold (Public Records) $9,500 Public Records
Property tax history
+4.0%/yrLatest (2025): $1,579 · -1.2% YoY. Source: county tax records.
Cash-flow waterfall
monthlySold comps — $/sqft
last 12 mo · ≤1 miLoading sold comps…