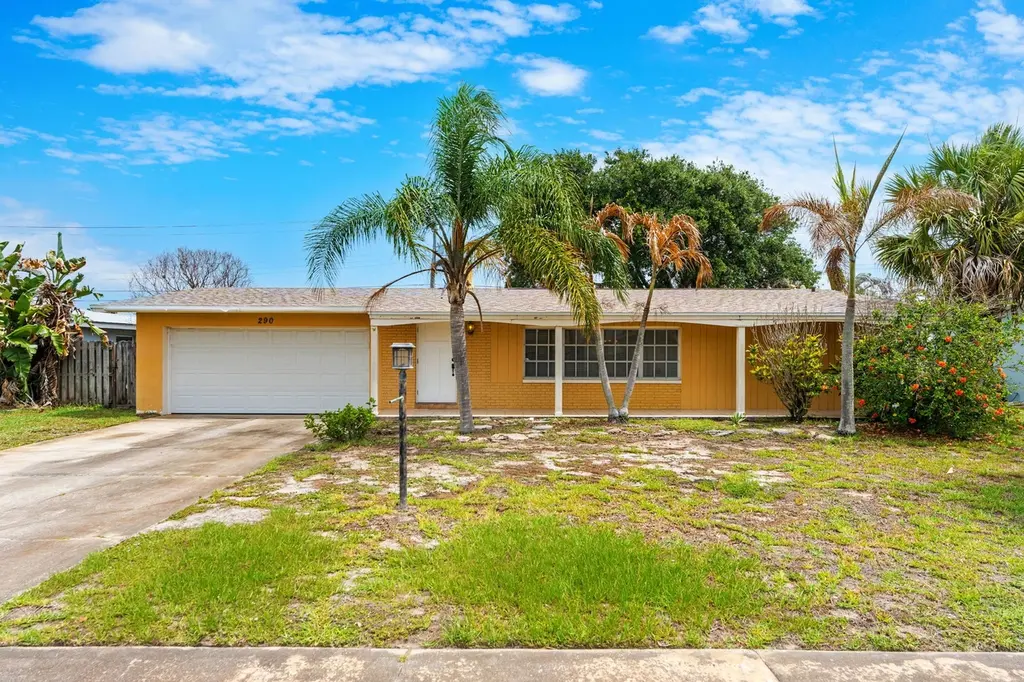
290 Carissa Dr · Satellite Beach, FL
Flood risk No data
- FEMA flood zone
- —
- Chance of flooding over 30 yrs
- —
- Est. flood insurance / yr
- —
Fire risk No data
- Est. fire insurance / yr
- —
Heat risk No data
- Hot days now (above threshold)
- —
- Hot days in 30 yrs
- —
Wind risk No data
- Chance of severe wind over 30 yrs
- —
Air-quality risk No data
- Unhealthy air days now
- —
- Unhealthy air days in 30 yrs
- —
Risk factors via First Street. Map © Google.
Why this score? — see what drove the D grade
The composite is a weighted blend of 9 inputs, each scored 0–100. Each bar is that input's sub-score; the figure is the points it added to the 100-point composite (weight × sub-score).
- Cash flow +12.1/30.0
- ARV discount +7.5/15.0
- Schools +4.7/10.0
- Livability +4.2/5.0
- DSCR +3.6/10.0
- 1% rule +3.5/10.0
- Rent growth +2.9/5.0
- Condition / age +2.5/5.0
- Appreciation +0.0/10.0
$399,000
🖨 Deal sheet (PDF) 📄 Offer letter ✓ Due diligence
Listing remarks
* * Multiple Offers Received * * HIGHEST AND BEST DUE SUNDAY 6/7 BY 6 PM EST * * Just blocks from the shoreline, this home places you in the true heart of Satellite Beach, where surf, sand, and seaside living are part of the everyday rhythm. Positioned near DeSoto and only four blocks to the beach, it's perfectly set for morning bike rides to the ocean or sunset walks along the sand. Recent upgrades add peace of mind and comfort, including a 2021 electrical panel replacement and a fully reimagined enclosed porch with new windows and flooring--an inviting space that blurs the line between indoors and coastal breezes. With more improvements on the horizon, this property embodies the relaxe
Key facts
- Enclosed porch
- 9,148 sq ft lot
- 2 garage spots
Tags
Property features AI
Exterior
- Home design: Single-family property
- Exterior features: Private patio; Garden
Interior
- Bedrooms: 3 bedrooms
- Bathrooms: 2 bathrooms
- Heating & cooling: Air conditioning
- Interior features: Fireplace
- Laundry & utility: Washer/dryer hookup
Neighborhood map
What this means for you Summary
Snapshot
- This is a 3-bed/2.0-bath single-family listed at $399k.
Deal economics
- At list price, monthly cash flow is $-86 ($-1k/yr) — negative.
- To cash-flow at today's rent, offer at most $387k (3.1% below list).
- To meet the 1% rule (rent ≥ 1% of price), the offer needs to be $338k (15.2% below list).
- Recommended offer: $338k (15.2% below list) — sets the bar for 1% rule.
Location & tenants
- Location reads 83/100 on livability (#45 in FL, #856 nationally) — a professional / high-income tenant draw. Strengths: schools A+, crime A+, employment A+; Watch: cost of living D, amenities F.
- Brevard (suburban): math 53% / reading 57% proficiency, ranked #19 of 73 in FL (top 26%) — acceptable for families but not a draw, mixed tenant base, ~2y average lease.
- Market conditions: Rents rising (+1.6%/yr); 312 active listings in the ZIP; 30 comparable units currently listed for rent nearby; rentals at typical pace (median 24d on market — plan ~3-4 weeks tenant-placement turnaround); solid renter incomes; 4,602 units permitted in Brevard County in 2024 (702 in 5+ unit buildings).
- This rent runs 40% of the median local income ($101k/yr) — at the standard rent-burdened threshold; future hikes will face affordability resistance.
Forward outlook
- Local home prices are declining (-3.0%/yr); year-one equity from $3k of loan paydown is wiped out by about $12k of value loss. Plan a longer hold.
- Brevard County population projected at +15% by 2050 — modest demand growth; plan on rents tracking national, not racing it.
Negotiation context
- Only 9 days on market — expect competitive offers; lowballing is unlikely to land.
Questions for the listing agent
- What do current leases actually rent for vs. the listed asking? Can we see a recent rent roll and the last 12 months of T-12 income?
- Built in 1964 — when were the roof, HVAC, electrical panel, plumbing, and water heater last replaced?
- Is there a deadline driving the sale (1031 exchange, divorce, estate, relocation)? That informs how much negotiation room exists.
- Schools are A-rated — typically a magnet for longer-tenancy family renters. What's the average tenant stay here, and is there a school-zone premium baked into asking?
- The area grade is low — what's the realistic commute time and amenity access for the typical tenant pool here? Any planned neighborhood developments (good or bad) we should know about?
- What's the average days-on-market for RENTAL listings here right now (not sales)? A rising rental-DOM trend means longer vacancies and softer asking-rent achievability than the comps imply.
- What's the recent tenant-quality profile in this submarket — average credit score on applications, eviction rate, late-payment / NSF rate, and stable-employment percentage? A property-management company in the area should have these aggregated.
- How much new for-sale + rental construction is in the pipeline within 1–3 miles? Heavy new supply typically softens prices + rents 12–24 months out; constrained supply supports both.
Investment metrics
- 1% rule
- 0.85% ✗
- Cap rate
- 6.04%
- Cash-on-cash
- -0.92%
- DSCR
- 0.96
- GRM
- 9.8
CMA / ARV
No comps found within radius.
Projected returns pro-forma
-3.0% appreciation · 1.55% rent growth · sell at horizon
- IRR
- -19.4%
- Equity multiple
- 0.33×
- Total profit
- $-74,915
- Equity at exit
- $59,492
- IRR
- -15.5%
- Equity multiple
- 0.18×
- Total profit
- $-91,426
- Equity at exit
- $34,498
Cash invested: $111,720 (down + closing). Projections, not guarantees.
Landlord ↔ Tenant lean methodology
- Overall (STATE)
- 87 Strongly Landlord-Friendly
- State Florida
- 87 Strongly Landlord-Friendly · R+3
- County
- — inherits STATE
- City
- — inherits STATE
ZIP-level market 32937
- Rents YoY
- 1.6%
- Active inventory
- 312
- Price-to-rent
- 9.8×
Monthly cashflow live
- Estimated rent
- $3,382 high interval (Pro) →
- Mortgage (P&I)
- −$2,092
- Tax est. 1.5%
- −$499 /mo · $5,985/yr
- Insurance
- −$166
- HOA
- −$0
- Vacancy / Maint / Mgmt
- −$710
- Net cashflow
- $-86
Break-even live
Sensitivity live
| Price | -10% $190 | -5% $52 | +0% $-86 | +5% $-223 | +10% $-361 |
|---|---|---|---|---|---|
| Rent | -10% $-353 | -5% $-219 | +0% $-86 | +5% $48 | +10% $182 |
| Rate | -1.0pp $115 | -0.5pp $16 | base $-86 | +0.5pp $-189 | +1.0pp $-294 |
UW: 25.0% down · 7.5% · 30yr · 1.5% tax · 5.0% vac · 8.0% maint · 8.0% mgmt
Financing live
Cash to close
- Down payment
- $99,750
- Closing costs
- $11,970
- Reserves months
- —
- Total cash needed
- —
Loan-product check · same deal, 3 products live
Conventional
25% down · 7.5% · 30yr
- Down + closing
- —
- Monthly P&I
- —
- Monthly cashflow
- —
- DSCR
- —
- Eligible?
- —
Personal DTI + credit; lowest rate.
DSCR
20% down · 8.5% · 30yr
- Down + closing
- —
- Monthly P&I
- —
- Monthly cashflow
- —
- DSCR
- —
- Eligible?
- —
No personal income docs; deal must DSCR.
Hard money
10% down · 12.0% · 12mo
- Down + closing
- —
- Monthly P&I
- —
- Monthly cashflow
- —
- DSCR
- —
- Eligible?
- —
Short-term bridge; refi at stabilization.
Rent comps 30 comps
| Address | Beds | Baths | Sqft | Rent | $/sqft | DOM | Units | Dist |
|---|---|---|---|---|---|---|---|---|
| 360 Desoto Pkwy Satellite Beach, FL | 3.0 | 2.0 | 1679 | $3,200 | $1.91 | 24d | 1 | 0.17mi |
| 571 Kale St Satellite Beach, FL | 4.0 | 2.0 | 1976 | $3,700 | $1.87 | 24d | 1 | 0.21mi |
| 230 Robert Ct Satellite Beach, FL | 3.0 | 2.0 | 2000 | $4,000 | $2.00 | 24d | 1 | 0.35mi |
| 265 Kings Way Satellite Beach, FL | 2.0 | 2.5 | 1530 | $2,395 | $1.57 | 24d | 1 | 0.36mi |
| 589 Coconut St Unit 1546106P Satellite Beach, FL | 4.0 | 2.0 | 2142 | $6,451 | $3.01 | 15d | 1 | 0.37mi |
| 159 Queens Ct Satellite Beach, FL | 2.0 | 2.0 | 1450 | $2,850 | $1.97 | 24d | 1 | 0.40mi |
| 125 Kings Way Satellite Beach, FL | 2.0 | 2.5 | 1530 | $2,500 | $1.63 | 24d | 1 | 0.42mi |
| 145 Cinnamon Dr Melbourne, FL | 1.0–3.0 | 1.0–2.0 | 1536 | $2,079 | $1.35 | 14d | 18 | 0.48mi |
| 408 Hawthorne Ct Indian Harbour Beach, FL | 3.0 | 2.0 | 1367 | $2,295 | $1.68 | 24d | 1 | 0.52mi |
| 658 Atlantic Dr Satellite Beach, FL | 2.0 | 2.5 | 1470 | $2,200 | $1.50 | 24d | 1 | 0.53mi |
| 239 Glenwood Ave Satellite Beach, FL | 3.0 | 2.0 | 1548 | $3,200 | $2.07 | 15d | 1 | 0.56mi |
| 180 Glenwood Ave Satellite Beach, FL | 2.0 | 2.0 | 1779 | $3,000 | $1.69 | 24d | 1 | 0.61mi |
| 440 Hawthorne Ct Indian Harbour Beach, FL | 2.0 | 2.0 | 1300 | $2,299 | $1.77 | 24d | 1 | 0.63mi |
| 39 Anchor Dr Indian Harbour Beach, FL | 2.0 | 2.0 | 1304 | $2,395 | $1.84 | 24d | 1 | 0.69mi |
| 1280 Jimmy Buffett Memorial Hwy Unit D Satellite Beach, FL | 3.0 | 2.5 | 1800 | $2,700 | $1.50 | 24d | 1 | 0.73mi |
| 5 Park Ave Satellite Beach, FL | 3.0 | 2.5 | 1300 | $8,000 | $6.15 | 24d | 1 | 0.80mi |
| 165 Seawind Dr #18 Satellite Beach, FL | 2.0 | 2.5 | 1620 | $2,200 | $1.36 | 15d | 1 | 0.84mi |
| 799 Shell St Satellite Beach, FL | 3.0 | 2.5 | 1248 | $3,950 | $3.17 | 24d | 1 | 0.88mi |
| 1811 Highway A1A #2104 Indian Harbour Beach, FL | 3.0 | 2.0 | 1720 | $3,200 | $1.86 | 24d | 1 | 0.89mi |
| 1791 Jimmy Buffett Memorial Hwy Unit 1103 Indian Harbour Beach, FL | 3.0 | 2.0 | 1720 | $4,400 | $2.56 | 24d | 1 | 0.91mi |
| 1175 Jimmy Buffett Memorial Hwy Unit 606 IND HBR BCH, FL | 3.0 | 2.0 | 1380 | $3,300 | $2.39 | 24d | 1 | 0.96mi |
| 1175 Highway A1A #408 Satellite Beach, FL | 2.0 | 2.0 | 1470 | $4,000 | $2.72 | 24d | 1 | 1.00mi |
| 1125 Highway A1A #502 Satellite Beach, FL | 2.0 | 2.0 | 1392 | $3,100 | $2.23 | 19d | 1 | 1.11mi |
| 1109 Seminole Dr Unit 1464868P Satellite Beach, FL | 4.0 | 2.0 | 1872 | $6,688 | $3.57 | 15d | 1 | 1.11mi |
| 1125 Jimmy Buffett Memorial Hwy Unit 502 Satellite Beach, FL | 2.0 | 2.0 | 1392 | $2,800 | $2.01 | 15d | 1 | 1.11mi |
| 157 Kristi Dr Indian Harbour Beach, FL | 2.0 | 2.5 | 1296 | $2,500 | $1.93 | 24d | 1 | 1.16mi |
| 1045 Highway A1A #304 Satellite Beach, FL | 3.0 | 2.0 | 1911 | $4,800 | $2.51 | 24d | 1 | 1.31mi |
| 115 Lancha Cir #204 Satellite Beach, FL | 3.0 | 2.0 | 2116 | $2,700 | $1.28 | 15d | 1 | 1.33mi |
| 265 Marion St Indian Harbour Beach, FL | 4.0 | 2.0 | 1724 | $5,500 | $3.19 | 24d | 1 | 1.45mi |
| 215 Marion St Indian Harbour Beach, FL | 4.0 | 2.0 | 2105 | $3,500 | $1.66 | 15d | 1 | 1.49mi |
Listing history 10 events
-
2026-06-14statusdays on market $399,000 Pending 9 DOM
-
2026-06-10days on market $399,000 Active Under Contract 6 DOM
-
2026-06-09status $399,000 Active Under Contract 4 DOM
-
2026-06-08days on market $399,000 Active 4 DOM
-
2026-06-07remarks 699-char remark
-
2026-06-07days on market $399,000 Active 3 DOM
-
2026-06-05remarks 679-char remark
-
2026-06-05status $399,000 Active 1 DOM
-
2026-06-03remarks 572-char remark
-
2026-06-03$399,000 Coming Soon 1 DOM
ⓘ Source: listings_history table (triggers on properties + properties_extension) + one-shot
backfill from property_details.listing_events for pre-trigger history.
Nearby sold comps map
Loading sold comps map…
Walkable amenities ~0.75 mi
Loading nearby amenities…
Taxation est. · year 1
- Rental income
- $40,586
- − Mortgage interest
- −$22,350
- − Property taxes
- −$5,985
- − Insurance
- −$1,995
- − Repairs & maintenance
- −$3,247
- − Management
- −$3,247
- − Depreciation
- −$11,607
- Taxable loss
- −$7,846
- Est. tax savings @ 24.0%
- +$1,883
- After-tax cash flow
- $857/yr
For passive investors: Depreciation is non-cash, so a rental often shows a tax loss while cash-flowing — sheltering income. Rental losses are passive: they offset passive income freely, and up to $25,000/yr can offset ordinary (W-2) income if you actively participate and your MAGI is under $100k (phasing out to $0 by $150k); unused losses carry forward. On sale, claimed depreciation is recaptured at up to 25%, and gains may owe capital-gains tax (a 1031 exchange can defer both). Figures are a year-1 estimate at your 24.0% rate — not tax advice; consult a CPA.
Schools (NCES district)
- District
- Brevard
- NCES district ID
- 1200150
- Math proficiency
- 53% ▼ -9.00%
- Reading proficiency
- 57% ▼ -4.00%
- Median HH income
- $49,426
- Composite
- 46.86/100
- National rank
- #2370
- State rank
- #19 of 73 in FL
Livability — Satellite Beach
- Score
- 83/100
- State rank
- #45
- US rank
- #856
Category grades
Schools grade is shown separately in the Schools card above.
Census & demographics
- Census place
- Satellite Beach, FL
- County
- Brevard County · 602,871 people
- City population
- 27,836
- Metro
- Palm Bay-Melbourne-Titusville, FL
- Population (ZIP)
- 27,836
- Household income
- $101,184
- Rent vs Own
- Severe rent burden
- 534.0
Population outlook (Brevard County) Hauer SSP2
- Today (2025)
- 623,254 people
- By 2030
- 648,420 · +4.0%
- By 2040
- 690,009 · +10.7%
- By 2050
- 715,669 · +14.8%
- By 2075
- 775,744 · +24.5%
- By 2100
- 776,687 · +24.6%
Race, ethnicity, and origin ACS 2023
- Neighborhood character
- Predominantly White (82%)
- Race & ethnicity
- White 82% Hispanic / Latino 9% Two or more races 7% Asian 2% Black 1%
- Hispanic origin (detail)
- Mexican 1% Puerto Rican 2%
- Common ancestry
- Romanian 3% Lithuanian 3% Italian 2%
- Foreign-born
- 4% · Canada
- Languages at home
- 95% English-only · Spanish 3% Other Indo-European 1%
Political lean MEDSL · Brevard
- 2024 margin
- Strong R (+20.8) · D 39.1% · R 59.9% · Other 1.0%
- 2008→2024 swing
- -10.4pp toward R · 2008: -10.4pp · 2024: -20.8pp
- All cycles
- 2024: R+20.8 2020: R+16.4 2016: R+19.8 2012: R+12.7 2008: R+10.4
Not yet ingested
- Civics
- —
Market trends
- HPI YoY
- ▼ -336.76%
- Current HPI
- 361.3801
- Rent YoY
- ▲ 1.55%
- Metro
- Palm Bay-Melbourne-Titusville, FL
- State GDP YoY
- ▲ 3.28%
- F500 in state
- 36
Industry mix (Fortune 500 HQ in FL)
| Industry | F500 HQs | Revenue |
|---|---|---|
| Industrial Technology | 2 | $29B |
|
||
| Insurance | 2 | $17B |
|
||
| Retail | 1 | $60B |
|
||
| Technology Distribution | 1 | $58B |
|
||
| Homebuilding | 1 | $35B |
|
||
| Technology Manufacturing | 1 | $35B |
|
||
Cash-flow waterfall
monthlySold comps — $/sqft
last 12 mo · ≤1 miLoading sold comps…