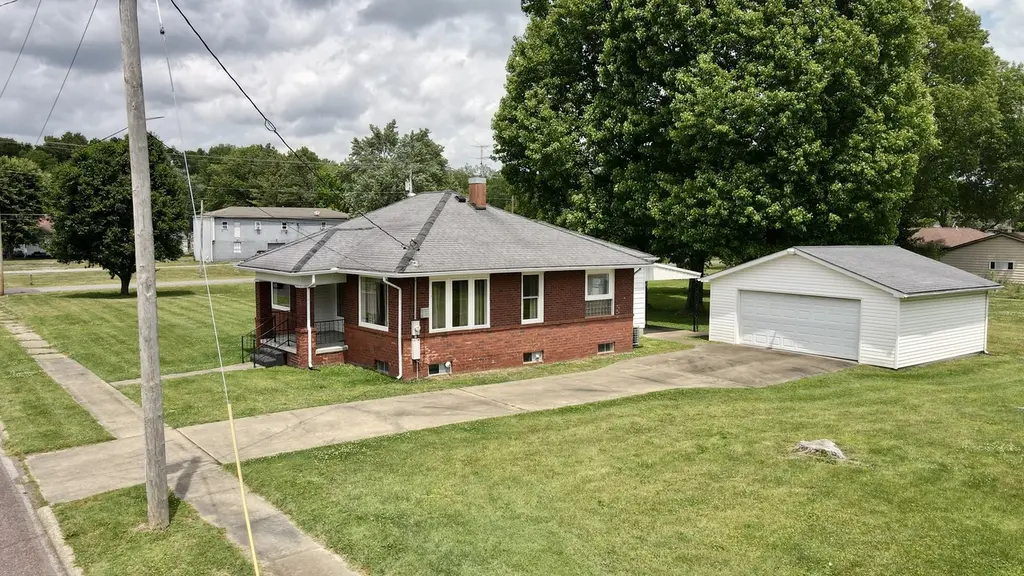
606 S Monroe St · West Frankfort, IL
Flood risk 1/10 · Minimal
- FEMA flood zone
- X (unshaded)
- Chance of flooding over 30 yrs
- 0.0%
- Est. flood insurance / yr
- $473 – $860
Fire risk 1/10 · Minimal
- Est. fire insurance / yr
- $804 – $1,492
Heat risk 5/10 · Moderate
- Hot days now (above 107°F)
- 7 days/yr
- Hot days in 30 yrs
- 20 days/yr
Wind risk 2/10 · Minimal
- Chance of severe wind over 30 yrs
- 3.0%
Air-quality risk 2/10 · Minimal
- Unhealthy air days now
- 0 days/yr
- Unhealthy air days in 30 yrs
- 1 days/yr
Risk factors via First Street. Map © Google.
Why this score? — see what drove the C- grade
The composite is a weighted blend of 9 inputs, each scored 0–100. Each bar is that input's sub-score; the figure is the points it added to the 100-point composite (weight × sub-score).
- Cash flow +23.5/30.0
- DSCR +7.6/10.0
- ARV discount +6.3/15.0
- 1% rule +6.1/10.0
- Livability +2.8/5.0
- Rent growth +2.5/5.0
- Condition / age +2.5/5.0
- Schools +0.9/10.0
- Appreciation +0.0/10.0
$75,000
🖨 Deal sheet (PDF) 📄 Offer letter ✓ Due diligence
Listing remarks
Neat and clean! Brick bungalow on a quiet corner lot with a partial basement and a 24x21 detached garage. Nicely updated with new windows in 2025, water heater in 2024, Garage siding in 2020, basement waterproofed in 2006, and newer kitchen appliances. The home has been monitored and kept under contract with a professional pest service and also have routinely serviced and maintained the HVAC system with a qualified service tech.
Key facts
- Brick bungalow
- Garage siding
- Partial basement
Tags
Property features AI
Finance
- Other: Fee simple ownership; Property is in an unincorporated area (Frankfort township); Possession at closing
- HOA & community: No master association fees required
Exterior
- Parking: Detached garage owned (2 garage spaces, 2 total parking spaces)
- Utilities: Public water; Public sewer; Public power
- Home design: Detached single-family home; One-story
- Construction: Brick construction; Built approximately 91–100 years ago; Built before 1978
- Exterior features: Corner lot; Lot dimensions approximately 150 x 158; Lot size between 0.50 and 0.99 acre
Interior
- Kitchen: Main level kitchen (12 x 11)
- Bedrooms: Main level master bedroom (11 x 10); Additional bedroom(s) and possible bedroom noted
- Bathrooms: One full bathroom; One half bathroom
- Heating & cooling: Natural gas heating; Central air conditioning
- Interior features: Five total rooms; Separate dining room; Unfinished partial basement
- Laundry & utility: Laundry room
Neighborhood map
What this means for you Summary
Snapshot
- This is a 1-bed/1.5-bath single-family listed at $75k.
Deal economics
- At list price, monthly cash flow is $140 ($2k/yr) — positive.
- The deal already cash-flows at list — no discount required.
- Meets the 1% rule at list price ($834 rent vs $75k).
- Cap rate 8.5% vs local median 5.9% in West Frankfort — top-decile yield for the area; either an underpriced asset or a hidden risk that comps aren't pricing in. Stress-test before assuming the spread holds.
Location & tenants
- Location reads 56/100 on livability (#1,210 in IL) — a working-class tenant base; expect higher turnover. Strengths: cost of living A+, housing A+; Watch: crime D, schools F, amenities F.
- Frankfort CUSD 168 (town): math 6% / reading 16% proficiency, ranked #577 of 620 in IL (top 93%) — low school quality limits family demand, transient renter base, plan for 1-2y turnover.
- Market conditions: 90 active listings in the ZIP; 2 comparable units currently listed for rent nearby; 17 units permitted in Franklin County in 2024 (0 in 5+ unit buildings).
Forward outlook
- Local home prices are declining (-3.0%/yr); year-one equity from $519 of loan paydown is wiped out by about $2k of value loss. Plan a longer hold.
- Franklin County population projected at -16% by 2050 — secular population decline; favor cash flow + early exit over multi-decade hold.
Negotiation context
- Only 8 days on market — expect competitive offers; lowballing is unlikely to land.
Risks & watch-outs
- Climate carrying-cost: extreme-heat days projected 7→20/yr by 2055 (HVAC capex compounding) — expect insurance premiums to compound above CPI over the hold.
Questions for the listing agent
- Is there a deadline driving the sale (1031 exchange, divorce, estate, relocation)? That informs how much negotiation room exists.
- Schools are F-rated, which usually means shorter tenancies and higher turnover. Who's the typical renter profile here, and what's been the actual vacancy rate?
- Crime grade is D in this area — have there been break-ins, vandalism, or insurance claims at this property in the last 3 years? What carrier currently insures it and at what premium?
- What's the average days-on-market for RENTAL listings here right now (not sales)? A rising rental-DOM trend means longer vacancies and softer asking-rent achievability than the comps imply.
- What's the recent tenant-quality profile in this submarket — average credit score on applications, eviction rate, late-payment / NSF rate, and stable-employment percentage? A property-management company in the area should have these aggregated.
- How much new for-sale + rental construction is in the pipeline within 1–3 miles? Heavy new supply typically softens prices + rents 12–24 months out; constrained supply supports both.
Investment metrics
- 1% rule
- 1.11% ✓
- Cap rate
- 8.54%
- Cash-on-cash
- 8.02%
- DSCR
- 1.36
- GRM
- 7.5
CMA / ARV
- ARV (on-the-fly)
- $73,000
- Comps found
- 12
Show comp detail 12 sales within ~0.75 mi
| Address | Dist | Beds/Ba | Sqft | Sold | Price | $/sf | Match |
|---|---|---|---|---|---|---|---|
| 606 S Monroe St | 0.00mi | 1/1.5 | 1,000 (0%) | 0mo | $70,000 | $70 | 100 |
| 503 S Lincoln St | 0.19mi | 2/1.0 (+1) | 964 (-4%) | 3mo | $90,000 | $93 | 75 |
| 801 E Garland St | 0.26mi | 1/1.0 | 925 (-8%) | 22mo | $67,500 | $73 | 55 |
| 801 E Garland St | 0.26mi | 1/1.0 | 925 (-8%) | 22mo | $67,500 | $73 | 55 |
| 505 W Jones St | 0.66mi | 2/1.0 (+1) | 1,000 (0%) | 13mo | $85,780 | $86 | 52 |
| 505 W Jones St | 0.66mi | 2/1.0 (+1) | 1,000 (0%) | 13mo | $85,780 | $86 | 52 |
| 602 S Lincoln St | 0.21mi | 2/1.0 (+1) | 1,140 (+14%) | 17mo | $99,000 | $87 | 46 |
| 1212 E ST Louis St | 0.70mi | 2/1.0 (+1) | 1,000 (0%) | 22mo | $83,000 | $83 | 42 |
| 1104 E Oak St | 0.49mi | 2/1.0 (+1) | 1,105 (+10%) | 14mo | $79,500 | $72 | 41 |
| 1104 E Oak St | 0.49mi | 2/1.0 (+1) | 1,105 (+10%) | 14mo | $79,500 | $72 | 41 |
| 608 E Lindell St | 0.57mi | 2/1.0 (+1) | 1,128 (+13%) | 15mo | $35,000 | $31 | 32 |
| 607 W Jones St | 0.74mi | 2/1.0 (+1) | 960 (-4%) | 24mo | $13,965 | $15 | 32 |
Match score weights: distance 35% · size 25% · config 20% · recency 20%. Top-matched comps best support the ARV.
Projected returns pro-forma
-3.0% appreciation · 3.0% rent growth · sell at horizon
- IRR
- -4.1%
- Equity multiple
- 0.85×
- Total profit
- $-3,201
- Equity at exit
- $11,183
- IRR
- 5.6%
- Equity multiple
- 1.42×
- Total profit
- $8,774
- Equity at exit
- $6,485
Cash invested: $21,000 (down + closing). Projections, not guarantees.
Landlord ↔ Tenant lean methodology
- Overall (STATE)
- 43 Moderately Tenant-Leaning
- State Illinois
- 43 Moderately Tenant-Leaning · D+7
- County
- — inherits STATE
- City
- — inherits STATE
ZIP-level market 62896
- Active inventory
- 90
- Price-to-rent
- 7.5×
Monthly cashflow live
- Estimated rent
- $834 medium interval (Pro) →
- Mortgage (P&I)
- −$393
- Tax est. 1.5%
- −$94 /mo · $1,125/yr
- Insurance
- −$31
- HOA
- −$0
- Vacancy / Maint / Mgmt
- −$175
- Net cashflow
- $140
Break-even live
Sensitivity live
| Price | -10% $192 | -5% $166 | +0% $140 | +5% $114 | +10% $89 |
|---|---|---|---|---|---|
| Rent | -10% $74 | -5% $107 | +0% $140 | +5% $173 | +10% $206 |
| Rate | -1.0pp $178 | -0.5pp $159 | base $140 | +0.5pp $121 | +1.0pp $101 |
UW: 25.0% down · 7.5% · 30yr · 1.5% tax · 5.0% vac · 8.0% maint · 8.0% mgmt
Financing live
Cash to close
- Down payment
- $18,750
- Closing costs
- $2,250
- Reserves months
- —
- Total cash needed
- —
Loan-product check · same deal, 3 products live
Conventional
25% down · 7.5% · 30yr
- Down + closing
- —
- Monthly P&I
- —
- Monthly cashflow
- —
- DSCR
- —
- Eligible?
- —
Personal DTI + credit; lowest rate.
DSCR
20% down · 8.5% · 30yr
- Down + closing
- —
- Monthly P&I
- —
- Monthly cashflow
- —
- DSCR
- —
- Eligible?
- —
No personal income docs; deal must DSCR.
Hard money
10% down · 12.0% · 12mo
- Down + closing
- —
- Monthly P&I
- —
- Monthly cashflow
- —
- DSCR
- —
- Eligible?
- —
Short-term bridge; refi at stabilization.
Rent comps 2 comps
| Address | Beds | Baths | Sqft | Rent | $/sqft | DOM | Units | Dist |
|---|---|---|---|---|---|---|---|---|
| 411 N Cochran St West Frankfort, IL | 2.0 | 1.0 | 960 | $795 | $0.83 | 44d | 1 | 0.77mi |
| 5 Razer Dr Unit 1 West Frankfort, IL | 2.0 | 1.5 | 1100 | $900 | $0.82 | 44d | 1 | 1.24mi |
Listing history 1 events
-
2026-05-20$82,000 Active
ⓘ Source: listings_history table (triggers on properties + properties_extension) + one-shot
backfill from property_details.listing_events for pre-trigger history.
Climate risk First Street
- Flood 1/10 Low FEMA zone X (unshaded) · 0% chance over 30 yrs
- Wildfire 1/10 Low
- Heat 5/10 Major 7 d/yr ≥107°F today · 20 d/yr by 30 yrs out
- Wind 2/10 Low 3% chance of damaging wind over 30 yrs
- Air quality 2/10 Low 0 unhealthy d/yr today · 1 by 30 yrs out
Nearby sold comps map
Loading sold comps map…
Walkable amenities ~0.75 mi
Loading nearby amenities…
Taxation est. · year 1
- Rental income
- $10,005
- − Mortgage interest
- −$4,201
- − Property taxes
- −$1,125
- − Insurance
- −$375
- − Repairs & maintenance
- −$800
- − Management
- −$800
- − Depreciation
- −$2,182
- Taxable income
- $521
- Est. tax owed @ 24.0%
- −$125
- After-tax cash flow
- $1,559/yr
For passive investors: Depreciation is non-cash, so a rental often shows a tax loss while cash-flowing — sheltering income. Rental losses are passive: they offset passive income freely, and up to $25,000/yr can offset ordinary (W-2) income if you actively participate and your MAGI is under $100k (phasing out to $0 by $150k); unused losses carry forward. On sale, claimed depreciation is recaptured at up to 25%, and gains may owe capital-gains tax (a 1031 exchange can defer both). Figures are a year-1 estimate at your 24.0% rate — not tax advice; consult a CPA.
Schools (NCES district)
- District
- Frankfort CUSD 168
- NCES district ID
- 1741580
- Math proficiency
- 6% ▼ -9.00%
- Reading proficiency
- 16% ▼ -10.00%
- Median HH income
- $34,447
- Composite
- 8.93/100
- National rank
- #9886
- State rank
- #577 of 620 in IL
Livability — West Frankfort
- Score
- 56/100
- State rank
- #1210
- US rank
- #22742
Category grades
Schools grade is shown separately in the Schools card above.
Census & demographics
- Census place
- West Frankfort, IL
- City population
- 10,691
- Population (ZIP)
- 10,691
Population outlook (Franklin County) Hauer SSP2
- Today (2025)
- 37,954 people
- By 2030
- 36,828 · -3.0%
- By 2040
- 34,452 · -9.2%
- By 2050
- 31,855 · -16.1%
- By 2075
- 25,171 · -33.7%
- By 2100
- 18,462 · -51.4%
Race, ethnicity, and origin ACS 2023
- Neighborhood character
- Predominantly White (96%)
- Race & ethnicity
- White 96% Two or more races 2%
- Common ancestry
- Romanian 2% Lithuanian 1% Iranian 1%
- Foreign-born
- 1% · Canada, Jamaica
- Languages at home
- 98% English-only · Spanish 1%
Political lean MEDSL · Franklin
- 2024 margin
- Solid R (+50.6) · D 24.1% · R 74.6% · Other 1.3%
- 2008→2024 swing
- -47.8pp toward R · 2008: -2.8pp · 2024: -50.6pp
- All cycles
- 2024: R+50.6 2020: R+47.5 2016: R+45.3 2012: R+16.8 2008: R+2.8
Not yet ingested
- Civics
- —
Market trends
- HPI YoY
- ▼ -94.00%
- Current HPI
- 86.36
- Rent YoY
- —
- Metro
- —
- State GDP YoY
- ▲ 1.59%
- F500 in state
- 60
Industry mix (Fortune 500 HQ in IL)
| Industry | F500 HQs | Revenue |
|---|---|---|
| Insurance | 4 | $201B |
|
||
| Consumer Goods | 4 | $87B |
|
||
| Industrial Machinery | 3 | $64B |
|
||
| Healthcare | 2 | $55B |
|
||
| Retail / Pharmacy | 1 | $148B |
|
||
| Agriculture / Food | 1 | $86B |
|
||
Price history
1 event — show timeline
- 2026-05-20 Listed $82,000 MRED as Distributed by MLS Grid
Cash-flow waterfall
monthlySold comps — $/sqft
last 12 mo · ≤1 miLoading sold comps…