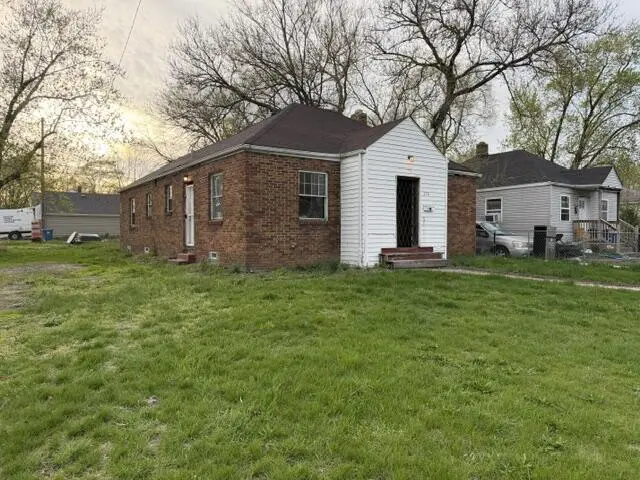
574 Ralston St · Gary, IN
Flood risk 5/10 · Moderate
- FEMA flood zone
- X (unshaded)
- Chance of flooding over 30 yrs
- 0.66%
- Est. flood insurance / yr
- $473 – $860
Fire risk 1/10 · Minimal
- Est. fire insurance / yr
- $717 – $1,331
Heat risk 3/10 · Minor
- Hot days now (above 103°F)
- 7 days/yr
- Hot days in 30 yrs
- 15 days/yr
Wind risk 2/10 · Minimal
- Chance of severe wind over 30 yrs
- 1.0%
Air-quality risk 4/10 · Minor
- Unhealthy air days now
- 5 days/yr
- Unhealthy air days in 30 yrs
- 6 days/yr
Risk factors via First Street. Map © Google.
Why this score? — see what drove the B+ grade
The composite is a weighted blend of 9 inputs, each scored 0–100. Each bar is that input's sub-score; the figure is the points it added to the 100-point composite (weight × sub-score).
- Cash flow +30.0/30.0
- ARV discount +15.0/15.0
- 1% rule +10.0/10.0
- DSCR +10.0/10.0
- Appreciation +5.6/10.0
- Livability +3.7/5.0
- Rent growth +2.5/5.0
- Condition / age +2.5/5.0
- Schools +0.5/10.0
$49,000
🖨 Deal sheet (PDF) 📄 Offer letter ✓ Due diligence
Listing remarks MLS
Spacious All Brick Ranch in Convenient location with Split Floor Plan! Large Living Room is welcoming and leads into the HUGE Eat-IN Kitchen. Large Master with Double Closets, 2 Addtional Bedrooms and Full Bath with recent refreshing completed. Full Basement offers potential for more finished space! Newer water heater. Large Yard on Corner Lot. Don't Miss out on this one!
Key facts
- 5,662 sq ft lot
- Built 1942
- Listed 7 days
Property features AI
Exterior
- Utilities: Public water; Public sewer; 100 amp electric service
- Home design: Single-story home; Built in 1942
- Construction: Year built 1942
- Exterior features: No notable view
Interior
- Kitchen: Eat-in kitchen
- Bedrooms: Primary bedroom; Bedroom 2; Bedroom 3
- Bathrooms: 1 full bathroom
- Heating & cooling: Forced air heating (natural gas); No cooling
- Interior features: Eat-in kitchen; Full unfinished basement
- Laundry & utility: No built-in appliances listed
Neighborhood map
What this means for you Summary
Snapshot
- This is a 3-bed/1.0-bath single-family listed at $49k.
Deal economics
- At list price, monthly cash flow is $737 ($9k/yr) — positive.
- The deal already cash-flows at list — no discount required.
- Meets the 1% rule at list price ($1k rent vs $49k).
- Cap rate 24.3% vs local median 9.1% in Gary — top-decile yield for the area; either an underpriced asset or a hidden risk that comps aren't pricing in. Stress-test before assuming the spread holds.
Location & tenants
- Location reads 73/100 on livability (#105 in IN) — a middle-class / working-renter tenant base. Strengths: commute A+, cost of living A+, housing A+; Watch: schools F, crime F, employment F.
- Gary Community School Corporation (urban): math 3% / reading 11% proficiency, ranked #299 of 301 in IN (top 99%) — low school quality limits family demand, transient renter base, plan for 1-2y turnover; 80% free/reduced lunch — lower-income household profile, screen leases tightly.
- Market conditions: 54 active listings in the ZIP; 4 comparable units currently listed for rent nearby; rentals leasing fast (median 8d on market — plan ~1-2 weeks tenant-placement turnaround); 1,642 units permitted in Lake County in 2024 (14 in 5+ unit buildings).
Forward outlook
- In year one you build about $955 of equity ($339 loan paydown + $616 appreciation (1.3% local appreciation)).
- Lake County population projected to shrink 7% by 2050 — rents likely to lag national; underwrite the cash flow, not the appreciation.
- At projected returns (1.3% appreciation + 3.0% rent growth), your $14k cash investment doubles in ~2 years — after that, you're playing with house money.
Negotiation context
- Only 8 days on market — expect competitive offers; lowballing is unlikely to land.
- 3 sale attempts since 6y ago with the ask held roughly flat each time — persistent listings suggest the price (not the market) is what's stuck; bring a comps-based counter.
- Current owner paid $22k; list at $49k implies a 123% gain — meaningful room to come down on a strong offer.
Risks & watch-outs
- Watch-outs: built in 1942 — expect roof / HVAC / electrical / plumbing capex.
- Climate carrying-cost: moderate flood risk — expect insurance premiums to compound above CPI over the hold.
Questions for the listing agent
- Built in 1942 — when were the roof, HVAC, electrical panel, plumbing, and water heater last replaced?
- Is there a deadline driving the sale (1031 exchange, divorce, estate, relocation)? That informs how much negotiation room exists.
- Schools are F-rated, which usually means shorter tenancies and higher turnover. Who's the typical renter profile here, and what's been the actual vacancy rate?
- Crime grade is F in this area — have there been break-ins, vandalism, or insurance claims at this property in the last 3 years? What carrier currently insures it and at what premium?
- What's the average days-on-market for RENTAL listings here right now (not sales)? A rising rental-DOM trend means longer vacancies and softer asking-rent achievability than the comps imply.
- What's the recent tenant-quality profile in this submarket — average credit score on applications, eviction rate, late-payment / NSF rate, and stable-employment percentage? A property-management company in the area should have these aggregated.
- How much new for-sale + rental construction is in the pipeline within 1–3 miles? Heavy new supply typically softens prices + rents 12–24 months out; constrained supply supports both.
Investment metrics
- 1% rule
- 2.87% ✓
- Cap rate
- 24.33%
- Cash-on-cash
- 64.42%
- DSCR
- 3.87
- GRM
- 2.9
CMA / ARV
- ARV (on-the-fly)
- $91,640
- Comps found
- 12
Show comp detail 12 sales within ~0.75 mi
| Address | Dist | Beds/Ba | Sqft | Sold | Price | $/sf | Match |
|---|---|---|---|---|---|---|---|
| 4838 W 6th Ave | 0.29mi | 2/1.0 (-1) | 1,134 (-2%) | 6mo | $130,000 | $115 | 73 |
| 309 Matthews St | 0.45mi | 2/1.0 (-1) | 1,207 (+4%) | 1mo | $59,000 | $49 | 66 |
| 5247 W 3rd Ave | 0.33mi | 3/1.0 | 1,255 (+8%) | 7mo | $125,000 | $100 | 65 |
| 1047 Ralston St | 0.53mi | 2/1.0 (-1) | 1,174 (+1%) | 6mo | $100,000 | $85 | 64 |
| 809 Clinton St | 0.26mi | 3/1.0 | 1,008 (-13%) | 3mo | $28,000 | $28 | 63 |
| 779 Matthews St | 0.35mi | 3/1.0 | 1,055 (-9%) | 14mo | $45,000 | $43 | 57 |
| 293 Calhoun St | 0.48mi | 2/1.5 (-1) | 1,285 (+11%) | 1mo | $101,000 | $79 | 52 |
| 286 Gerry St | 0.44mi | 3/1.0 | 1,023 (-12%) | 12mo | $40,000 | $39 | 50 |
| 5309 W 4th Ave | 0.22mi | 2/2.0 (-1) | 1,290 (+11%) | 15mo | $22,000 | $17 | 50 |
| 160 Clark Rd | 0.61mi | 2/1.5 (-1) | 1,089 (-6%) | 11mo | $15,000 | $14 | 45 |
| 953 Colfax St | 0.67mi | 4/3.0 (+1) | 1,199 (+3%) | 7mo | $220,000 | $183 | 44 |
| 308 Hamlin St | 0.61mi | 3/1.5 | 1,015 (-12%) | 11mo | $125,000 | $123 | 39 |
Match score weights: distance 35% · size 25% · config 20% · recency 20%. Top-matched comps best support the ARV.
Projected returns pro-forma
1.26% appreciation · 3.0% rent growth · sell at horizon
- IRR
- 67.5%
- Equity multiple
- 4.53×
- Total profit
- $48,489
- Equity at exit
- $17,387
- IRR
- 68.5%
- Equity multiple
- 9.22×
- Total profit
- $112,778
- Equity at exit
- $23,624
Cash invested: $13,720 (down + closing). Projections, not guarantees.
Landlord ↔ Tenant lean methodology
- Overall (STATE)
- 90 Strongly Landlord-Friendly
- State Indiana
- 90 Strongly Landlord-Friendly · R+11
- County
- — inherits STATE
- City
- — inherits STATE
ZIP-level market 46406
- Home prices YoY
- 0.9%
- Active inventory
- 54
- Price-to-rent
- 2.9×
Monthly cashflow live
- Estimated rent
- $1,408 medium interval (Pro) →
- Mortgage (P&I)
- −$257
- Tax from tax record
- −$99 /mo · $1,184/yr
- Insurance
- −$20
- HOA
- −$0
- Vacancy / Maint / Mgmt
- −$296
- Net cashflow
- $737
Break-even live
Sensitivity live
| Price | -10% $764 | -5% $750 | +0% $737 | +5% $723 | +10% $709 |
|---|---|---|---|---|---|
| Rent | -10% $625 | -5% $681 | +0% $737 | +5% $792 | +10% $848 |
| Rate | -1.0pp $761 | -0.5pp $749 | base $737 | +0.5pp $724 | +1.0pp $711 |
UW: 25.0% down · 7.5% · 30yr · 1.5% tax · 5.0% vac · 8.0% maint · 8.0% mgmt
Financing live
Cash to close
- Down payment
- $12,250
- Closing costs
- $1,470
- Reserves months
- —
- Total cash needed
- —
Loan-product check · same deal, 3 products live
Conventional
25% down · 7.5% · 30yr
- Down + closing
- —
- Monthly P&I
- —
- Monthly cashflow
- —
- DSCR
- —
- Eligible?
- —
Personal DTI + credit; lowest rate.
DSCR
20% down · 8.5% · 30yr
- Down + closing
- —
- Monthly P&I
- —
- Monthly cashflow
- —
- DSCR
- —
- Eligible?
- —
No personal income docs; deal must DSCR.
Hard money
10% down · 12.0% · 12mo
- Down + closing
- —
- Monthly P&I
- —
- Monthly cashflow
- —
- DSCR
- —
- Eligible?
- —
Short-term bridge; refi at stabilization.
Rent comps 4 comps
| Address | Beds | Baths | Sqft | Rent | $/sqft | DOM | Units | Dist |
|---|---|---|---|---|---|---|---|---|
| 743 Hanley St Gary, IN | 3.0 | 1.0 | 800 | $1,350 | $1.69 | 0d | 1 | 0.19mi |
| 395 Porter St Gary, IN | 4.0 | 2.0 | 1472 | $1,700 | $1.15 | 7d | 1 | 0.50mi |
| 1043 Mount St Gary, IN | 3.0 | 1.0 | 750 | $1,200 | $1.60 | 0d | 1 | 0.56mi |
| 4232 W 20th Ave Gary, IN | 4.0 | 1.0 | 925 | $1,395 | $1.51 | 22d | 1 | 1.39mi |
Listing history 7 events
-
2026-06-21days on market $49,000 Active 8 DOM
-
2026-06-18days on market $49,000 Active 5 DOM
-
2026-06-17days on market $49,000 Active 4 DOM
-
2026-06-16days on market $49,000 Active 3 DOM
-
2026-06-15days on market $49,000 Active 2 DOM
-
2026-06-13remarks 350-char remark
-
2026-06-13$49,000 Active 1 DOM
ⓘ Source: listings_history table (triggers on properties + properties_extension) + one-shot
backfill from property_details.listing_events for pre-trigger history.
Tax reassessment forecast IN · Partial reset (capped growth)
- Current annual tax
- $1,184 · $99/mo
- Projected year-2 tax
- $1,184 · $99/mo
- Expected delta
- $0/yr ($0/mo · 0.0%)
ⓘ Screening estimate from a state-policy table — verify with the county assessor before closing.
Climate risk First Street
- Flood 5/10 Major FEMA zone X (unshaded) · 66% chance over 30 yrs
- Wildfire 1/10 Low
- Heat 3/10 Moderate 7 d/yr ≥103°F today · 15 d/yr by 30 yrs out
- Wind 2/10 Low 100% chance of damaging wind over 30 yrs
- Air quality 4/10 Moderate 5 unhealthy d/yr today · 6 by 30 yrs out
Nearby sold comps map
Loading sold comps map…
Walkable amenities ~0.75 mi
Loading nearby amenities…
Taxation est. · year 1
- Rental income
- $16,899
- − Mortgage interest
- −$2,745
- − Property taxes
- −$1,184
- − Insurance
- −$245
- − Repairs & maintenance
- −$1,352
- − Management
- −$1,352
- − Depreciation
- −$1,425
- Taxable income
- $8,596
- Est. tax owed @ 24.0%
- −$2,063
- After-tax cash flow
- $6,775/yr
For passive investors: Depreciation is non-cash, so a rental often shows a tax loss while cash-flowing — sheltering income. Rental losses are passive: they offset passive income freely, and up to $25,000/yr can offset ordinary (W-2) income if you actively participate and your MAGI is under $100k (phasing out to $0 by $150k); unused losses carry forward. On sale, claimed depreciation is recaptured at up to 25%, and gains may owe capital-gains tax (a 1031 exchange can defer both). Figures are a year-1 estimate at your 24.0% rate — not tax advice; consult a CPA.
Schools (NCES district)
- District
- Gary Community School Corporation
- NCES district ID
- 1803870
- Math proficiency
- 3% ▼ -10.00%
- Reading proficiency
- 11% ▼ -6.00%
- Median HH income
- $27,739
- Composite
- 4.98/100
- National rank
- #10039
- State rank
- #299 of 301 in IN
Livability — Gary
- Score
- 73/100
- State rank
- #105
- US rank
- #5592
Category grades
Schools grade is shown separately in the Schools card above.
Census & demographics
- Census place
- Gary, IN
- City population
- 63,701
- Population (ZIP)
- 8,513
Population outlook (Lake County) Hauer SSP2
- Today (2025)
- 484,026 people
- By 2030
- 478,091 · -1.2%
- By 2040
- 462,974 · -4.3%
- By 2050
- 449,894 · -7.1%
- By 2075
- 436,169 · -9.9%
- By 2100
- 426,607 · -11.9%
Race, ethnicity, and origin ACS 2023
- Neighborhood character
- Majority Black (63%)
- Race & ethnicity
- Black 63% White 21% Hispanic / Latino 13% Two or more races 7%
- Hispanic origin (detail)
- Mexican 7% Puerto Rican 3%
- Common ancestry
- Slovak 2% Italian 1% Lithuanian 1%
- Foreign-born
- 4% · Canada
- Languages at home
- 91% English-only · Spanish 8%
Political lean MEDSL · Lake
- 2024 margin
- Lean D (+5.6) · D 52.1% · R 46.5% · Other 1.5%
- 2008→2024 swing
- -28.6pp toward R · 2008: 34.3pp · 2024: 5.6pp
- All cycles
- 2024: D+5.6 2020: D+15.1 2016: D+20.6 2012: D+31.0 2008: D+34.3
Not yet ingested
- Civics
- —
Market trends
- HPI YoY
- ▲ 1.26%
- Current HPI
- 147.0732
- Rent YoY
- —
- Metro
- —
- State GDP YoY
- ▲ 2.90%
- F500 in state
- 18
Industry mix (Fortune 500 HQ in IN)
| Industry | F500 HQs | Revenue |
|---|---|---|
| Industrial Machinery | 2 | $37B |
|
||
| Healthcare | 1 | $177B |
|
||
| Pharmaceuticals | 1 | $45B |
|
||
| Metals / Steel | 1 | $18B |
|
||
| Agriculture | 1 | $17B |
|
||
| Packaging | 1 | $12B |
|
||
Price history
+63.9% since first listed6 events — show timeline
- 2026-06-13 Listed $49,000 NIRA MLS as Distributed by MLS Grid
- 2024-03-10 Rental Removed $1,200 BUILDIUM
- 2024-03-08 Listed for Rent $1,200 BUILDIUM
- 2022-08-21 Price Changed $1,250 BUILDIUM
- 2020-06-22 Sold (MLS) $22,000 NIRA MLS as Distributed by MLS Grid
- 2020-01-25 Listed $29,900 NIRA MLS as Distributed by MLS Grid
Property tax history
-9.3%/yrLatest (2024): $1,184 · +4.1% YoY. Source: county tax records.
Cash-flow waterfall
monthlySold comps — $/sqft
last 12 mo · ≤1 miLoading sold comps…