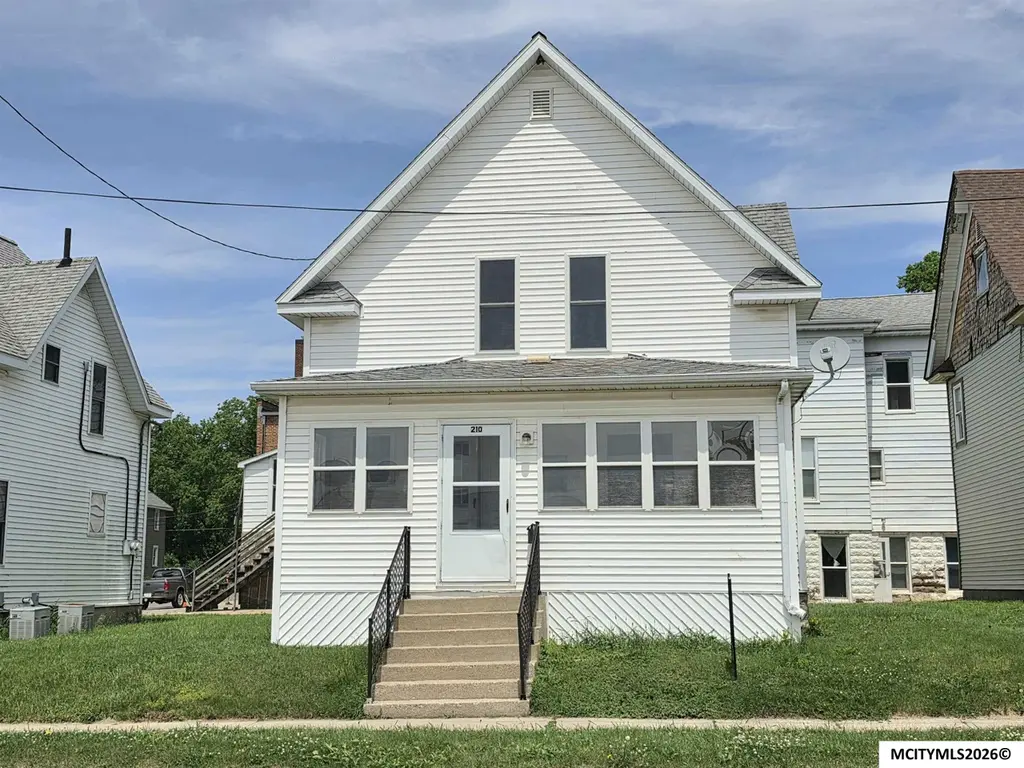
210 1st St SW · Mason City, IA
Flood risk 1/10 · Minimal
- FEMA flood zone
- X (unshaded)
- Chance of flooding over 30 yrs
- 0.0%
- Est. flood insurance / yr
- $473 – $860
Fire risk 3/10 · Minor
- Est. fire insurance / yr
- $902 – $1,676
Heat risk 2/10 · Minimal
- Hot days now (above 101°F)
- 7 days/yr
- Hot days in 30 yrs
- 16 days/yr
Wind risk 2/10 · Minimal
- Chance of severe wind over 30 yrs
- —
Air-quality risk 1/10 · Minimal
- Unhealthy air days now
- 0 days/yr
- Unhealthy air days in 30 yrs
- 0 days/yr
Risk factors via First Street. Map © Google.
Why this score? — see what drove the B+ grade
The composite is a weighted blend of 9 inputs, each scored 0–100. Each bar is that input's sub-score; the figure is the points it added to the 100-point composite (weight × sub-score).
- Cash flow +30.0/30.0
- ARV discount +15.0/15.0
- 1% rule +10.0/10.0
- DSCR +10.0/10.0
- Schools +4.5/10.0
- Livability +4.0/5.0
- Rent growth +2.5/5.0
- Condition / age +2.5/5.0
- Appreciation +0.0/10.0
$95,000
🖨 Deal sheet 📄 Offer letter ✓ Due diligence
Listing remarks MLS
Great investment opportunity or affordable place to call HOME! This well-maintained 2-story offers spacious room sizes and a floor plan full of character. The main floor features a welcoming foyer with open staircase, comfortable living room, formal dining area, kitchen, and a fully enclosed front porch filled with natural light. Upstairs you’ll find 2 bedrooms and a large full bath, including an oversized primary bedroom with a bonus flex space perfect for a home office, nursery, sitting area, or extra storage. Vinyl replacement windows, vinyl siding, and metal-covered soffits add to the low-maintenance appeal. A solid property that has served as a quality long-term investment for many years!
Key facts
- Open staircase
- Natural light
- Bonus flex space
Tags
Property features AI
Exterior
- Security: Smoke detector(s)
- Utilities: Public water; Public sewer
- Home design: Single-family residence; 2 stories
- Construction: Frame construction; Vinyl siding
- Exterior features: Asphalt roof
Interior
- Kitchen: Gas Range; Refrigerator
- Flooring: Carpet
- Heating & cooling: Forced air heating (natural gas); Central air conditioning
- Interior features: Insulated windows; Smoke detector(s)
Neighborhood map
What this means for you Summary
Snapshot
- This is a 2-bed/1.0-bath single-family listed at $95k.
Deal economics
- At list price, monthly cash flow is $593 ($7k/yr) — positive.
- The deal already cash-flows at list — no discount required.
- Meets the 1% rule at list price ($2k rent vs $95k).
- Recommended offer: $94k (1.5% below list) — sets the bar for market timing.
- Cap rate 13.8% vs local median 5.2% in Mason City — top-decile yield for the area; either an underpriced asset or a hidden risk that comps aren't pricing in. Stress-test before assuming the spread holds.
Location & tenants
- Location reads 81/100 on livability (#67 in IA, #1,477 nationally) — a professional / high-income tenant draw. Strengths: commute A+, cost of living A+, housing A+; Watch: amenities F.
- Mason City Community School District (town): math 50% / reading 58% proficiency, ranked #271 of 289 in IA (top 94%) — acceptable for families but not a draw, mixed tenant base, ~2y average lease.
- Market conditions: 153 active listings in the ZIP; 3 comparable units currently listed for rent nearby; rentals lingering (median 44d on market — plan ~5-8 weeks vacancy on turnover, expect pricing pressure); 100% of comp listings sitting > 30 days — soft ceiling on asking rent; 54 units permitted in Cerro Gordo County in 2024 (6 in 5+ unit buildings).
Forward outlook
- Local home prices are declining (-3.0%/yr); year-one equity from $657 of loan paydown is wiped out by about $3k of value loss. Plan a longer hold.
- Cerro Gordo County population projected at -18% by 2050 — secular population decline; favor cash flow + early exit over multi-decade hold.
- At projected returns (-3.0% appreciation + 3.0% rent growth), your $27k cash investment doubles in ~5 years — after that, you're playing with house money.
Negotiation context
- It's been on market 21 days — a 2% lower offer ($94k) is reasonable based on typical stale-listing flexibility.
- 4 sale attempts with the ask held roughly flat each time — persistent listings suggest the price (not the market) is what's stuck; bring a comps-based counter.
Risks & watch-outs
- Watch-outs: built in 1920 — expect roof / HVAC / electrical / plumbing capex.
Questions for the listing agent
- Built in 1920 — when were the roof, HVAC, electrical panel, plumbing, and water heater last replaced?
- Is there a deadline driving the sale (1031 exchange, divorce, estate, relocation)? That informs how much negotiation room exists.
- What's the average days-on-market for RENTAL listings here right now (not sales)? A rising rental-DOM trend means longer vacancies and softer asking-rent achievability than the comps imply.
- What's the recent tenant-quality profile in this submarket — average credit score on applications, eviction rate, late-payment / NSF rate, and stable-employment percentage? A property-management company in the area should have these aggregated.
- How much new for-sale + rental construction is in the pipeline within 1–3 miles? Heavy new supply typically softens prices + rents 12–24 months out; constrained supply supports both.
Investment metrics
- 1% rule
- 1.64% ✓
- Cap rate
- 13.79%
- Cash-on-cash
- 26.76%
- DSCR
- 2.19
- GRM
- 5.1
CMA / ARV
- ARV (on-the-fly)
- $134,784
- Comps found
- 12
Show comp detail 12 sales within ~0.75 mi
| Address | Dist | Beds/Ba | Sqft | Sold | Price | $/sf | Match |
|---|---|---|---|---|---|---|---|
| 125 4th St NW | 0.29mi | 3/1.5 (+1) | 1,336 (+7%) | 1mo | $151,000 | $113 | 67 |
| 117 S Monroe Ave | 0.19mi | 3/1.5 (+1) | 1,089 (-13%) | 1mo | $77,000 | $71 | 62 |
| 320 1st NE #103 St #103 | 0.47mi | 2/2.0 | 1,331 (+7%) | 6mo | $250,000 | $188 | 58 |
| 726 1st St SW | 0.39mi | 2/1.2 | 1,064 (-15%) | 0mo | $144,000 | $135 | 56 |
| 1025 2nd St NW | 0.66mi | 2/1.8 | 1,188 (-5%) | 5mo | $84,000 | $71 | 54 |
| 227 N Crescent Dr Dr | 0.68mi | 2/1.8 | 1,200 (-4%) | 6mo | $129,000 | $108 | 54 |
| 320 1st NE #307 St #307 | 0.47mi | 2/2.0 | 1,418 (+14%) | 3mo | $255,000 | $180 | 49 |
| 615 S Polk PL Pl | 0.72mi | 2/1.0 | 1,120 (-10%) | 4mo | $115,500 | $103 | 46 |
| 727 2nd St SW | 0.40mi | 3/1.5 (+1) | 1,429 (+14%) | 5mo | $135,000 | $94 | 46 |
| 415 N Massachusetts Ave | 0.66mi | 3/1.5 (+1) | 1,152 (-8%) | 6mo | $138,000 | $120 | 44 |
| 194 N Crescent Dr Dr | 0.61mi | 3/2.0 (+1) | 1,364 (+9%) | 5mo | $125,000 | $92 | 43 |
| 1111 1st St SW | 0.71mi | 2/1.8 | 1,394 (+12%) | 5mo | $150,000 | $108 | 40 |
Match score weights: distance 35% · size 25% · config 20% · recency 20%. Top-matched comps best support the ARV.
Projected returns pro-forma
-3.0% appreciation · 3.0% rent growth · sell at horizon
- IRR
- 20.6%
- Equity multiple
- 1.84×
- Total profit
- $22,395
- Equity at exit
- $14,165
- IRR
- 28.8%
- Equity multiple
- 3.56×
- Total profit
- $68,189
- Equity at exit
- $8,214
Cash invested: $26,600 (down + closing). Projections, not guarantees.
Landlord ↔ Tenant lean methodology
- Overall (STATE)
- 83 Strongly Landlord-Friendly
- State Iowa
- 83 Strongly Landlord-Friendly · R+6
- County
- — inherits STATE
- City
- — inherits STATE
ZIP-level market 50401
- Active inventory
- 153
- Price-to-rent
- 5.1×
Monthly cashflow live
- Estimated rent
- $1,555 medium interval (Pro) →
- Mortgage (P&I)
- −$498
- Tax from tax record
- −$98 /mo · $1,170/yr
- Insurance
- −$40
- HOA
- −$0
- Vacancy / Maint / Mgmt
- −$327
- Net cashflow
- $593
Break-even live
UW: 25.0% down · 7.5% · 30yr · 1.5% tax · 5.0% vac · 8.0% maint · 8.0% mgmt
Financing live
Cash to close
- Down payment
- $23,750
- Closing costs
- $2,850
- Reserves months
- —
- Total cash needed
- —
Loan-product check · same deal, 3 products live
Conventional
25% down · 7.5% · 30yr
- Down + closing
- —
- Monthly P&I
- —
- Monthly cashflow
- —
- DSCR
- —
- Eligible?
- —
Personal DTI + credit; lowest rate.
DSCR
20% down · 8.5% · 30yr
- Down + closing
- —
- Monthly P&I
- —
- Monthly cashflow
- —
- DSCR
- —
- Eligible?
- —
No personal income docs; deal must DSCR.
Hard money
10% down · 12.0% · 12mo
- Down + closing
- —
- Monthly P&I
- —
- Monthly cashflow
- —
- DSCR
- —
- Eligible?
- —
Short-term bridge; refi at stabilization.
Rent comps 3 comps
| Address | Beds | Baths | Sqft | Rent | $/sqft | DOM | Units | Dist |
|---|---|---|---|---|---|---|---|---|
| 215 2nd St SW Unit 100-210 Mason City, IA | 3.0 | 2.0 | 1273 | $1,580 | $1.24 | 43d | 1 | 0.10mi |
| 12 2nd St NE Unit 6 Mason City, IA | 2.0 | 1.0 | 1296 | $1,600 | $1.23 | 43d | 1 | 0.29mi |
| 110 N Delaware Ave Unit 211 Mason City, IA | 2.0 | 1.0 | 919 | $1,395 | $1.52 | 43d | 1 | 0.30mi |
Listing history 21 events
-
2026-06-18days on market $95,000 Active 21 DOM
-
2026-06-17days on market $95,000 Active 20 DOM
-
2026-06-16days on market $95,000 Active 19 DOM
-
2026-06-15days on market $95,000 Active 18 DOM
-
2026-06-13days on market $95,000 Active 16 DOM
-
2026-06-12days on market $95,000 Active 15 DOM
-
2026-06-09days on market $95,000 Active 12 DOM
-
2026-06-08days on market $95,000 Active 11 DOM
-
2026-06-07days on market $95,000 Active 10 DOM
-
2026-06-07days on market $95,000 Active 9 DOM
-
2026-06-04days on market $95,000 Active 6 DOM
-
2026-06-02days on market $95,000 Active 5 DOM
-
2026-06-01days on market $95,000 Active 4 DOM
-
2026-05-31days on market $95,000 Active 3 DOM
-
2026-05-31days on market $95,000 Active 2 DOM
-
2026-05-27$95,000 Active 708-char remark
Show marketing remark (708 chars)
Great investment opportunity or affordable place to call HOME! This well-maintained 2-story offers spacious room sizes and a floor plan full of character. The main floor features a welcoming foyer with open staircase, comfortable living room, formal dining area, kitchen, and a fully enclosed front porch filled with natural light. Upstairs you’ll find 2 bedrooms and a large full bath, including an oversized primary bedroom with a bonus flex space perfect for a home office, nursery, sitting area, or extra storage. Vinyl replacement windows, vinyl siding, and metal-covered soffits add to the low-maintenance appeal. A solid property that has served as a quality long-term investment for many years!
-
2026-05-27$95,000 Active
Show marketing remark (708 chars)
Great investment opportunity or affordable place to call HOME! This well-maintained 2-story offers spacious room sizes and a floor plan full of character. The main floor features a welcoming foyer with open staircase, comfortable living room, formal dining area, kitchen, and a fully enclosed front porch filled with natural light. Upstairs you’ll find 2 bedrooms and a large full bath, including an oversized primary bedroom with a bonus flex space perfect for a home office, nursery, sitting area, or extra storage. Vinyl replacement windows, vinyl siding, and metal-covered soffits add to the low-maintenance appeal. A solid property that has served as a quality long-term investment for many years!
-
2025-07-15price $99,500
-
2025-07-15price $99,500
-
2025-05-06$110,000 Active
-
2025-05-06$110,000 Active
ⓘ Source: listings_history table (triggers on properties + properties_extension) + one-shot
backfill from property_details.listing_events for pre-trigger history.
Tax reassessment forecast IA · Partial reset (capped growth)
- Current annual tax
- $1,170 · $98/mo
- Projected year-2 tax
- $1,331 · $111/mo
- Expected delta
- +$161/yr (+$13/mo · 13.7%)
ⓘ Screening estimate from a state-policy table — verify with the county assessor before closing.
Climate risk First Street
- Flood 1/10 Low FEMA zone X (unshaded) · 0% chance over 30 yrs
- Wildfire 3/10 Moderate
- Heat 2/10 Low 7 d/yr ≥101°F today · 16 d/yr by 30 yrs out
- Wind 2/10 Low
- Air quality 1/10 Low 0 unhealthy d/yr today · 0 by 30 yrs out
Nearby sold comps map
Loading sold comps map…
Walkable amenities ~0.75 mi
Loading nearby amenities…
Taxation est. · year 1
- Rental income
- $18,660
- − Mortgage interest
- −$5,321
- − Property taxes
- −$1,170
- − Insurance
- −$475
- − Repairs & maintenance
- −$1,493
- − Management
- −$1,493
- − Depreciation
- −$2,764
- Taxable income
- $5,944
- Est. tax owed @ 24.0%
- −$1,427
- After-tax cash flow
- $5,691/yr
For passive investors: Depreciation is non-cash, so a rental often shows a tax loss while cash-flowing — sheltering income. Rental losses are passive: they offset passive income freely, and up to $25,000/yr can offset ordinary (W-2) income if you actively participate and your MAGI is under $100k (phasing out to $0 by $150k); unused losses carry forward. On sale, claimed depreciation is recaptured at up to 25%, and gains may owe capital-gains tax (a 1031 exchange can defer both). Figures are a year-1 estimate at your 24.0% rate — not tax advice; consult a CPA.
Schools (NCES district)
- District
- Mason City Community School District
- NCES district ID
- 1918780
- Math proficiency
- 50% ▼ -1.00%
- Reading proficiency
- 58% ▼ -7.00%
- Median HH income
- $43,668
- Composite
- 45.47/100
- National rank
- #2614
- State rank
- #271 of 289 in IA
Livability — Mason City
- Score
- 81/100
- State rank
- #67
- US rank
- #1477
Category grades
Schools grade is shown separately in the Schools card above.
Census & demographics
- Census place
- Mason City, IA
- City population
- 28,818
- Population (ZIP)
- 28,818
Population outlook (Cerro Gordo County) Hauer SSP2
- Today (2025)
- 41,080 people
- By 2030
- 39,746 · -3.2%
- By 2040
- 36,608 · -10.9%
- By 2050
- 33,682 · -18.0%
- By 2075
- 29,702 · -27.7%
- By 2100
- 27,399 · -33.3%
Race, ethnicity, and origin ACS 2023
- Neighborhood character
- Predominantly White (87%)
- Race & ethnicity
- White 87% Hispanic / Latino 6% Two or more races 5% Black 3% Asian 1%
- Hispanic origin (detail)
- Mexican 5%
- Common ancestry
- Portuguese 12% Iranian 2% Lithuanian 2%
- Foreign-born
- 2% · Canada, Vietnam
- Languages at home
- 96% English-only · Spanish 3% Other Asian/Pacific 1%
Political lean MEDSL · Cerro Gordo
- 2024 margin
- R (+11.7) · D 43.4% · R 55.0% · Other 1.6%
- 2008→2024 swing
- -32.5pp toward R · 2008: 20.8pp · 2024: -11.7pp
- All cycles
- 2024: R+11.7 2020: R+6.3 2016: R+7.7 2012: D+13.2 2008: D+20.8
Not yet ingested
- Civics
- —
Market trends
- HPI YoY
- ▼ -130.01%
- Current HPI
- 199.1966
- Rent YoY
- —
- Metro
- —
- State GDP YoY
- ▲ 2.48%
- F500 in state
- 4
Industry mix (Fortune 500 HQ in IA)
| Industry | F500 HQs | Revenue |
|---|---|---|
| Financial Services | 1 | $16B |
|
||
| Retail / Convenience | 1 | $15B |
|
||
Price history
-13.6% since first listed6 events — show timeline
- 2026-05-27 Listed $95,000 Greater Mason BOR
- 2026-05-27 Listed $95,000 IAR
- 2025-07-15 Price Changed $99,500 IAR
- 2025-07-15 Price Changed $99,500 Greater Mason BOR
- 2025-05-06 Listed $110,000 Greater Mason BOR
- 2025-05-06 Listed $110,000 IAR
Property tax history
+5.8%/yrLatest (2025): $1,170 · +2.8% YoY. Source: county tax records.
Cash-flow waterfall
monthlySold comps — $/sqft
last 12 mo · ≤1 miLoading sold comps…