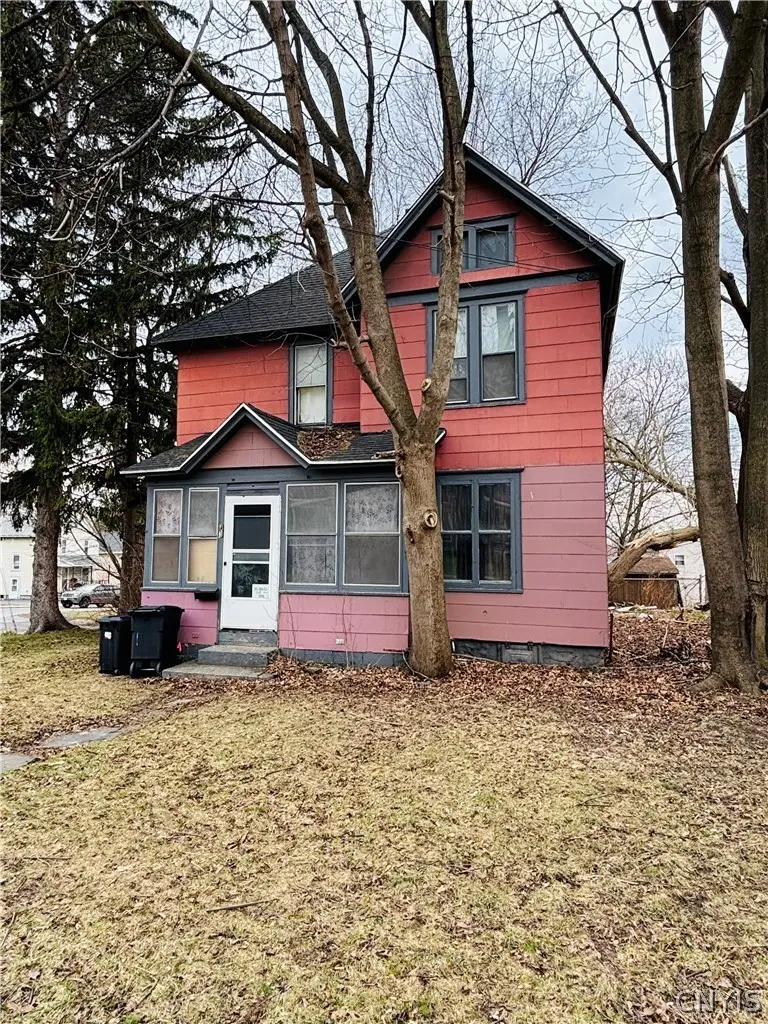
43 Grant Ave · Auburn, NY
Flood risk 1/10 · Minimal
- FEMA flood zone
- X (unshaded)
- Chance of flooding over 30 yrs
- 0.0%
- Est. flood insurance / yr
- $473 – $860
Fire risk 1/10 · Minimal
- Est. fire insurance / yr
- $691 – $1,283
Heat risk 2/10 · Minimal
- Hot days now (above 95°F)
- 7 days/yr
- Hot days in 30 yrs
- 15 days/yr
Wind risk 1/10 · Minimal
- Chance of severe wind over 30 yrs
- 1.0%
Air-quality risk 2/10 · Minimal
- Unhealthy air days now
- 0 days/yr
- Unhealthy air days in 30 yrs
- 1 days/yr
Risk factors via First Street. Map © Google.
Why this score? — see what drove the B+ grade
The composite is a weighted blend of 9 inputs, each scored 0–100. Each bar is that input's sub-score; the figure is the points it added to the 100-point composite (weight × sub-score).
- Cash flow +30.0/30.0
- ARV discount +15.0/15.0
- DSCR +10.0/10.0
- 1% rule +9.6/10.0
- Livability +3.7/5.0
- Schools +3.0/10.0
- Rent growth +2.5/5.0
- Condition / age +2.5/5.0
- Appreciation +0.0/10.0
$124,999
🖨 Deal sheet 📄 Offer letter ✓ Due diligence
Listing remarks MLS
New Price! 2 Story Home with 4 Bedrooms, 1.5 Bath, Spacious Living room & Dining room with hardwood flooring. Full bath upstairs with a 1/2 bath down. Attic storage. Front enclosed porch and small side yard for low maintenance. Newer Roof. Shared driveway with room for 2 vehicles. Fantastic price for a 4 bed/ 2 bath home. Nicely priced home for an Owner Occupy! or Great Investment property with good income potential.
Key facts
- 3,939 sq ft lot
- Parking
- Built 1900
Neighborhood map
What this means for you Summary
Snapshot
- This is a 4-bed/1.0-bath single-family listed at $125k.
Deal economics
- At list price, monthly cash flow is $600 ($7k/yr) — positive.
- The deal already cash-flows at list — no discount required.
- Meets the 1% rule at list price ($2k rent vs $125k).
- Recommended offer: $114k (9.0% below list) — sets the bar for market timing.
- Cap rate 12.1% vs local median 7.6% in Auburn — top-decile yield for the area; either an underpriced asset or a hidden risk that comps aren't pricing in. Stress-test before assuming the spread holds.
Location & tenants
- Location reads 74/100 on livability (#298 in NY, #4,814 nationally) — a middle-class / working-renter tenant base. Strengths: cost of living A+, housing A+, health & safety A+; Watch: schools D, amenities D-, commute F.
- Auburn City School District (town): math 31% / reading 39% proficiency, ranked #558 of 590 in NY (top 95%) — families likely to look elsewhere, expect single-tenant / working-renter base with shorter leases.
- Market conditions: 221 active listings in the ZIP; 2 comparable units currently listed for rent nearby; 161 units permitted in Cayuga County in 2024 (65 in 5+ unit buildings).
- This rent runs 36% of the median local income ($61k/yr) — at the standard rent-burdened threshold; future hikes will face affordability resistance.
Forward outlook
- Local home prices are declining (-3.0%/yr); year-one equity from $864 of loan paydown is wiped out by about $4k of value loss. Plan a longer hold.
- Cayuga County population projected at -18% by 2050 — secular population decline; favor cash flow + early exit over multi-decade hold.
- At projected returns (-3.0% appreciation + 3.0% rent growth), your $35k cash investment doubles in ~6 years — after that, you're playing with house money.
Negotiation context
- It's been on market 95 days — a 9% lower offer ($114k) is reasonable based on typical stale-listing flexibility.
- 3 sale attempts since 8y ago; this cycle's ask has dropped $20k (14%) from the opening price — seller is motivated, your offer sets the floor, not the list.
- Current owner paid $50k; list at $125k implies a 150% gain — meaningful room to come down on a strong offer.
Risks & watch-outs
- Watch-outs: built in 1900 — expect roof / HVAC / electrical / plumbing capex.
Questions for the listing agent
- It's been on market 95 days. Have you received any prior offers? Is the seller open to a 9% concession, seller financing, or rate buy-down credit?
- Built in 1900 — when were the roof, HVAC, electrical panel, plumbing, and water heater last replaced?
- Why hasn't it sold? Are there any deal-killer items the seller is aware of (foundation, flood, title, zoning, code violations)?
- Is there a deadline driving the sale (1031 exchange, divorce, estate, relocation)? That informs how much negotiation room exists.
- Schools are D-rated, which usually means shorter tenancies and higher turnover. Who's the typical renter profile here, and what's been the actual vacancy rate?
- What's the average days-on-market for RENTAL listings here right now (not sales)? A rising rental-DOM trend means longer vacancies and softer asking-rent achievability than the comps imply.
- What's the recent tenant-quality profile in this submarket — average credit score on applications, eviction rate, late-payment / NSF rate, and stable-employment percentage? A property-management company in the area should have these aggregated.
- How much new for-sale + rental construction is in the pipeline within 1–3 miles? Heavy new supply typically softens prices + rents 12–24 months out; constrained supply supports both.
Investment metrics
- 1% rule
- 1.46% ✓
- Cap rate
- 12.05%
- Cash-on-cash
- 20.56%
- DSCR
- 1.91
- GRM
- 5.7
CMA / ARV
- ARV (median comp)
- $176,321
- List price
- $124,999
- Delta
- -29.11%
- Verdict
- UNDERPRICED
- Comps
- 20 within 1.0 mi
Show comp detail 12 sales within ~0.75 mi
| Address | Dist | Beds/Ba | Sqft | Sold | Price | $/sf | Match |
|---|---|---|---|---|---|---|---|
| 69 Lansing St | 0.22mi | 4/1.5 | 1,608 (-2%) | 7mo | $204,000 | $127 | 78 |
| 76 Grant Ave | 0.14mi | 4/1.5 | 1,744 (+6%) | 3mo | $173,000 | $99 | 78 |
| 18 Paul St | 0.13mi | 3/1.5 (-1) | 1,516 (-8%) | 4mo | $65,000 | $43 | 71 |
| 3 Parsons St | 0.42mi | 5/2.0 (+1) | 1,624 (-1%) | 3mo | $39,000 | $24 | 68 |
| 126 N Fulton St | 0.33mi | 3/1.5 (-1) | 1,568 (-4%) | 6mo | $162,500 | $104 | 65 |
| 34 Liberty St | 0.40mi | 4/1.5 | 1,464 (-11%) | 3mo | $135,000 | $92 | 59 |
| 29 Liberty St | 0.41mi | 4/1.5 | 1,470 (-10%) | 8mo | $153,300 | $104 | 55 |
| 121 E Genesee St | 0.37mi | 3/2.5 (-1) | 1,800 (+10%) | 2mo | $395,000 | $219 | 54 |
| 318 N Seward Ave | 0.48mi | 3/1.0 (-1) | 1,500 (-8%) | 8mo | $219,900 | $147 | 52 |
| 22 Sherman St | 0.53mi | 5/2.0 (+1) | 1,782 (+9%) | 2mo | $250,000 | $140 | 50 |
| 130 North St | 0.53mi | 3/2.0 (-1) | 1,789 (+9%) | 2mo | $198,000 | $111 | 49 |
| 78 Standart Ave | 0.51mi | 3/2.0 (-1) | 1,448 (-12%) | 1mo | $165,000 | $114 | 47 |
Match score weights: distance 35% · size 25% · config 20% · recency 20%. Top-matched comps best support the ARV.
Projected returns pro-forma
-3.0% appreciation · 3.0% rent growth · sell at horizon
- IRR
- 12.9%
- Equity multiple
- 1.51×
- Total profit
- $17,955
- Equity at exit
- $18,638
- IRR
- 21.8%
- Equity multiple
- 2.85×
- Total profit
- $64,871
- Equity at exit
- $10,808
Cash invested: $35,000 (down + closing). Projections, not guarantees.
Landlord ↔ Tenant lean methodology
- Overall (STATE)
- 15 Strongly Tenant-Friendly
- State New York
- 15 Strongly Tenant-Friendly · D+10
- County
- — inherits STATE
- City
- — inherits STATE
ZIP-level market 13021
- Home prices YoY
- -22.4%
- Active inventory
- 221
- Price-to-rent
- 5.7×
Monthly cashflow live
- Estimated rent
- $1,820 medium interval (Pro) →
- Mortgage (P&I)
- −$656
- Tax from tax record
- −$131 /mo · $1,570/yr
- Insurance
- −$52
- HOA
- −$0
- Vacancy / Maint / Mgmt
- −$382
- Net cashflow
- $600
Break-even live
UW: 25.0% down · 7.5% · 30yr · 1.5% tax · 5.0% vac · 8.0% maint · 8.0% mgmt
Financing live
Cash to close
- Down payment
- $31,250
- Closing costs
- $3,750
- Reserves months
- —
- Total cash needed
- —
Loan-product check · same deal, 3 products live
Conventional
25% down · 7.5% · 30yr
- Down + closing
- —
- Monthly P&I
- —
- Monthly cashflow
- —
- DSCR
- —
- Eligible?
- —
Personal DTI + credit; lowest rate.
DSCR
20% down · 8.5% · 30yr
- Down + closing
- —
- Monthly P&I
- —
- Monthly cashflow
- —
- DSCR
- —
- Eligible?
- —
No personal income docs; deal must DSCR.
Hard money
10% down · 12.0% · 12mo
- Down + closing
- —
- Monthly P&I
- —
- Monthly cashflow
- —
- DSCR
- —
- Eligible?
- —
Short-term bridge; refi at stabilization.
Rent comps 2 comps
| Address | Beds | Baths | Sqft | Rent | $/sqft | DOM | Units | Dist |
|---|---|---|---|---|---|---|---|---|
| 5 Sheridan St Auburn, NY | 4.0 | 2.0 | 1788 | $1,995 | $1.12 | 44d | 1 | 0.39mi |
| 173 E Genesee St Unit 171 Auburn, NY | 3.0 | 1.5 | 2000 | $2,000 | $1.00 | 44d | 1 | 0.59mi |
Listing history 26 events
-
2026-06-19days on market $124,999 Active 95 DOM
-
2026-06-18days on market $124,999 Active 94 DOM
-
2026-06-17days on market $124,999 Active 93 DOM
-
2026-06-16days on market $124,999 Active 92 DOM
-
2026-06-15days on market $124,999 Active 91 DOM
-
2026-06-14days on market $124,999 Active 89 DOM
-
2026-06-12days on market $124,999 Active 88 DOM
-
2026-06-09days on market $124,999 Active 85 DOM
-
2026-06-08days on market $124,999 Active 84 DOM
-
2026-06-07days on market $124,999 Active 83 DOM
-
2026-06-05days on market $124,999 Active 80 DOM
-
2026-06-03days on market $124,999 Active 79 DOM
-
2026-06-02days on market $124,999 Active 78 DOM
-
2026-06-01days on market $124,999 Active 77 DOM
-
2026-05-31days on market $124,999 Active 76 DOM
-
2026-05-30days on market $124,999 Active 75 DOM
-
2026-05-12price $124,999 426-char remark
Show marketing remark (426 chars)
New Price! 2 Story Home with 4 Bedrooms, 1.5 Bath, Spacious Living room & Dining room with hardwood flooring. Full bath upstairs with a 1/2 bath down. Attic storage. Front enclosed porch and small side yard for low maintenance. Newer Roof. Shared driveway with room for 2 vehicles. Fantastic price for a 4 bed/ 2 bath home. Nicely priced home for an Owner Occupy! or Great Investment property with good income potential.
-
2026-04-11price $134,900 426-char remark
Show marketing remark (426 chars)
New Price! 2 Story Home with 4 Bedrooms, 1.5 Bath, Spacious Living room & Dining room with hardwood flooring. Full bath upstairs with a 1/2 bath down. Attic storage. Front enclosed porch and small side yard for low maintenance. Newer Roof. Shared driveway with room for 2 vehicles. Fantastic price for a 4 bed/ 2 bath home. Nicely priced home for an Owner Occupy! or Great Investment property with good income potential.
-
2026-03-16$145,000 Active 426-char remark
Show marketing remark (426 chars)
New Price! 2 Story Home with 4 Bedrooms, 1.5 Bath, Spacious Living room & Dining room with hardwood flooring. Full bath upstairs with a 1/2 bath down. Attic storage. Front enclosed porch and small side yard for low maintenance. Newer Roof. Shared driveway with room for 2 vehicles. Fantastic price for a 4 bed/ 2 bath home. Nicely priced home for an Owner Occupy! or Great Investment property with good income potential.
-
2022-09-08soldstatus $50,000
-
2022-08-31soldstatus $50,000 Closed Sale or Rented 96-char remark
Show marketing remark (96 chars)
Investors Delight or Owner Occupied! Newly renovated home and presently rented. Priced to Sell!
-
2022-08-04status Pending Sale 96-char remark
Show marketing remark (96 chars)
Investors Delight or Owner Occupied! Newly renovated home and presently rented. Priced to Sell!
-
2020-12-01$69,900 Active 96-char remark
Show marketing remark (96 chars)
Investors Delight or Owner Occupied! Newly renovated home and presently rented. Priced to Sell!
-
2019-03-04historical
-
2018-11-30price $69,900
-
2018-08-13$79,900 Active
ⓘ Source: listings_history table (triggers on properties + properties_extension) + one-shot
backfill from property_details.listing_events for pre-trigger history.
Tax reassessment forecast NY · Partial reset (capped growth)
- Current annual tax
- $1,570 · $131/mo
- Projected year-2 tax
- $1,841 · $153/mo
- Expected delta
- +$271/yr (+$23/mo · 17.3%)
ⓘ Screening estimate from a state-policy table — verify with the county assessor before closing.
Climate risk First Street
- Flood 1/10 Low FEMA zone X (unshaded) · 0% chance over 30 yrs
- Wildfire 1/10 Low
- Heat 2/10 Low 7 d/yr ≥95°F today · 15 d/yr by 30 yrs out
- Wind 1/10 Low 100% chance of damaging wind over 30 yrs
- Air quality 2/10 Low 0 unhealthy d/yr today · 1 by 30 yrs out
Nearby sold comps map
Loading sold comps map…
Walkable amenities ~0.75 mi
Loading nearby amenities…
Taxation est. · year 1
- Rental income
- $21,846
- − Mortgage interest
- −$7,002
- − Property taxes
- −$1,570
- − Insurance
- −$625
- − Repairs & maintenance
- −$1,748
- − Management
- −$1,748
- − Depreciation
- −$3,636
- Taxable income
- $5,517
- Est. tax owed @ 24.0%
- −$1,324
- After-tax cash flow
- $5,873/yr
For passive investors: Depreciation is non-cash, so a rental often shows a tax loss while cash-flowing — sheltering income. Rental losses are passive: they offset passive income freely, and up to $25,000/yr can offset ordinary (W-2) income if you actively participate and your MAGI is under $100k (phasing out to $0 by $150k); unused losses carry forward. On sale, claimed depreciation is recaptured at up to 25%, and gains may owe capital-gains tax (a 1031 exchange can defer both). Figures are a year-1 estimate at your 24.0% rate — not tax advice; consult a CPA.
Schools (NCES district)
- District
- Auburn City School District
- NCES district ID
- 3603480
- Math proficiency
- 31% ▼ -17.00%
- Reading proficiency
- 39% ▲ 2.00%
- Median HH income
- $43,567
- Composite
- 29.71/100
- National rank
- #6452
- State rank
- #558 of 590 in NY
Livability — Auburn
- Score
- 74/100
- State rank
- #298
- US rank
- #4814
Category grades
Schools grade is shown separately in the Schools card above.
Census & demographics
- Census place
- Auburn, NY
- County
- Cayuga County · 37,247 people
- City population
- 37,247
- Metro
- Auburn, NY
- Population (ZIP)
- 37,247
- Household income
- $60,712
- Rent vs Own
- Severe rent burden
- 1449.0
Population outlook (Cayuga County) Hauer SSP2
- Today (2025)
- 74,820 people
- By 2030
- 72,402 · -3.2%
- By 2040
- 66,917 · -10.6%
- By 2050
- 61,007 · -18.5%
- By 2075
- 48,047 · -35.8%
- By 2100
- 34,512 · -53.9%
Race, ethnicity, and origin ACS 2023
- Neighborhood character
- Predominantly White (87%)
- Race & ethnicity
- White 87% Two or more races 7% Black 3% Hispanic / Latino 3%
- Common ancestry
- Romanian 8% Subsaharan African 3% Lithuanian 2%
- Foreign-born
- 2% · Canada
- Languages at home
- 95% English-only · Spanish 2% Other Indo-European 1% German/W. Germanic 1%
Political lean MEDSL · Cayuga
- 2024 margin
- R (+13.0) · D 43.5% · R 56.5%
- 2008→2024 swing
- -21.5pp toward R · 2008: 8.5pp · 2024: -13.0pp
- All cycles
- 2024: R+13.0 2020: R+9.2 2016: R+13.2 2012: D+10.8 2008: D+8.5
Not yet ingested
- Civics
- —
Market trends
- HPI YoY
- ▼ -97.53%
- Current HPI
- 338.5537
- Rent YoY
- —
- Metro
- Auburn, NY
- State GDP YoY
- ▲ 2.60%
- F500 in state
- 92
Industry mix (Fortune 500 HQ in NY)
| Industry | F500 HQs | Revenue |
|---|---|---|
| Financial Services | 10 | $950B |
|
||
| Consumer Goods | 9 | $162B |
|
||
| Insurance | 4 | $225B |
|
||
| Telecommunications | 2 | $144B |
|
||
| Pharmaceuticals | 2 | $112B |
|
||
| Media / Entertainment | 2 | $69B |
|
||
Price history
+56.4% since first listed10 events — show timeline
- 2026-05-12 Price Changed $124,999 CNYIS
- 2026-04-11 Price Changed $134,900 CNYIS
- 2026-03-16 Listed $145,000 CNYIS
- 2022-09-08 Sold (Public Records) $50,000 Public Records
- 2022-08-31 Sold (MLS) $50,000 UNYREIS
- 2022-08-04 Pending — UNYREIS
- 2020-12-01 Listed $69,900 UNYREIS
- 2019-03-04 Listing Removed — CNYIS
- 2018-11-30 Price Changed $69,900 CNYIS
- 2018-08-13 Listed $79,900 CNYIS
Property tax history
-3.9%/yrLatest (2025): $1,570 · +10.8% YoY. Source: county tax records.
Cash-flow waterfall
monthlySold comps — $/sqft
last 12 mo · ≤1 miLoading sold comps…