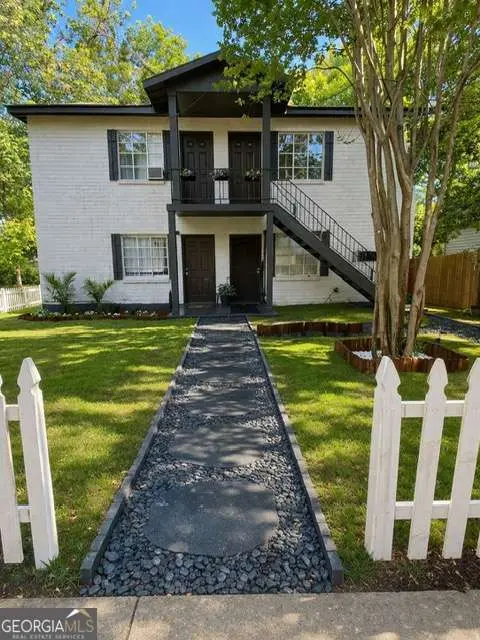
 Fourplex
479 Kelly St SE Unit 1-4 · Atlanta, GA
Flood risk 4/10 · Minor
- FEMA flood zone
- X (unshaded)
- Chance of flooding over 30 yrs
- 0.22%
- Est. flood insurance / yr
- $507 – $1,088
Fire risk 1/10 · Minimal
- Est. fire insurance / yr
- $963 – $1,789
Heat risk 5/10 · Moderate
- Hot days now (above 104°F)
- 6 days/yr
- Hot days in 30 yrs
- 15 days/yr
Wind risk 5/10 · Moderate
- Chance of severe wind over 30 yrs
- 26.0%
Air-quality risk 4/10 · Minor
- Unhealthy air days now
- 4 days/yr
- Unhealthy air days in 30 yrs
- 6 days/yr
Risk factors via First Street. Map © Google.
Why this score? — see what drove the C- grade
The composite is a weighted blend of 9 inputs, each scored 0–100. Each bar is that input's sub-score; the figure is the points it added to the 100-point composite (weight × sub-score).
- Cash flow +18.8/30.0
- ARV discount +7.5/15.0
- DSCR +5.9/10.0
- 1% rule +5.0/10.0
- Livability +4.2/5.0
- Condition / age +4.0/5.0
- Rent growth +3.2/5.0
- Schools +2.7/10.0
- Appreciation +0.0/10.0
$1,175,000
🖨 Deal sheet 📄 Offer letter ✓ Due diligence
Multi-family units
County records classify this as Multi-Family (2-4 Unit). Listing-text estimate: 4 units. confirmed
Listing remarks
479 Kelly Street, Atlanta, GA 30316 A rare chance to acquire a stabilized and income-producing quadplex (fourplex) with the ability to build 2 Additional units in the rear. Located near the thriving areas of Grant Park and Summerhill. This property offers a desirable 4 unit mix with excellent rental income and future upside potential. 3 of the 4 unit apartments have happy, reliable, long-term tenants in place. The comfortable, well-maintained apartments and huge off-street parking lot attract quality tenants for this outstanding location that is walking distance to Grant Park and the Beltline. Parking is street parking. Unit 1 is vacant for showings. Please see additional info Sheets in th
Key facts
- 7,100 sq ft lot
- 4 parking spots
- Built 1961
Tags
Property features AI
Finance
- Other: Parcel located at 479 Kelly St SE Units 1–4, Atlanta, GA 30312; Subdivision: Grant Park; Unit count: 4 units; Listing agent: Ryan Sconyers; List price: $1,175,000; On market date: 2026-04-29
- Financial info: Gross income reported: $76,800; Listing terms include 1031 Exchange, Cash, Conventional, FHA
- HOA & community: No association
Exterior
- Parking: Off-street parking for 4 vehicles
- Utilities: Public water; Public sewer; Electricity on individual meters; Gas on individual meters; Sewer connected
- Home design: Residential income property; Multi-family quadruplex; Quadruplex structure; Resale
- Construction: Built in 1961; Brick exterior; Block foundation
- Exterior features: Brick construction; Block foundation; Lot approximately 0.163 acres; Located in Grant Park neighborhood; Near a park, near public transportation, within walking distance to schools
Interior
- Heating & cooling: Electric heating; Central air; Window unit(s)
- Interior features: Two levels; No basement; No fireplaces
Neighborhood map
What this means for you Summary
Snapshot
- This is a 4 × 3-bed/2-bath units multifamily listed at $1.18M. Condition is rated good.
Deal economics
- At list price, monthly cash flow is $1k ($14k/yr) — positive. Per door: $296/mo.
- The deal already cash-flows at list — no discount required.
- Meets the 1% rule at list price ($12k rent vs $1.18M).
- Recommended offer: $1.14M (3.0% below list) — sets the bar for market timing.
- Cap rate 7.5% vs local median 3.1% in Atlanta — top-decile yield for the area; either an underpriced asset or a hidden risk that comps aren't pricing in. Stress-test before assuming the spread holds.
Location & tenants
- Location reads 83/100 on livability (#6 in GA, #919 nationally) — a professional / high-income tenant draw. Strengths: amenities A+, commute A+, housing A+; Watch: schools C-, cost of living C-.
- Atlanta Public Schools (urban): math 28% / reading 35% proficiency, ranked #80 of 174 in GA (top 46%) — families likely to look elsewhere, expect single-tenant / working-renter base with shorter leases; 71% free/reduced lunch — lower-income household profile, screen leases tightly.
- Market conditions: Rents rising (+2.8%/yr); 237 active listings in the ZIP; 40 comparable units currently listed for rent nearby; rentals at typical pace (median 20d on market — plan ~3-4 weeks tenant-placement turnaround); solid renter incomes; 11,565 units permitted in Fulton County in 2024 (8,159 in 5+ unit buildings).
- At $11,777/mo this rent would consume 171% of the median local household income ($83k/yr) (locally 2010% of renters already pay >50% of income on rent) — very limited rent-growth headroom before tenants either downsize or default.
Forward outlook
- Local home prices are declining (-3.0%/yr); year-one equity from $8k of loan paydown is wiped out by about $35k of value loss. Plan a longer hold.
- Fulton County population projected at +38% by 2050 — long-run rental-demand tailwind backs the buy-and-hold thesis.
Negotiation context
- It's been on market 33 days — a 3% lower offer ($1.14M) is reasonable based on typical stale-listing flexibility.
Risks & watch-outs
- Climate carrying-cost: moderate wind risk, 26% chance of damaging wind over 30y; extreme-heat days projected 6→15/yr by 2055 (HVAC capex compounding) — expect insurance premiums to compound above CPI over the hold.
Questions for the listing agent
- It's been on market 33 days. Have you received any prior offers? Is the seller open to a 3% concession, seller financing, or rate buy-down credit?
- Can we see the unit-by-unit rent roll, current vacancy, and any below-market leases? What's the average tenancy length?
- What capital expenditures (roof, boiler, parking lot, exteriors) have been made in the last 5 years, and what's planned in the next 2?
- Built in 1961 — when were the roof, HVAC, electrical panel, plumbing, and water heater last replaced?
- Is there a deadline driving the sale (1031 exchange, divorce, estate, relocation)? That informs how much negotiation room exists.
- What's the average days-on-market for RENTAL listings here right now (not sales)? A rising rental-DOM trend means longer vacancies and softer asking-rent achievability than the comps imply.
- What's the recent tenant-quality profile in this submarket — average credit score on applications, eviction rate, late-payment / NSF rate, and stable-employment percentage? A property-management company in the area should have these aggregated.
- How much new apartment / multifamily construction is in the pipeline within 1–3 miles? Heavy new supply (>2% of stock underway) typically softens rents 12–24 months out; light construction supports rent growth.
Investment metrics
- 1% rule
- 1.00% ✓
- Cap rate
- 7.50%
- Cash-on-cash
- 4.32%
- DSCR
- 1.19
- GRM
- 8.3
CMA / ARV
No comps found within radius.
Show comp detail 6 sales within ~0.75 mi
| Address | Dist | Beds/Ba | Sqft | Sold | Price | $/sf | Match |
|---|---|---|---|---|---|---|---|
| 395 Oakland Ave SE | 0.36mi | 4/4.0 | — | 3mo | $985,000 | — | 68 |
| 622 Kent St SE | 0.34mi | 2/2.0 | — | 7mo | $520,000 | — | 66 |
| 443 Woodward Ave SE | 0.51mi | 4/2.0 | — | 10mo | $785,000 | — | 55 |
| 352 Cherokee Ave SE | 0.50mi | 8/4.0 | — | 12mo | $1,150,000 | — | 54 |
| 768 Grant Ter | 0.56mi | 3/1.0 | — | 14mo | $315,000 | — | 50 |
| 505 Bryan St SE | 0.58mi | 2/2.0 | — | 20mo | $601,000 | — | 44 |
Match score weights: distance 35% · size 25% · config 20% · recency 20%. Top-matched comps best support the ARV.
Projected returns pro-forma
-3.0% appreciation · 2.84% rent growth · sell at horizon
- IRR
- -9.7%
- Equity multiple
- 0.65×
- Total profit
- $-116,727
- Equity at exit
- $175,196
- IRR
- -0.5%
- Equity multiple
- 0.96×
- Total profit
- $-11,590
- Equity at exit
- $101,593
Cash invested: $329,000 (down + closing). Projections, not guarantees.
Landlord ↔ Tenant lean methodology
- Overall (STATE)
- 90 Strongly Landlord-Friendly
- State Georgia
- 90 Strongly Landlord-Friendly · R+3
- County
- — inherits STATE
- City
- — inherits STATE
ZIP-level market 30312
- Rents YoY
- 2.8%
- Active inventory
- 237
- Price-to-rent
- 33.3×
Monthly cashflow live
- Estimated rent
- $11,777 high interval (Pro) →
- Mortgage (P&I)
- −$6,162
- Tax est. 1.5%
- −$1,469 /mo · $17,625/yr
- Insurance
- −$490
- HOA
- −$0
- Vacancy / Maint / Mgmt
- −$2,473
- Net cashflow
- $1,184
Break-even live
4-unit breakdown (identical units grouped — click to expand)
| Units | Beds | Baths | Est. rent |
|---|---|---|---|
| 4× units | 3 | 2 | $11,776 |
| #1 | 3 | 2 | $2,944 |
| #2 | 3 | 2 | $2,944 |
| #3 | 3 | 2 | $2,944 |
| #4 | 3 | 2 | $2,944 |
| Total (4 units) | $11,777 | ||
UW: 25.0% down · 7.5% · 30yr · 1.5% tax · 5.0% vac · 8.0% maint · 8.0% mgmt
Financing live
Cash to close
- Down payment
- $293,750
- Closing costs
- $35,250
- Reserves months
- —
- Total cash needed
- —
Loan-product check · same deal, 3 products live
Conventional
25% down · 7.5% · 30yr
- Down + closing
- —
- Monthly P&I
- —
- Monthly cashflow
- —
- DSCR
- —
- Eligible?
- —
Personal DTI + credit; lowest rate.
DSCR
20% down · 8.5% · 30yr
- Down + closing
- —
- Monthly P&I
- —
- Monthly cashflow
- —
- DSCR
- —
- Eligible?
- —
No personal income docs; deal must DSCR.
Hard money
10% down · 12.0% · 12mo
- Down + closing
- —
- Monthly P&I
- —
- Monthly cashflow
- —
- DSCR
- —
- Eligible?
- —
Short-term bridge; refi at stabilization.
Rent comps 40 comps
| Address | Beds | Baths | Sqft | Rent | $/sqft | DOM | Units | Dist |
|---|---|---|---|---|---|---|---|---|
| 472 Martin St SE #6 Atlanta, GA | 3.0 | 3.5 | 1496 | $4,200 | $2.81 | 24d | 1 | 0.16mi |
| 85 Hammock Pl SE Atlanta, GA | 3.0 | 2.5 | 1600 | $3,600 | $2.25 | 24d | 1 | 0.22mi |
| 71 Fulton St SE Atlanta, GA | 3.0 | 2.5 | 1580 | $2,395 | $1.52 | 20d | 1 | 0.24mi |
| 71 Fulton St SE Atlanta, GA | 3.0 | 2.5 | 1580 | $2,395 | $1.52 | 24d | 1 | 0.24mi |
| 225 Woodward Ave SE Atlanta, GA | 2.0 | 2.0 | 1600 | $2,603 | $1.63 | 24d | 1 | 0.24mi |
| 89 Woodward Ave SE Atlanta, GA | 1.0–3.0 | 1.0–2.0 | 1013 | $1,490 | $1.47 | 1d | 30 | 0.29mi |
| 53 Hammock Pl SE Atlanta, GA | 3.0 | 2.5 | 1510 | $2,895 | $1.92 | 4d | 1 | 0.29mi |
| 484 Fraser St SE Unit 484 Atlanta, GA | 3.0 | 2.5 | 1580 | $2,350 | $1.49 | 24d | 1 | 0.29mi |
| 307 Georgia Ave SE Atlanta, GA | 3.0 | 2.5 | 2098 | $6,500 | $3.10 | 22d | 1 | 0.43mi |
| 230 Martin Luther King Jr Dr SE Atlanta, GA | 3.0 | 1.0–3.0 | 979 | $2,595 | $2.65 | 2d | 21 | 0.44mi |
| 438 Cherokee Ave SE #1 Atlanta, GA | 2.0 | 2.0 | 1200 | $2,300 | $1.92 | 24d | 1 | 0.46mi |
| 565 Hank Aaron Dr SW Atlanta, GA | 1.0–3.0 | 1.0–2.0 | 1139 | $2,326 | $2.04 | 2d | 23 | 0.48mi |
| 679 Arcos Way SE Atlanta, GA | 2.0 | 2.5 | 1500 | $2,650 | $1.77 | 16d | 1 | 0.49mi |
| 459 Glenwood Ave SE Unit B Atlanta, GA | 1.0 | 1.0 | 700 | $1,325 | $1.89 | 17d | 1 | 0.49mi |
| 64 Bass St SE Atlanta, GA | 3.0 | 3.0 | 2100 | $3,295 | $1.57 | 20d | 1 | 0.51mi |
| 240 Grant St SE Atlanta, GA | 2.0 | 1.0–2.0 | 801 | $2,236 | $2.79 | 2d | 22 | 0.52mi |
| 691 Concrete Aly SE Atlanta, GA | 2.0 | 2.0 | 1171 | $4,521 | $3.86 | 18d | 1 | 0.53mi |
| 349 Decatur St SE Atlanta, GA | 2.0 | 1.0–2.0 | 956 | $2,397 | $2.51 | 4d | 18 | 0.55mi |
| 465 Memorial Dr SE Unit 340 Atlanta, GA | 1.0 | 1.0 | 714 | $1,639 | $2.30 | 22d | 1 | 0.58mi |
| 465 Memorial Dr SE Atlanta, GA | 2.0 | 2.0 | 1081 | $2,470 | $2.28 | 24d | 1 | 0.58mi |
| 465 Memorial Dr SE Unit 436 Atlanta, GA | 2.0 | 2.0 | 1031 | $2,121 | $2.06 | 22d | 1 | 0.58mi |
| 60 Adore Ct SE Atlanta, GA | 2.0 | 2.0 | 1139 | $2,200 | $1.93 | 15d | 1 | 0.59mi |
| 720 Hank Aaron Dr SE Atlanta, GA | 2.0 | 1.0–2.0 | 847 | $2,219 | $2.62 | 2d | 24 | 0.60mi |
| 767 Terry St SE Unit B Atlanta, GA | 3.0 | 2.0 | 1330 | $2,600 | $1.95 | 24d | 1 | 0.62mi |
| 357 Auburn Pointe Dr SE Atlanta, GA | 1.0–2.0 | 1.0–2.0 | 917 | $1,644 | $1.79 | 1d | 8 | 0.65mi |
| 207 South Ave SE Atlanta, GA | 2.0 | 1.0 | 750 | $1,977 | $2.64 | 24d | 1 | 0.68mi |
| 197 South Ave SE Apt C Atlanta, GA | 2.0 | 1.0 | 2972 | $2,600 | $0.87 | 24d | 1 | 0.68mi |
| 795 Grant St SE Atlanta, GA | 3.0 | 2.0 | 1474 | $5,200 | $3.53 | 2d | 1 | 0.68mi |
| 51 Little St SE Atlanta, GA | 3.0 | 2.5 | 1478 | $2,995 | $2.03 | 24d | 1 | 0.69mi |
| 523 SE BLVD Unit B Atlanta, GA | 2.0 | 2.0 | 1275 | $2,500 | $1.96 | 22d | 1 | 0.74mi |
| 502 Pryor St SW #317 Atlanta, GA | 1.0 | 1.0 | 750 | $1,350 | $1.80 | 24d | 1 | 0.76mi |
| 133 Trinity Ave SW Atlanta, GA | 1.0–2.0 | 1.0–2.0 | 897 | $1,725 | $1.92 | 7d | 9 | 0.79mi |
| 210 Pryor St SW Atlanta, GA | 1.0 | 1.0 | 1374 | $2,575 | $1.87 | 3d | 2 | 0.81mi |
| 71 Lucy St SE #4 Atlanta, GA | 3.0 | 4.5 | 2645 | $3,600 | $1.36 | 5d | 1 | 0.82mi |
| 259 Atlanta Ave SE Atlanta, GA | 3.0 | 2.5 | 1916 | $3,599 | $1.88 | 5d | 1 | 0.83mi |
| 170 Boulevard SE Unit F101 Atlanta, GA | 1.0 | 1.0 | 737 | $2,400 | $3.26 | 4d | 1 | 0.84mi |
| 170 Boulevard SE Unit H112 Atlanta, GA | 2.0 | 1.0 | 1399 | $2,650 | $1.89 | 24d | 1 | 0.84mi |
| 630 Woodward Ave SE Atlanta, GA | 2.0 | 1.0 | 1253 | $2,700 | $2.15 | 22d | 1 | 0.85mi |
| 647 Bryan St SE Atlanta, GA | 2.0 | 2.0 | 1500 | $3,500 | $2.33 | 18d | 1 | 0.86mi |
| 130 Vanira Ave SE Atlanta, GA | 1.0 | 1.0 | — | $758 | — | 3d | 1 | 0.87mi |
Listing history 3 events
-
2026-06-01days on market $1,175,000 Active 33 DOM
-
2026-05-31days on market $1,175,000 Active 32 DOM
-
2026-04-29$1,175,000 New 710-char remark
ⓘ Source: listings_history table (triggers on properties + properties_extension) + one-shot
backfill from property_details.listing_events for pre-trigger history.
Climate risk First Street
- Flood 4/10 Moderate FEMA zone X (unshaded) · 22% chance over 30 yrs
- Wildfire 1/10 Low
- Heat 5/10 Major 6 d/yr ≥104°F today · 15 d/yr by 30 yrs out
- Wind 5/10 Major 26% chance of damaging wind over 30 yrs
- Air quality 4/10 Moderate 4 unhealthy d/yr today · 6 by 30 yrs out
Nearby sold comps map
Loading sold comps map…
Walkable amenities ~0.75 mi
Loading nearby amenities…
Taxation est. · year 1
- Rental income
- $141,324
- − Mortgage interest
- −$65,818
- − Property taxes
- −$17,625
- − Insurance
- −$5,875
- − Repairs & maintenance
- −$11,306
- − Management
- −$11,306
- − Depreciation
- −$34,182
- Taxable loss
- −$4,788
- Est. tax savings @ 24.0%
- +$1,149
- After-tax cash flow
- $15,353/yr
For passive investors: Depreciation is non-cash, so a rental often shows a tax loss while cash-flowing — sheltering income. Rental losses are passive: they offset passive income freely, and up to $25,000/yr can offset ordinary (W-2) income if you actively participate and your MAGI is under $100k (phasing out to $0 by $150k); unused losses carry forward. On sale, claimed depreciation is recaptured at up to 25%, and gains may owe capital-gains tax (a 1031 exchange can defer both). Figures are a year-1 estimate at your 24.0% rate — not tax advice; consult a CPA.
Condition & rehab AI · 12 photos
This fourplex is in good condition with cosmetic updates needed for curb appeal and value enhancement.
Value-add opportunities
- Both Paint exterior — Enhances curb appeal and value
- Both Replace gutters — Improves drainage and property value
Renovation cost estimate screening
Value-add ROI direction
- Both Paint exterior — Enhances curb appeal and value ↑
- Both Replace gutters — Improves drainage and property value ↑
ⓘ Cost ranges are severity-bucket heuristics (US national rule-of-thumb). Get contractor quotes + a written scope before underwriting a rehab budget.
Schools (NCES district)
- District
- Atlanta Public Schools
- NCES district ID
- 1300120
- Math proficiency
- 28% ▼ -6.00%
- Reading proficiency
- 35% ▼ -2.00%
- Median HH income
- $48,306
- Composite
- 27.27/100
- National rank
- #7006
- State rank
- #80 of 174 in GA
Livability — Atlanta
- Score
- 83/100
- State rank
- #6
- US rank
- #919
Category grades
Schools grade is shown separately in the Schools card above.
Census & demographics
- Census place
- Atlanta, GA
- County
- Fulton County · 1,094,430 people
- City population
- 629,525
- Metro
- Atlanta-Sandy Springs-Alpharetta, GA
- Population (ZIP)
- 26,942
- Household income
- $82,779
- Rent vs Own
- Severe rent burden
- 2010.0
Population outlook (Fulton County) Hauer SSP2
- Today (2025)
- 1,203,707 people
- By 2030
- 1,299,706 · +8.0%
- By 2040
- 1,488,256 · +23.6%
- By 2050
- 1,664,580 · +38.3%
- By 2075
- 2,036,072 · +69.2%
- By 2100
- 2,222,402 · +84.6%
Race, ethnicity, and origin ACS 2023
- Neighborhood character
- Diverse neighborhood (Simpson 0.62)
- Race & ethnicity
- Black 46% White 41% Hispanic / Latino 6% Two or more races 5% Asian 4%
- Hispanic origin (detail)
- Mexican 2%
- Common ancestry
- Romanian 2% Lithuanian 1% Slovak 1%
- Foreign-born
- 9% · Canada
- Languages at home
- 88% English-only · Spanish 5% Other Indo-European 1% Chinese 1%
Political lean MEDSL · Fulton
- 2024 margin
- Solid D (+44.9) · D 71.9% · R 27.0% · Other 1.1%
- 2008→2024 swing
- +9.8pp toward D · 2008: 35.0pp · 2024: 44.9pp
- All cycles
- 2024: D+44.9 2020: D+46.4 2016: D+42.1 2012: D+29.6 2008: D+35.0
Not yet ingested
- Civics
- —
Market trends
- HPI YoY
- ▼ -507.19%
- Current HPI
- 240.8692
- Rent YoY
- ▲ 2.84%
- Metro
- Atlanta-Sandy Springs-Alpharetta, GA
- State GDP YoY
- ▲ 2.66%
- F500 in state
- 28
Industry mix (Fortune 500 HQ in GA)
| Industry | F500 HQs | Revenue |
|---|---|---|
| Paper / Packaging | 2 | $29B |
|
||
| Retail | 1 | $160B |
|
||
| Transportation / Logistics | 1 | $91B |
|
||
| Airlines | 1 | $62B |
|
||
| Consumer Goods | 1 | $47B |
|
||
| Utilities | 1 | $25B |
|
||
Price history
2 events — show timeline
- 2026-06-01 Listing Removed — GAMLS
- 2026-04-29 Listed $1,175,000 GAMLS
Cash-flow waterfall
monthlySold comps — $/sqft
last 12 mo · ≤1 miLoading sold comps…