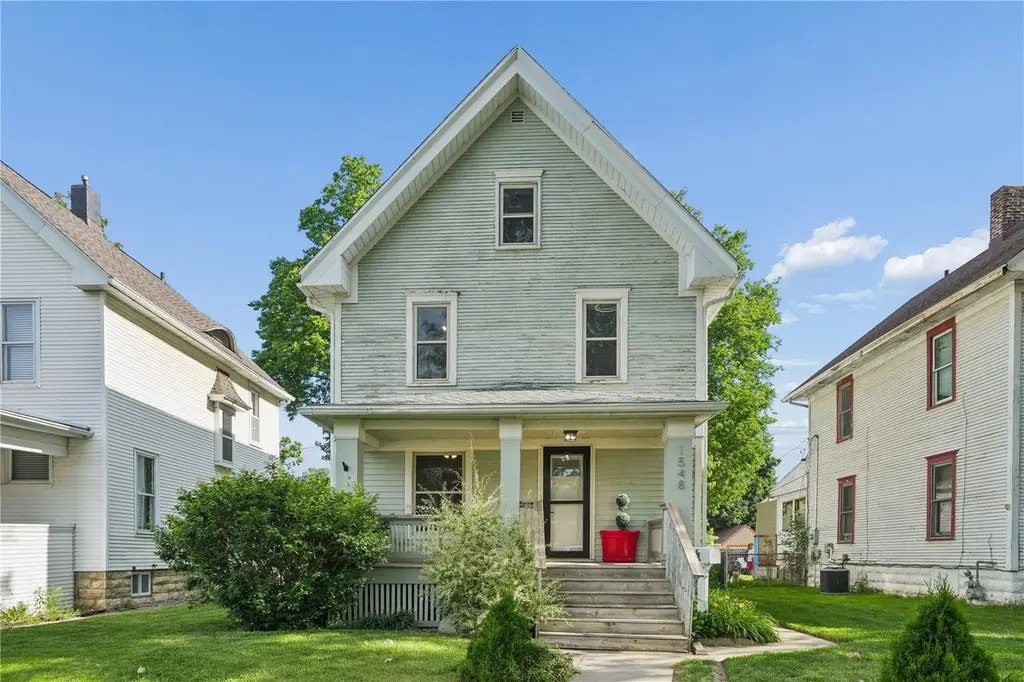
1548 6th Ave Ave · Cedar Rapids, IA
Flood risk 1/10 · Minimal
- FEMA flood zone
- X (unshaded)
- Chance of flooding over 30 yrs
- 0.0%
- Est. flood insurance / yr
- $473 – $860
Fire risk 2/10 · Minimal
- Est. fire insurance / yr
- $902 – $1,676
Heat risk 3/10 · Minor
- Hot days now (above 103°F)
- 7 days/yr
- Hot days in 30 yrs
- 15 days/yr
Wind risk 2/10 · Minimal
- Chance of severe wind over 30 yrs
- —
Air-quality risk 2/10 · Minimal
- Unhealthy air days now
- 1 days/yr
- Unhealthy air days in 30 yrs
- 2 days/yr
Risk factors via First Street. Map © Google.
Why this score? — see what drove the D- grade
The composite is a weighted blend of 9 inputs, each scored 0–100. Each bar is that input's sub-score; the figure is the points it added to the 100-point composite (weight × sub-score).
- Cash flow +12.5/30.0
- Rent growth +5.0/5.0
- Schools +4.7/10.0
- Livability +3.9/5.0
- DSCR +3.7/10.0
- 1% rule +3.2/10.0
- ARV discount +2.9/15.0
- Condition / age +2.5/5.0
- Appreciation +0.0/10.0
$170,000
🖨 Deal sheet 📄 Offer letter ✓ Due diligence
Listing remarks
Charming and well-maintained 2-story home built in 1915, offering a perfect blend of historic character and modern updates. This inviting residence features 3 bedrooms(4th non-conforming attic room) and 2 full bathrooms, along with a thoughtfully updated kitchen and renovated bathrooms that provide contemporary comfort and style. The convenient main-floor laundry adds everyday functionality, while the home's excellent upkeep reflects pride of ownership throughout. With spacious living area, timeless appeal, and numerous updates, this move-in-ready home is an exceptional opportunity for buyers seeking both character and convenience.
Key facts
- Renovated bathrooms
- Move-in-ready
- Historic character
Tags
Property features AI
Exterior
- Parking: Detached garage; Garage door opener; Off-street and on-street parking; 1 garage space
- Utilities: Public water; Public sewer
- Home design: Single-family residence; Two-story
- Construction: Frame construction with wood siding
- Exterior features: Deck; Fenced yard; Pets allowed
Interior
- Kitchen: Dishwasher; Microwave; Range; Refrigerator
- Bedrooms: 7 total rooms (bedroom count not specified)
- Bathrooms: 2 full bathrooms
- Heating & cooling: Natural gas forced air heating; Window/wall air conditioning units
- Interior features: Dishwasher; Gas water heater; Microwave; Range; Refrigerator; Full basement
- Laundry & utility: Laundry on main level
Neighborhood map
What this means for you Summary
Snapshot
- This is a 3-bed/2.5-bath single-family listed at $170k.
Deal economics
- At list price, monthly cash flow is $-24 ($-282/yr) — negative.
- To cash-flow at today's rent, offer at most $166k (2.4% below list).
- To meet the 1% rule (rent ≥ 1% of price), the offer needs to be $140k (17.8% below list).
- Recommended offer: $140k (17.8% below list) — sets the bar for 1% rule.
- Cap rate 6.1% vs local median 3.5% in Cedar Rapids — top-decile yield for the area; either an underpriced asset or a hidden risk that comps aren't pricing in. Stress-test before assuming the spread holds.
Location & tenants
- Location reads 78/100 on livability (#134 in IA, #2,474 nationally) — a middle-class / working-renter tenant base. Strengths: cost of living A+, housing A+, health & safety A+; Watch: crime C-, commute F.
- Cedar Rapids Community School District (urban): math 50% / reading 59% proficiency, ranked #265 of 289 in IA (top 92%) — acceptable for families but not a draw, mixed tenant base, ~2y average lease.
- Zoned schools: Johnson Steam Academy School (math 32% / reading 37%, grade F, #595 of 616 statewide, top 97%, 346 students, 74% FRL); Mckinley Steam Academy (math 45% / reading 55%, grade C, #216 of 246 statewide, top 88%, 448 students, 52% FRL); George Washington High School (math 44% / reading 62%, grade C-, #296 of 336 statewide, top 88%, 1,291 students, 49% FRL) — zoned schools average 59% FRL vs 43% district-wide (15 pts higher); higher-poverty schools than district average — tighter screening recommended.
- Market conditions: Rents rising fast (+14.7%/yr); 236 active listings in the ZIP; 4 comparable units currently listed for rent nearby; rentals lingering (median 44d on market — plan ~5-8 weeks vacancy on turnover, expect pricing pressure); 50% of comp listings sitting > 30 days — soft ceiling on asking rent; 1,023 units permitted in Linn County in 2024 (456 in 5+ unit buildings).
Forward outlook
- Local home prices are declining (-3.0%/yr); year-one equity from $1k of loan paydown is wiped out by about $5k of value loss. Plan a longer hold.
- Linn County population projected at +16% by 2050 — long-run rental-demand tailwind backs the buy-and-hold thesis.
Negotiation context
- Only 2 days on market — expect competitive offers; lowballing is unlikely to land.
- Current owner paid $82k; list at $170k implies a 107% gain — meaningful room to come down on a strong offer.
Risks & watch-outs
- Watch-outs: built in 1915 — expect roof / HVAC / electrical / plumbing capex.
Questions for the listing agent
- What do current leases actually rent for vs. the listed asking? Can we see a recent rent roll and the last 12 months of T-12 income?
- Built in 1915 — when were the roof, HVAC, electrical panel, plumbing, and water heater last replaced?
- Is there a deadline driving the sale (1031 exchange, divorce, estate, relocation)? That informs how much negotiation room exists.
- Schools are B-rated — typically a magnet for longer-tenancy family renters. What's the average tenant stay here, and is there a school-zone premium baked into asking?
- The area grade is low — what's the realistic commute time and amenity access for the typical tenant pool here? Any planned neighborhood developments (good or bad) we should know about?
- What's the average days-on-market for RENTAL listings here right now (not sales)? A rising rental-DOM trend means longer vacancies and softer asking-rent achievability than the comps imply.
- What's the recent tenant-quality profile in this submarket — average credit score on applications, eviction rate, late-payment / NSF rate, and stable-employment percentage? A property-management company in the area should have these aggregated.
- How much new for-sale + rental construction is in the pipeline within 1–3 miles? Heavy new supply typically softens prices + rents 12–24 months out; constrained supply supports both.
Investment metrics
- 1% rule
- 0.82% ✗
- Cap rate
- 6.13%
- Cash-on-cash
- -0.59%
- DSCR
- 0.97
- GRM
- 10.1
CMA / ARV
- ARV (on-the-fly)
- $154,112
- Comps found
- 12
Show comp detail 12 sales within ~0.75 mi
| Address | Dist | Beds/Ba | Sqft | Sold | Price | $/sf | Match |
|---|---|---|---|---|---|---|---|
| 513 16th ST St SE | 0.03mi | 3/1.5 | 1,332 (-3%) | 1mo | $150,000 | $113 | 88 |
| 847 Camburn Ct SE | 0.25mi | 3/1.0 | 1,350 (-2%) | 1mo | $148,000 | $110 | 78 |
| 846 15th St SE | 0.26mi | 3/1.5 | 1,332 (-3%) | 1mo | $121,900 | $92 | 78 |
| 1431 5th Ave SE | 0.13mi | 3/1.5 | 1,274 (-7%) | 2mo | $125,000 | $98 | 76 |
| 1529 6th Ave SE | 0.04mi | 3/1.0 | 1,248 (-9%) | 1mo | $60,000 | $48 | 76 |
| 1442 4th Ave SE | 0.19mi | 3/1.0 | 1,232 (-10%) | 1mo | $138,000 | $112 | 67 |
| 330 Crescent St SE | 0.70mi | 3/2.0 | 1,418 (+3%) | 0mo | $282,500 | $199 | 60 |
| 2253 Meadowbrook Dr Dr SE | 0.69mi | 3/2.0 | 1,325 (-4%) | 1mo | $204,000 | $154 | 59 |
| 1751 Higley Ave Ave SE | 0.32mi | 2/1.0 (-1) | 1,232 (-10%) | 1mo | $117,500 | $95 | 56 |
| 335 18th St SE | 0.49mi | 3/1.5 | 1,529 (+11%) | 1mo | $189,000 | $124 | 54 |
| 385 21st St St SE | 0.54mi | 3/2.0 | 1,555 (+13%) | 0mo | $255,000 | $164 | 51 |
| 2039 Park Ave SE | 0.59mi | 2/1.5 (-1) | 1,221 (-11%) | 0mo | $95,000 | $78 | 45 |
Match score weights: distance 35% · size 25% · config 20% · recency 20%. Top-matched comps best support the ARV.
Projected returns pro-forma
-3.0% appreciation · 8.0% rent growth · sell at horizon
- IRR
- -12.0%
- Equity multiple
- 0.54×
- Total profit
- $-21,670
- Equity at exit
- $25,348
- IRR
- 3.1%
- Equity multiple
- 1.27×
- Total profit
- $12,774
- Equity at exit
- $14,698
Cash invested: $47,600 (down + closing). Projections, not guarantees.
Landlord ↔ Tenant lean methodology
- Overall (STATE)
- 83 Strongly Landlord-Friendly
- State Iowa
- 83 Strongly Landlord-Friendly · R+6
- County
- — inherits STATE
- City
- — inherits STATE
ZIP-level market 52403
- Rents YoY
- 14.7%
- Active inventory
- 236
- Price-to-rent
- 10.1×
Monthly cashflow live
- Estimated rent
- $1,397 medium interval (Pro) →
- Mortgage (P&I)
- −$891
- Tax from tax record
- −$165 /mo · $1,980/yr
- Insurance
- −$71
- HOA
- −$0
- Vacancy / Maint / Mgmt
- −$293
- Net cashflow
- $-24
Break-even live
UW: 25.0% down · 7.5% · 30yr · 1.5% tax · 5.0% vac · 8.0% maint · 8.0% mgmt
Financing live
Cash to close
- Down payment
- $42,500
- Closing costs
- $5,100
- Reserves months
- —
- Total cash needed
- —
Loan-product check · same deal, 3 products live
Conventional
25% down · 7.5% · 30yr
- Down + closing
- —
- Monthly P&I
- —
- Monthly cashflow
- —
- DSCR
- —
- Eligible?
- —
Personal DTI + credit; lowest rate.
DSCR
20% down · 8.5% · 30yr
- Down + closing
- —
- Monthly P&I
- —
- Monthly cashflow
- —
- DSCR
- —
- Eligible?
- —
No personal income docs; deal must DSCR.
Hard money
10% down · 12.0% · 12mo
- Down + closing
- —
- Monthly P&I
- —
- Monthly cashflow
- —
- DSCR
- —
- Eligible?
- —
Short-term bridge; refi at stabilization.
Rent comps 4 comps
| Address | Beds | Baths | Sqft | Rent | $/sqft | DOM | Units | Dist |
|---|---|---|---|---|---|---|---|---|
| 730 Wellington St SE Cedar Rapids, IA | 3.0 | 1.0 | 1366 | $1,325 | $0.97 | 21d | 1 | 0.24mi |
| 906 10th St SE Cedar Rapids, IA | 1.0–2.0 | 1.0–2.0 | 890 | $1,300 | $1.46 | 13d | 6 | 0.41mi |
| 1017 19th St SE Cedar Rapids, IA | 3.0 | 1.0 | 946 | $1,100 | $1.16 | 43d | 1 | 0.53mi |
| 511 23rd St NE Cedar Rapids, IA | 2.0 | 1.0 | 888 | $1,500 | $1.69 | 43d | 1 | 1.29mi |
Listing history 3 events
-
2026-06-08status $170,000 Pending 2 DOM
-
2026-06-07remarks 639-char remark
-
2026-06-07$170,000 Active 2 DOM
ⓘ Source: listings_history table (triggers on properties + properties_extension) + one-shot
backfill from property_details.listing_events for pre-trigger history.
Tax reassessment forecast IA · Partial reset (capped growth)
- Current annual tax
- $1,980 · $165/mo
- Projected year-2 tax
- $2,324 · $194/mo
- Expected delta
- +$344/yr (+$29/mo · 17.4%)
ⓘ Screening estimate from a state-policy table — verify with the county assessor before closing.
Climate risk First Street
- Flood 1/10 Low FEMA zone X (unshaded) · 0% chance over 30 yrs
- Wildfire 2/10 Low
- Heat 3/10 Moderate 7 d/yr ≥103°F today · 15 d/yr by 30 yrs out
- Wind 2/10 Low
- Air quality 2/10 Low 1 unhealthy d/yr today · 2 by 30 yrs out
Nearby sold comps map
Loading sold comps map…
Walkable amenities ~0.75 mi
Loading nearby amenities…
Taxation est. · year 1
- Rental income
- $16,767
- − Mortgage interest
- −$9,523
- − Property taxes
- −$1,980
- − Insurance
- −$850
- − Repairs & maintenance
- −$1,341
- − Management
- −$1,341
- − Depreciation
- −$4,945
- Taxable loss
- −$3,214
- Est. tax savings @ 24.0%
- +$771
- After-tax cash flow
- $489/yr
For passive investors: Depreciation is non-cash, so a rental often shows a tax loss while cash-flowing — sheltering income. Rental losses are passive: they offset passive income freely, and up to $25,000/yr can offset ordinary (W-2) income if you actively participate and your MAGI is under $100k (phasing out to $0 by $150k); unused losses carry forward. On sale, claimed depreciation is recaptured at up to 25%, and gains may owe capital-gains tax (a 1031 exchange can defer both). Figures are a year-1 estimate at your 24.0% rate — not tax advice; consult a CPA.
Schools (NCES district)
- District
- Cedar Rapids Community School District
- NCES district ID
- 1906540
- Math proficiency
- 50% ▼ -12.00%
- Reading proficiency
- 59% ▼ -6.00%
- Median HH income
- $53,568
- Composite
- 46.82/100
- National rank
- #2378
- State rank
- #265 of 289 in IA
Livability — Cedar Rapids
- Score
- 78/100
- State rank
- #134
- US rank
- #2474
Category grades
Schools grade is shown separately in the Schools card above.
Census & demographics
- Census place
- Cedar Rapids, IA
- County
- Linn County · 179,860 people
- City population
- 137,154
- Metro
- Cedar Rapids, IA
- Population (ZIP)
- 22,551
- Household income
- $74,703
- Rent vs Own
- Severe rent burden
- 452.0
Population outlook (Linn County) Hauer SSP2
- Today (2025)
- 239,589 people
- By 2030
- 248,587 · +3.8%
- By 2040
- 264,817 · +10.5%
- By 2050
- 278,685 · +16.3%
- By 2075
- 311,754 · +30.1%
- By 2100
- 336,773 · +40.6%
Race, ethnicity, and origin ACS 2023
- Neighborhood character
- Predominantly White (85%)
- Race & ethnicity
- White 85% Black 7% Two or more races 5% Hispanic / Latino 3%
- Common ancestry
- Italian 3% Slovak 3% Portuguese 3%
- Foreign-born
- 3% · Canada
- Languages at home
- 95% English-only · Spanish 3% Other Indo-European 1%
Political lean MEDSL · Linn
- 2024 margin
- Lean D (+9.9) · D 54.2% · R 44.3% · Other 1.4%
- 2008→2024 swing
- -11.6pp toward R · 2008: 21.5pp · 2024: 9.9pp
- All cycles
- 2024: D+9.9 2020: D+13.7 2016: D+9.0 2012: D+17.6 2008: D+21.5
Not yet ingested
- Civics
- —
Market trends
- HPI YoY
- ▼ -170.15%
- Current HPI
- 196.1114
- Rent YoY
- ▲ 14.67%
- Metro
- Cedar Rapids, IA
- State GDP YoY
- ▲ 2.48%
- F500 in state
- 4
Industry mix (Fortune 500 HQ in IA)
| Industry | F500 HQs | Revenue |
|---|---|---|
| Financial Services | 1 | $16B |
|
||
| Retail / Convenience | 1 | $15B |
|
||
Price history
+107.3% since first listed2 events — show timeline
- 2026-06-05 Listed $170,000 CRAAR, CDRMLS
- 2013-05-28 Sold (Public Records) $82,000 Public Records
Property tax history
+3.3%/yrLatest (2025): $1,980 · +15.5% YoY. Source: county tax records.
Cash-flow waterfall
monthlySold comps — $/sqft
last 12 mo · ≤1 miLoading sold comps…