41 Lynnwood Cir · Clarksville, TN
Flood risk 1/10 · Minimal
- FEMA flood zone
- X (unshaded)
- Chance of flooding over 30 yrs
- 0.0%
- Est. flood insurance / yr
- $507 – $1,088
Fire risk 2/10 · Minimal
- Est. fire insurance / yr
- $949 – $1,763
Heat risk 6/10 · Moderate
- Hot days now (above 107°F)
- 7 days/yr
- Hot days in 30 yrs
- 21 days/yr
Wind risk 4/10 · Minor
- Chance of severe wind over 30 yrs
- 10.0%
Air-quality risk 1/10 · Minimal
- Unhealthy air days now
- 0 days/yr
- Unhealthy air days in 30 yrs
- 0 days/yr
Risk factors via First Street. Map © Google.
Why this score? — see what drove the B- grade
The composite is a weighted blend of 9 inputs, each scored 0–100. Each bar is that input's sub-score; the figure is the points it added to the 100-point composite (weight × sub-score).
- Cash flow +30.0/30.0
- 1% rule +10.0/10.0
- DSCR +10.0/10.0
- ARV discount +7.5/15.0
- Livability +4.2/5.0
- Rent growth +2.8/5.0
- Schools +2.5/10.0
- Condition / age +2.5/5.0
- Appreciation +0.0/10.0
$53,900
🖨 Deal sheet 📄 Offer letter ✓ Due diligence
Listing remarks
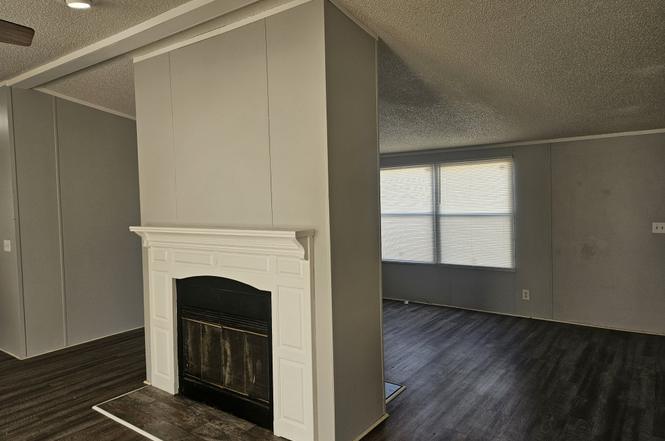
don't wait to have summer time fun in your new home! This is a very spacious 4 bedroom, 2 bath home with a beautiful layout. The living room and dining area has a fireplace for warm and cozy days at home. This home has plenty of storage spaces throughout the home. Primary bathroom has a large garden tub along with a stand alone shower and plenty of space to move easily. Each guest room has space for a double size bed and dresser! This home comes with all kitchen appliances. Let us assist you with Springing into your new home! Come in or schedule your tour today!
Key facts
- Built 2026
- Listed 159 days
Property features AI
Finance
- Other: Address: 41 Lynnwood Cir, Clarksville, TN 37040; Status: Active
- Financial info: List price: $59,900
Exterior
- Home design: Single section, 4 bed 2 bath plan; Spec home (new construction inventory)
- Construction: Built/recorded living area: 1960; Single-family property type
Interior
- Bedrooms: 4 bedrooms
- Bathrooms: 2 full bathrooms
- Interior features: Dishwasher; Disposal; Refrigerator
Neighborhood map
What this means for you Summary
Snapshot
- This is a 4-bed/2.0-bath manufactured listed at $54k.
Deal economics
- At list price, monthly cash flow is $951 ($11k/yr) — positive.
- The deal already cash-flows at list — no discount required.
- Meets the 1% rule at list price ($2k rent vs $54k).
- Recommended offer: $47k (12.0% below list) — sets the bar for market timing.
- Cap rate 27.5% vs local median 3.5% in Clarksville — top-decile yield for the area; either an underpriced asset or a hidden risk that comps aren't pricing in. Stress-test before assuming the spread holds.
Location & tenants
- Location reads 84/100 on livability (#1 in TN, #798 nationally) — a professional / high-income tenant draw. Strengths: amenities A+, commute A+, cost of living A+; Watch: employment C-, crime D+.
- Montgomery County (urban): math 25% / reading 31% proficiency, ranked #65 of 139 in TN (top 47%) — low school quality limits family demand, transient renter base, plan for 1-2y turnover.
- Market conditions: Rents rising (+1.3%/yr); 604 active listings in the ZIP; 14 comparable units currently listed for rent nearby; rentals at typical pace (median 21d on market — plan ~3-4 weeks tenant-placement turnaround); 2,583 units permitted in Montgomery County in 2024 (617 in 5+ unit buildings).
Forward outlook
- Local home prices are declining (-3.0%/yr); year-one equity from $373 of loan paydown is wiped out by about $2k of value loss. Plan a longer hold.
- Montgomery County population projected at +49% by 2050 — long-run rental-demand tailwind backs the buy-and-hold thesis.
- At projected returns (-3.0% appreciation + 1.3% rent growth), your $15k cash investment doubles in ~2 years — after that, you're playing with house money.
Negotiation context
- It's been on market 159 days — a 12% lower offer ($47k) is reasonable based on typical stale-listing flexibility.
Risks & watch-outs
- Climate carrying-cost: extreme-heat days projected 7→21/yr by 2055 (HVAC capex compounding) — expect insurance premiums to compound above CPI over the hold.
Questions for the listing agent
- It's been on market 159 days. Have you received any prior offers? Is the seller open to a 12% concession, seller financing, or rate buy-down credit?
- Why hasn't it sold? Are there any deal-killer items the seller is aware of (foundation, flood, title, zoning, code violations)?
- Is there a deadline driving the sale (1031 exchange, divorce, estate, relocation)? That informs how much negotiation room exists.
- Crime grade is D in this area — have there been break-ins, vandalism, or insurance claims at this property in the last 3 years? What carrier currently insures it and at what premium?
- What's the average days-on-market for RENTAL listings here right now (not sales)? A rising rental-DOM trend means longer vacancies and softer asking-rent achievability than the comps imply.
- What's the recent tenant-quality profile in this submarket — average credit score on applications, eviction rate, late-payment / NSF rate, and stable-employment percentage? A property-management company in the area should have these aggregated.
- How much new for-sale + rental construction is in the pipeline within 1–3 miles? Heavy new supply typically softens prices + rents 12–24 months out; constrained supply supports both.
Investment metrics
- 1% rule
- 3.11% ✓
- Cap rate
- 27.46%
- Cash-on-cash
- 75.59%
- DSCR
- 4.36
- GRM
- 2.7
CMA / ARV
No comps found within radius.
Projected returns pro-forma
-3.0% appreciation · 1.32% rent growth · sell at horizon
- IRR
- 73.6%
- Equity multiple
- 4.25×
- Total profit
- $49,057
- Equity at exit
- $8,037
- IRR
- 76.9%
- Equity multiple
- 8.27×
- Total profit
- $109,742
- Equity at exit
- $4,660
Cash invested: $15,092 (down + closing). Projections, not guarantees.
Landlord ↔ Tenant lean methodology
- Overall (STATE)
- 87 Strongly Landlord-Friendly
- State Tennessee
- 87 Strongly Landlord-Friendly · R+13
- County
- — inherits STATE
- City
- — inherits STATE
ZIP-level market 37040
- Home prices YoY
- -22.0%
- Rents YoY
- 1.3%
- Active inventory
- 604
- Price-to-rent
- 2.7×
Monthly cashflow live
- Estimated rent
- $1,675 high interval (Pro) →
- Mortgage (P&I)
- −$283
- Tax est. 1.5%
- −$67 /mo · $808/yr
- Insurance
- −$22
- HOA
- −$0
- Vacancy / Maint / Mgmt
- −$352
- Net cashflow
- $951
Break-even live
UW: 25.0% down · 7.5% · 30yr · 1.5% tax · 5.0% vac · 8.0% maint · 8.0% mgmt
Financing live
Cash to close
- Down payment
- $13,475
- Closing costs
- $1,617
- Reserves months
- —
- Total cash needed
- —
Loan-product check · same deal, 3 products live
Conventional
25% down · 7.5% · 30yr
- Down + closing
- —
- Monthly P&I
- —
- Monthly cashflow
- —
- DSCR
- —
- Eligible?
- —
Personal DTI + credit; lowest rate.
DSCR
20% down · 8.5% · 30yr
- Down + closing
- —
- Monthly P&I
- —
- Monthly cashflow
- —
- DSCR
- —
- Eligible?
- —
No personal income docs; deal must DSCR.
Hard money
10% down · 12.0% · 12mo
- Down + closing
- —
- Monthly P&I
- —
- Monthly cashflow
- —
- DSCR
- —
- Eligible?
- —
Short-term bridge; refi at stabilization.
Rent comps 14 comps
| Address | Beds | Baths | Sqft | Rent | $/sqft | DOM | Units | Dist |
|---|---|---|---|---|---|---|---|---|
| 278 Kettering Ct Unit 189 Clarksville, TN | 3.0 | 2.0 | 1456 | $1,369 | $0.94 | 13d | 1 | 0.08mi |
| 64 Lynnwood Cir Unit 28 Clarksville, TN | 3.0 | 2.0 | 1456 | $1,519 | $1.04 | 21d | 1 | 0.12mi |
| 179 Lynnwood Cir Unit 103 Clarksville, TN | 3.0 | 2.0 | 1456 | $1,369 | $0.94 | 21d | 1 | 0.15mi |
| 94 Lynnwood Cir Unit 43 Clarksville, TN | 4.0 | 2.0 | 1568 | $1,439 | $0.92 | 21d | 1 | 0.26mi |
| 841 Professional Park Dr Clarksville, TN | 3.0 | 2.5 | 1330 | $1,595 | $1.20 | 21d | 1 | 0.31mi |
| 632 White Face Dr Clarksville, TN | 3.0 | 2.0 | 1700 | $1,800 | $1.06 | 13d | 1 | 0.51mi |
| 632 White Face Dr Clarksville, TN | 3.0 | 2.0 | 1700 | $1,850 | $1.09 | 21d | 1 | 0.51mi |
| 2228 Killington Dr Clarksville, TN | 4.0 | 2.0 | 1729 | $1,900 | $1.10 | 21d | 1 | 0.56mi |
| 537 Bellamy Ln Clarksville, TN | 3.0 | 2.5 | 1401 | $1,800 | $1.28 | 21d | 1 | 0.68mi |
| 650 Appomattox Ct Clarksville, TN | 3.0 | 2.0 | 2493 | $2,400 | $0.96 | 13d | 1 | 0.83mi |
| 709 Valencia Dr Clarksville, TN | 4.0 | 2.5 | 2213 | $2,495 | $1.13 | 21d | 1 | 1.08mi |
| 1115 Thornberry Dr Clarksville, TN | 3.0 | 2.0 | 1716 | $1,995 | $1.16 | 13d | 1 | 1.20mi |
| 2157 Watertown Pl Clarksville, TN | 3.0 | 2.0 | 1275 | $1,550 | $1.22 | 13d | 1 | 1.36mi |
| 2157 Watertown Pl Clarksville, TN | 3.0 | 2.0 | 1275 | $1,550 | $1.22 | 21d | 1 | 1.36mi |
Listing history 15 events
-
2026-06-18days on market $53,900 Active 159 DOM
-
2026-06-17days on market $53,900 Active 158 DOM
-
2026-06-16days on market $53,900 Active 157 DOM
-
2026-06-15days on market $53,900 Active 156 DOM
-
2026-06-14remarks 568-char remark
-
2026-06-14days on market $53,900 Active 154 DOM
-
2026-06-13days on market $53,900 Active 153 DOM
-
2026-06-09days on market $53,900 Active 150 DOM
-
2026-06-08days on market $53,900 Active 149 DOM
-
2026-06-07days on market $53,900 Active 148 DOM
-
2026-06-05days on market $53,900 Active 145 DOM
-
2026-06-03days on market $53,900 Active 144 DOM
-
2026-06-02days on market $53,900 Active 143 DOM
-
2026-05-31days on market $53,900 Active 141 DOM
-
2026-05-30days on market $53,900 Active 140 DOM
ⓘ Source: listings_history table (triggers on properties + properties_extension) + one-shot
backfill from property_details.listing_events for pre-trigger history.
Climate risk First Street
- Flood 1/10 Low FEMA zone X (unshaded) · 0% chance over 30 yrs
- Wildfire 2/10 Low
- Heat 6/10 Major 7 d/yr ≥107°F today · 21 d/yr by 30 yrs out
- Wind 4/10 Moderate 10% chance of damaging wind over 30 yrs
- Air quality 1/10 Low 0 unhealthy d/yr today · 0 by 30 yrs out
Nearby sold comps map
Loading sold comps map…
Walkable amenities ~0.75 mi
Loading nearby amenities…
Taxation est. · year 1
- Rental income
- $20,099
- − Mortgage interest
- −$3,019
- − Property taxes
- −$808
- − Insurance
- −$270
- − Repairs & maintenance
- −$1,608
- − Management
- −$1,608
- − Depreciation
- −$1,568
- Taxable income
- $11,218
- Est. tax owed @ 24.0%
- −$2,692
- After-tax cash flow
- $8,716/yr
For passive investors: Depreciation is non-cash, so a rental often shows a tax loss while cash-flowing — sheltering income. Rental losses are passive: they offset passive income freely, and up to $25,000/yr can offset ordinary (W-2) income if you actively participate and your MAGI is under $100k (phasing out to $0 by $150k); unused losses carry forward. On sale, claimed depreciation is recaptured at up to 25%, and gains may owe capital-gains tax (a 1031 exchange can defer both). Figures are a year-1 estimate at your 24.0% rate — not tax advice; consult a CPA.
Schools (NCES district)
- District
- Montgomery County
- NCES district ID
- 4703030
- Math proficiency
- 25% ▼ -20.00%
- Reading proficiency
- 31% ▼ -10.00%
- Median HH income
- $50,423
- Composite
- 24.56/100
- National rank
- #7641
- State rank
- #65 of 139 in TN
Livability — Clarksville
- Score
- 84/100
- State rank
- #1
- US rank
- #798
Category grades
Schools grade is shown separately in the Schools card above.
Census & demographics
- Census place
- Clarksville, TN
- County
- Montgomery County · 211,371 people
- City population
- 211,371
- Metro
- Clarksville, TN-KY
- Population (ZIP)
- 64,977
- Household income
- $67,745
- Rent vs Own
- Severe rent burden
- 2670.0
Population outlook (Montgomery County) Hauer SSP2
- Today (2025)
- 236,633 people
- By 2030
- 258,978 · +9.4%
- By 2040
- 305,456 · +29.1%
- By 2050
- 353,147 · +49.2%
- By 2075
- 471,289 · +99.2%
- By 2100
- 564,122 · +138.4%
Race, ethnicity, and origin ACS 2023
- Neighborhood character
- Diverse neighborhood (Simpson 0.61)
- Race & ethnicity
- White 56% Black 25% Two or more races 11% Hispanic / Latino 10% Asian 2%
- Hispanic origin (detail)
- Mexican 6% Puerto Rican 2%
- Common ancestry
- Italian 4% Lithuanian 1% Slovak 1%
- Foreign-born
- 6% · Canada, South Korea
- Languages at home
- 90% English-only · Spanish 5% Other Asian/Pacific 1% Other Indo-European 1%
Political lean MEDSL · Montgomery
- 2024 margin
- R (+18.4) · D 40.0% · R 58.5% · Other 1.5%
- 2008→2024 swing
- -10.5pp toward R · 2008: -7.9pp · 2024: -18.4pp
- All cycles
- 2024: R+18.4 2020: R+12.7 2016: R+18.6 2012: R+10.5 2008: R+7.9
Not yet ingested
- Civics
- —
Market trends
- HPI YoY
- ▼ -75.79%
- Current HPI
- 269.0601
- Rent YoY
- ▲ 1.32%
- Metro
- Clarksville, TN-KY
- State GDP YoY
- ▲ 2.78%
- F500 in state
- 22
Industry mix (Fortune 500 HQ in TN)
| Industry | F500 HQs | Revenue |
|---|---|---|
| Healthcare | 3 | $91B |
|
||
| Retail | 3 | $72B |
|
||
| Transportation / Logistics | 1 | $88B |
|
||
| Paper / Packaging | 1 | $19B |
|
||
| Insurance | 1 | $13B |
|
||
| Energy | 1 | $12B |
|
||
Cash-flow waterfall
monthlySold comps — $/sqft
last 12 mo · ≤1 miLoading sold comps…