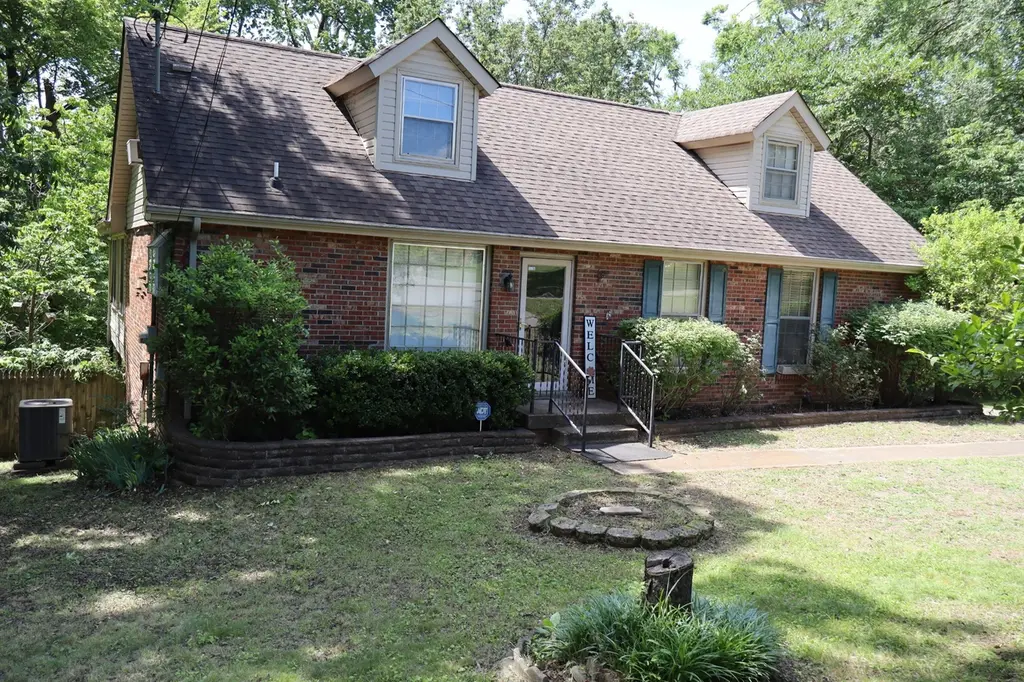
236 Santa Rosa Ct · Green Hill, TN
Flood risk 1/10 · Minimal
- FEMA flood zone
- X (unshaded)
- Chance of flooding over 30 yrs
- 0.0%
- Est. flood insurance / yr
- $473 – $860
Fire risk 3/10 · Minor
- Est. fire insurance / yr
- $949 – $1,763
Heat risk 5/10 · Moderate
- Hot days now (above 105°F)
- 7 days/yr
- Hot days in 30 yrs
- 20 days/yr
Wind risk 4/10 · Minor
- Chance of severe wind over 30 yrs
- 9.0%
Air-quality risk 2/10 · Minimal
- Unhealthy air days now
- 1 days/yr
- Unhealthy air days in 30 yrs
- 3 days/yr
Risk factors via First Street. Map © Google.
Why this score? — see what drove the D+ grade
The composite is a weighted blend of 9 inputs, each scored 0–100. Each bar is that input's sub-score; the figure is the points it added to the 100-point composite (weight × sub-score).
- ARV discount +15.0/15.0
- Cash flow +13.8/30.0
- DSCR +4.2/10.0
- Schools +3.8/10.0
- Livability +3.4/5.0
- 1% rule +2.7/10.0
- Rent growth +2.6/5.0
- Condition / age +2.5/5.0
- Appreciation +0.0/10.0
$325,000
🖨 Deal sheet 📄 Offer letter ✓ Due diligence
Listing remarks
Great location in a quiet cul-de-sac with a park like back yard with large mature trees with lots of shade. Very close to shopping of all kinds but tucked away down a dead end street. Lots of sq. ft. to work with here. Large bonus room upstairs could be 4th bedroom as it has a closet and office nook. Big sun room with lots of windows off living room. Fire place in living room. In the basement there are two big rooms and a kitchenette area great for mother in law apartment. Kitchen has been remodeled. Lots of hardwood flowers. Large wooden deck for summer cooks outs and family get togethers. Newer hot water heater. Two car attached garage. Storage building to remain. NOTICE - All offers mu
Key facts
- Large mature trees
- Quiet cul-de-sac
- Park like back yard
Tags
Property features AI
Exterior
- Parking: Attached 2-car garage; 2 covered parking spaces (total 2 parking spaces)
- Utilities: Public water; Public sewer; Water service available
- Home design: Single family residence; Residential property; Two levels; Brick construction
- Construction: Brick exterior; Year built: approximate
- Exterior features: Sloped lot; Lot dimensions approx. 54.11 x 284.36 (irregular); Lot size approx. 0.84 acres
Interior
- Kitchen: Eat-in kitchen (approx. 16 x 13); Electric range; Dishwasher; Refrigerator
- Bedrooms: 3 bedrooms (all on the main level); Primary bedroom approx. 18 x 12; Second bedroom approx. 15 x 13; Additional bedroom/other room approx. 18 x 12
- Flooring: Carpet; Wood
- Bathrooms: 1 full bathroom; 1 half bathroom
- Heating & cooling: Central heating; Central air conditioning
- Interior features: Partially finished basement; Living room fireplace; Formal living room
- Laundry & utility: Washer hookup; Electric dryer hookup
Neighborhood map
What this means for you Summary
Snapshot
- This is a 3-bed/2.0-bath single-family listed at $325k.
Deal economics
- At list price, monthly cash flow is $32 ($385/yr) — positive.
- The deal already cash-flows at list — no discount required.
- To meet the 1% rule (rent ≥ 1% of price), the offer needs to be $250k (23.2% below list).
- Recommended offer: $250k (23.2% below list) — sets the bar for 1% rule.
- Cap rate 6.4% vs local median 3.4% in Green Hill — top-decile yield for the area; either an underpriced asset or a hidden risk that comps aren't pricing in. Stress-test before assuming the spread holds.
Location & tenants
- Location reads 68/100 on livability (#77 in TN) — a middle-class / working-renter tenant base. Strengths: employment A+, housing A+, crime A; Watch: amenities F, commute F, health & safety F.
- Wilson County (rural): math 42% / reading 43% proficiency, ranked #10 of 139 in TN (top 7%) — families likely to look elsewhere, expect single-tenant / working-renter base with shorter leases.
- Zoned schools: W A Wright Elementary (math 65% / reading 52%, grade B-, #67 of 952 statewide, top 7%, 514 students, 0% FRL); Green Hill High School (math 3% / reading 54%, grade F, #96 of 332 statewide, top 30%, 1,662 students, 0% FRL) — zoned schools average 0% FRL vs 25% district-wide (25 pts lower); this property's tenant base skews higher-income than the district average.
- Market conditions: Rents flat; 250 active listings in the ZIP; 6 comparable units currently listed for rent nearby; rentals at typical pace (median 22d on market — plan ~3-4 weeks tenant-placement turnaround); solid renter incomes; 1,927 units permitted in Wilson County in 2024 (10 in 5+ unit buildings).
- This rent runs 35% of the median local income ($85k/yr) — at the standard rent-burdened threshold; future hikes will face affordability resistance.
Forward outlook
- Local home prices are declining (-3.0%/yr); year-one equity from $2k of loan paydown is wiped out by about $10k of value loss. Plan a longer hold.
- Wilson County population projected at +47% by 2050 — long-run rental-demand tailwind backs the buy-and-hold thesis.
Negotiation context
- Only 8 days on market — expect competitive offers; lowballing is unlikely to land.
Risks & watch-outs
- Climate carrying-cost: extreme-heat days projected 7→20/yr by 2055 (HVAC capex compounding) — expect insurance premiums to compound above CPI over the hold.
Questions for the listing agent
- Built in 1975 — when were the roof, HVAC, electrical panel, plumbing, and water heater last replaced?
- Is there a deadline driving the sale (1031 exchange, divorce, estate, relocation)? That informs how much negotiation room exists.
- Schools are D-rated, which usually means shorter tenancies and higher turnover. Who's the typical renter profile here, and what's been the actual vacancy rate?
- The area grade is low — what's the realistic commute time and amenity access for the typical tenant pool here? Any planned neighborhood developments (good or bad) we should know about?
- What's the average days-on-market for RENTAL listings here right now (not sales)? A rising rental-DOM trend means longer vacancies and softer asking-rent achievability than the comps imply.
- What's the recent tenant-quality profile in this submarket — average credit score on applications, eviction rate, late-payment / NSF rate, and stable-employment percentage? A property-management company in the area should have these aggregated.
- How much new for-sale + rental construction is in the pipeline within 1–3 miles? Heavy new supply typically softens prices + rents 12–24 months out; constrained supply supports both.
Investment metrics
- 1% rule
- 0.77% ✗
- Cap rate
- 6.41%
- Cash-on-cash
- 0.42%
- DSCR
- 1.02
- GRM
- 10.8
CMA / ARV
- ARV (on-the-fly)
- $551,100
- Comps found
- 12
Show comp detail 12 sales within ~0.75 mi
| Address | Dist | Beds/Ba | Sqft | Sold | Price | $/sf | Match |
|---|---|---|---|---|---|---|---|
| 476 Brownstone St | 0.72mi | 3/2.5 | 2,533 (+1%) | 5mo | $589,990 | $233 | 59 |
| 4811 Wayside Dr | 0.73mi | 3/2.5 | 2,586 (+3%) | 0mo | $570,000 | $220 | 58 |
| 201 Ash Dale Dr | 0.72mi | 3/3.5 | 2,560 (+2%) | 2mo | $633,240 | $247 | 55 |
| 480 Brownstone St | 0.72mi | 3/2.5 | 2,604 (+4%) | 4mo | $575,000 | $221 | 55 |
| 4833 Shasta Dr | 0.53mi | 3/2.5 | 2,550 (+2%) | 19mo | $198,000 | $78 | 55 |
| 1341 Busiris Dr | 0.55mi | 4/2.5 (+1) | 2,570 (+3%) | 15mo | $535,000 | $208 | 51 |
| 4416 Churchill Pl | 0.69mi | 3/2.5 | 2,350 (-6%) | 9mo | $473,900 | $202 | 48 |
| 4837 Matterhorn Dr | 0.46mi | 3/3.0 | 2,200 (-12%) | 8mo | $445,000 | $202 | 48 |
| 4829 Shasta Dr | 0.53mi | 3/3.0 | 2,267 (-10%) | 12mo | $420,000 | $185 | 46 |
| 924 Denise Dr | 0.60mi | 4/3.0 (+1) | 2,250 (-10%) | 2mo | $504,500 | $224 | 44 |
| 2101 Maricourt St | 0.74mi | 3/2.0 | 2,172 (-13%) | 6mo | $430,000 | $198 | 38 |
| 705 Berkshire Dr | 0.41mi | 4/3.0 (+1) | 2,200 (-12%) | 21mo | $499,900 | $227 | 34 |
Match score weights: distance 35% · size 25% · config 20% · recency 20%. Top-matched comps best support the ARV.
Projected returns pro-forma
-3.0% appreciation · 0.3% rent growth · sell at horizon
- IRR
- -18.3%
- Equity multiple
- 0.37×
- Total profit
- $-57,377
- Equity at exit
- $48,459
- IRR
- -16.2%
- Equity multiple
- 0.19×
- Total profit
- $-73,620
- Equity at exit
- $28,100
Cash invested: $91,000 (down + closing). Projections, not guarantees.
Landlord ↔ Tenant lean methodology
- Overall (STATE)
- 87 Strongly Landlord-Friendly
- State Tennessee
- 87 Strongly Landlord-Friendly · R+13
- County
- — inherits STATE
- City
- — inherits STATE
ZIP-level market 37138
- Rents YoY
- 0.3%
- Active inventory
- 250
- Price-to-rent
- 10.8×
Monthly cashflow live
- Estimated rent
- $2,497 high interval (Pro) →
- Mortgage (P&I)
- −$1,704
- Tax from tax record
- −$101 /mo · $1,208/yr
- Insurance
- −$135
- HOA
- −$0
- Vacancy / Maint / Mgmt
- −$524
- Net cashflow
- $32
Break-even live
UW: 25.0% down · 7.5% · 30yr · 1.5% tax · 5.0% vac · 8.0% maint · 8.0% mgmt
Financing live
Cash to close
- Down payment
- $81,250
- Closing costs
- $9,750
- Reserves months
- —
- Total cash needed
- —
Loan-product check · same deal, 3 products live
Conventional
25% down · 7.5% · 30yr
- Down + closing
- —
- Monthly P&I
- —
- Monthly cashflow
- —
- DSCR
- —
- Eligible?
- —
Personal DTI + credit; lowest rate.
DSCR
20% down · 8.5% · 30yr
- Down + closing
- —
- Monthly P&I
- —
- Monthly cashflow
- —
- DSCR
- —
- Eligible?
- —
No personal income docs; deal must DSCR.
Hard money
10% down · 12.0% · 12mo
- Down + closing
- —
- Monthly P&I
- —
- Monthly cashflow
- —
- DSCR
- —
- Eligible?
- —
Short-term bridge; refi at stabilization.
Rent comps 6 comps
| Address | Beds | Baths | Sqft | Rent | $/sqft | DOM | Units | Dist |
|---|---|---|---|---|---|---|---|---|
| 2809 Summer Hollow Ln Hermitage, TN | 3.0 | 2.5 | 1833 | $2,406 | $1.31 | 4d | 1 | 0.69mi |
| 226 Grandview Dr Old Hickory, TN | 4.0 | 1.5 | 1875 | $2,260 | $1.21 | 24d | 1 | 0.72mi |
| 310 Griffin Pl Hermitage, TN | 3.0 | 2.5 | 1758 | $2,045 | $1.16 | 4d | 1 | 0.77mi |
| 1802 N Bonham Ct Old Hickory, TN | 3.0 | 3.0 | 2155 | $2,485 | $1.15 | 21d | 1 | 1.05mi |
| 208 E Bend Ct Old Hickory, TN | 4.0 | 2.5 | 2837 | $3,000 | $1.06 | 44d | 1 | 1.09mi |
| 3602 Sussex Ct Old Hickory, TN | 4.0 | 2.5 | 2149 | $2,620 | $1.22 | 8d | 1 | 1.13mi |
Listing history 6 events
-
2026-06-18days on market $325,000 Active 8 DOM
-
2026-06-17days on market $325,000 Active 7 DOM
-
2026-06-16days on market $325,000 Active 6 DOM
-
2026-06-15days on market $325,000 Active 5 DOM
-
2026-06-13remarks 699-char remark
-
2026-06-13$325,000 Active 3 DOM
ⓘ Source: listings_history table (triggers on properties + properties_extension) + one-shot
backfill from property_details.listing_events for pre-trigger history.
Tax reassessment forecast TN · Resets to sale price
- Current annual tax
- $1,208 · $101/mo
- Projected year-2 tax
- $2,308 · $192/mo
- Expected delta
- +$1,100/yr (+$92/mo · 91.0%)
ⓘ Screening estimate from a state-policy table — verify with the county assessor before closing.
Climate risk First Street
- Flood 1/10 Low FEMA zone X (unshaded) · 0% chance over 30 yrs
- Wildfire 3/10 Moderate
- Heat 5/10 Major 7 d/yr ≥105°F today · 20 d/yr by 30 yrs out
- Wind 4/10 Moderate 9% chance of damaging wind over 30 yrs
- Air quality 2/10 Low 1 unhealthy d/yr today · 3 by 30 yrs out
Nearby sold comps map
Loading sold comps map…
Walkable amenities ~0.75 mi
Loading nearby amenities…
Taxation est. · year 1
- Rental income
- $29,962
- − Mortgage interest
- −$18,205
- − Property taxes
- −$1,208
- − Insurance
- −$1,625
- − Repairs & maintenance
- −$2,397
- − Management
- −$2,397
- − Depreciation
- −$9,455
- Taxable loss
- −$5,325
- Est. tax savings @ 24.0%
- +$1,278
- After-tax cash flow
- $1,663/yr
For passive investors: Depreciation is non-cash, so a rental often shows a tax loss while cash-flowing — sheltering income. Rental losses are passive: they offset passive income freely, and up to $25,000/yr can offset ordinary (W-2) income if you actively participate and your MAGI is under $100k (phasing out to $0 by $150k); unused losses carry forward. On sale, claimed depreciation is recaptured at up to 25%, and gains may owe capital-gains tax (a 1031 exchange can defer both). Figures are a year-1 estimate at your 24.0% rate — not tax advice; consult a CPA.
Schools (NCES district)
- District
- Wilson County
- NCES district ID
- 4704550
- Math proficiency
- 42% ▼ -11.00%
- Reading proficiency
- 43% ▼ -4.00%
- Median HH income
- $68,429
- Composite
- 38.33/100
- National rank
- #4225
- State rank
- #10 of 139 in TN
Livability — Green Hill
- Score
- 68/100
- State rank
- #77
- US rank
- #9078
Category grades
Schools grade is shown separately in the Schools card above.
Census & demographics
- Census place
- Green Hill, TN
- County
- Davidson County · 680,067 people
- Metro
- Nashville-Davidson--Murfreesboro--Franklin, TN
- Population (ZIP)
- 22,575
- Household income
- $85,149
- Rent vs Own
- Severe rent burden
- 530.0
Population outlook (Wilson County) Hauer SSP2
- Today (2025)
- 160,409 people
- By 2030
- 176,099 · +9.8%
- By 2040
- 206,769 · +28.9%
- By 2050
- 235,383 · +46.7%
- By 2075
- 302,144 · +88.4%
- By 2100
- 343,710 · +114.3%
Race, ethnicity, and origin ACS 2023
- Neighborhood character
- Predominantly White (80%)
- Race & ethnicity
- White 80% Black 10% Hispanic / Latino 6% Two or more races 5% Asian 1%
- Hispanic origin (detail)
- Common ancestry
- Slovak 3% Italian 2% Romanian 2%
- Foreign-born
- 4% · Canada
- Languages at home
- 94% English-only · Spanish 3% Arabic 1% Other Asian/Pacific 1%
Political lean MEDSL · Wilson
- 2024 margin
- Solid R (+40.1) · D 29.4% · R 69.4% · Other 1.2%
- 2008→2024 swing
- -3.5pp toward R · 2008: -36.6pp · 2024: -40.1pp
- All cycles
- 2024: R+40.1 2020: R+37.7 2016: R+44.3 2012: R+41.6 2008: R+36.6
Not yet ingested
- Civics
- —
Market trends
- HPI YoY
- ▼ -267.63%
- Current HPI
- 283.6234
- Rent YoY
- ▲ 0.30%
- Metro
- Nashville-Davidson--Murfreesboro--Franklin, TN
- State GDP YoY
- ▲ 2.78%
- F500 in state
- 22
Industry mix (Fortune 500 HQ in TN)
| Industry | F500 HQs | Revenue |
|---|---|---|
| Healthcare | 3 | $91B |
|
||
| Retail | 3 | $72B |
|
||
| Transportation / Logistics | 1 | $88B |
|
||
| Paper / Packaging | 1 | $19B |
|
||
| Insurance | 1 | $13B |
|
||
| Energy | 1 | $12B |
|
||
Price history
1 event — show timeline
- 2026-06-10 Listed $325,000 REALTRACS as Distributed by MLS Grid
Property tax history
+1.5%/yrLatest (2025): $1,208 · +0.0% YoY. Source: county tax records.
Cash-flow waterfall
monthlySold comps — $/sqft
last 12 mo · ≤1 miLoading sold comps…