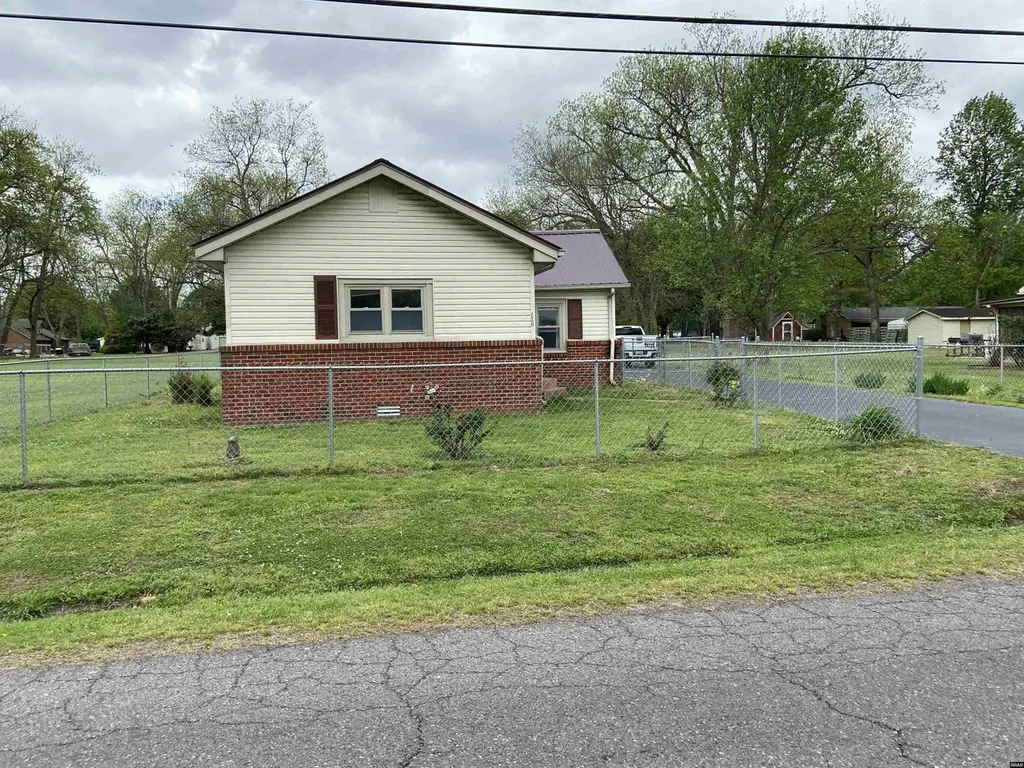
107 Bernal Ave · Hickman, KY
Flood risk 1/10 · Minimal
- FEMA flood zone
- X (unshaded)
- Chance of flooding over 30 yrs
- 0.0%
- Est. flood insurance / yr
- $507 – $1,088
Fire risk 3/10 · Minor
- Est. fire insurance / yr
- $839 – $1,559
Heat risk 6/10 · Moderate
- Hot days now (above 109°F)
- 7 days/yr
- Hot days in 30 yrs
- 22 days/yr
Wind risk 4/10 · Minor
- Chance of severe wind over 30 yrs
- 8.0%
Air-quality risk 2/10 · Minimal
- Unhealthy air days now
- 0 days/yr
- Unhealthy air days in 30 yrs
- 1 days/yr
Risk factors via First Street. Map © Google.
Why this score? — see what drove the B+ grade
The composite is a weighted blend of 9 inputs, each scored 0–100. Each bar is that input's sub-score; the figure is the points it added to the 100-point composite (weight × sub-score).
- Cash flow +28.1/30.0
- ARV discount +15.0/15.0
- DSCR +10.0/10.0
- 1% rule +7.7/10.0
- Appreciation +6.7/10.0
- Livability +3.2/5.0
- Rent growth +2.5/5.0
- Condition / age +2.5/5.0
- Schools +2.2/10.0
$79,900
🖨 Deal sheet 📄 Offer letter ✓ Due diligence
Listing remarks
Home needs some repairs inside and cosmetics, 2 bedrooms 1 bath , living room, eat in kitchen, large utility room. Metal roof, fenced yard, 3 a/c units and 3 heaters.
Key facts
- 0.72 acre lot
- 2 garage spots
- Built 1950
Property features AI
Exterior
- Parking: Attached garage; 2 garage spaces; Carport
- Utilities: Public water; Public sewer
- Home design: Single-family residence; Single story
- Construction: Vinyl siding
- Exterior features: Metal roof; Shed(s) and storage on property; Level lot; Paved road access; Lot dimensions approximately 200 x 157
Interior
- Kitchen: Dishwasher; Range
- Bedrooms: Total rooms: 5
- Flooring: Carpet; Vinyl
- Bathrooms: 1 full bathroom
- Heating & cooling: Ceiling fans; Window air conditioning units
- Interior features: Blinds on windows; Fireplace (1)
Neighborhood map
What this means for you Summary
Snapshot
- This is a 2-bed/1.0-bath single-family listed at $80k.
Deal economics
- At list price, monthly cash flow is $251 ($3k/yr) — positive.
- The deal already cash-flows at list — no discount required.
- Meets the 1% rule at list price ($1k rent vs $80k).
- Recommended offer: $75k (6.0% below list) — sets the bar for market timing.
Location & tenants
- Location reads 64/100 on livability (#308 in KY) — a middle-class / working-renter tenant base. Strengths: cost of living A+, housing A+, crime A; Watch: health & safety C-, schools F, amenities F.
- Fulton County (rural): math 20% / reading 33% proficiency, ranked #138 of 165 in KY (top 84%) — low school quality limits family demand, transient renter base, plan for 1-2y turnover; 74% free/reduced lunch — lower-income household profile, screen leases tightly.
- Market conditions: 14 active listings in the ZIP.
Forward outlook
- In year one you build about $3k of equity ($552 loan paydown + $3k appreciation (3.5% local appreciation)).
- Fulton County population projected at -24% by 2050 — secular population decline; favor cash flow + early exit over multi-decade hold.
- At projected returns (3.5% appreciation + 3.0% rent growth), your $22k cash investment doubles in ~4 years — after that, you're playing with house money.
- By year 10, paydown + projected appreciation supports a ~$32k cash-out refi (75% LTV) — recoverable capital for the next deal without selling this one.
Negotiation context
- It's been on market 65 days — a 6% lower offer ($75k) is reasonable based on typical stale-listing flexibility.
- Current owner paid $25k; list at $80k implies a 221% gain — meaningful room to come down on a strong offer.
Risks & watch-outs
- Watch-outs: built in 1950 — expect roof / HVAC / electrical / plumbing capex.
- Climate carrying-cost: extreme-heat days projected 7→22/yr by 2055 (HVAC capex compounding) — expect insurance premiums to compound above CPI over the hold.
Questions for the listing agent
- It's been on market 65 days. Have you received any prior offers? Is the seller open to a 6% concession, seller financing, or rate buy-down credit?
- Built in 1950 — when were the roof, HVAC, electrical panel, plumbing, and water heater last replaced?
- Why hasn't it sold? Are there any deal-killer items the seller is aware of (foundation, flood, title, zoning, code violations)?
- Is there a deadline driving the sale (1031 exchange, divorce, estate, relocation)? That informs how much negotiation room exists.
- Schools are F-rated, which usually means shorter tenancies and higher turnover. Who's the typical renter profile here, and what's been the actual vacancy rate?
- What's the average days-on-market for RENTAL listings here right now (not sales)? A rising rental-DOM trend means longer vacancies and softer asking-rent achievability than the comps imply.
- What's the recent tenant-quality profile in this submarket — average credit score on applications, eviction rate, late-payment / NSF rate, and stable-employment percentage? A property-management company in the area should have these aggregated.
- How much new for-sale + rental construction is in the pipeline within 1–3 miles? Heavy new supply typically softens prices + rents 12–24 months out; constrained supply supports both.
Investment metrics
- 1% rule
- 1.27% ✓
- Cap rate
- 10.06%
- Cash-on-cash
- 13.45%
- DSCR
- 1.60
- GRM
- 6.6
CMA / ARV
- ARV (on-the-fly)
- $121,500
- Comps found
- 2
Show comp detail 2 sales within ~0.75 mi
| Address | Dist | Beds/Ba | Sqft | Sold | Price | $/sf | Match |
|---|---|---|---|---|---|---|---|
| 205 Van Lee Blvd | 0.19mi | 3/1.0 (+1) | 1,140 (-6%) | 0mo | $61,000 | $54 | 76 |
| 1704 Cottonwood Dr | 0.35mi | 3/1.0 (+1) | 1,350 (+11%) | 15mo | $135,000 | $100 | 48 |
Match score weights: distance 35% · size 25% · config 20% · recency 20%. Top-matched comps best support the ARV.
Projected returns pro-forma
3.49% appreciation · 3.0% rent growth · sell at horizon
- IRR
- 21.2%
- Equity multiple
- 2.24×
- Total profit
- $27,705
- Equity at exit
- $38,155
- IRR
- 21.9%
- Equity multiple
- 4.30×
- Total profit
- $73,737
- Equity at exit
- $60,596
Cash invested: $22,372 (down + closing). Projections, not guarantees.
Landlord ↔ Tenant lean methodology
- Overall (STATE)
- 83 Strongly Landlord-Friendly
- State Kentucky
- 83 Strongly Landlord-Friendly · R+16
- County
- — inherits STATE
- City
- — inherits STATE
ZIP-level market 42050
- Home prices YoY
- 2.9%
- Active inventory
- 14
- Price-to-rent
- 6.6×
Monthly cashflow live
- Estimated rent
- $1,016 medium interval (Pro) →
- Mortgage (P&I)
- −$419
- Tax est. 1.5%
- −$100 /mo · $1,198/yr
- Insurance
- −$33
- HOA
- −$0
- Vacancy / Maint / Mgmt
- −$213
- Net cashflow
- $251
Break-even live
UW: 25.0% down · 7.5% · 30yr · 1.5% tax · 5.0% vac · 8.0% maint · 8.0% mgmt
Financing live
Cash to close
- Down payment
- $19,975
- Closing costs
- $2,397
- Reserves months
- —
- Total cash needed
- —
Loan-product check · same deal, 3 products live
Conventional
25% down · 7.5% · 30yr
- Down + closing
- —
- Monthly P&I
- —
- Monthly cashflow
- —
- DSCR
- —
- Eligible?
- —
Personal DTI + credit; lowest rate.
DSCR
20% down · 8.5% · 30yr
- Down + closing
- —
- Monthly P&I
- —
- Monthly cashflow
- —
- DSCR
- —
- Eligible?
- —
No personal income docs; deal must DSCR.
Hard money
10% down · 12.0% · 12mo
- Down + closing
- —
- Monthly P&I
- —
- Monthly cashflow
- —
- DSCR
- —
- Eligible?
- —
Short-term bridge; refi at stabilization.
Listing history 17 events
-
2026-06-18days on market $79,900 Active 65 DOM
-
2026-06-17days on market $79,900 Active 64 DOM
-
2026-06-16days on market $79,900 Active 63 DOM
-
2026-06-15days on market $79,900 Active 62 DOM
-
2026-06-13days on market $79,900 Active 60 DOM
-
2026-06-12days on market $79,900 Active 59 DOM
-
2026-06-09days on market $79,900 Active 56 DOM
-
2026-06-08days on market $79,900 Active 55 DOM
-
2026-06-07days on market $79,900 Active 54 DOM
-
2026-06-07days on market $79,900 Active 53 DOM
-
2026-06-04days on market $79,900 Active 50 DOM
-
2026-06-02days on market $79,900 Active 49 DOM
-
2026-06-01days on market $79,900 Active 48 DOM
-
2026-05-31days on market $79,900 Active 47 DOM
-
2026-05-31days on market $79,900 Active 46 DOM
-
2026-04-14$79,900 Active
-
2005-04-08soldstatus $24,900
ⓘ Source: listings_history table (triggers on properties + properties_extension) + one-shot
backfill from property_details.listing_events for pre-trigger history.
Climate risk First Street
- Flood 1/10 Low FEMA zone X (unshaded) · 0% chance over 30 yrs
- Wildfire 3/10 Moderate
- Heat 6/10 Major 7 d/yr ≥109°F today · 22 d/yr by 30 yrs out
- Wind 4/10 Moderate 8% chance of damaging wind over 30 yrs
- Air quality 2/10 Low 0 unhealthy d/yr today · 1 by 30 yrs out
Nearby sold comps map
Loading sold comps map…
Walkable amenities ~0.75 mi
Loading nearby amenities…
Taxation est. · year 1
- Rental income
- $12,196
- − Mortgage interest
- −$4,476
- − Property taxes
- −$1,198
- − Insurance
- −$400
- − Repairs & maintenance
- −$976
- − Management
- −$976
- − Depreciation
- −$2,324
- Taxable income
- $1,847
- Est. tax owed @ 24.0%
- −$443
- After-tax cash flow
- $2,566/yr
For passive investors: Depreciation is non-cash, so a rental often shows a tax loss while cash-flowing — sheltering income. Rental losses are passive: they offset passive income freely, and up to $25,000/yr can offset ordinary (W-2) income if you actively participate and your MAGI is under $100k (phasing out to $0 by $150k); unused losses carry forward. On sale, claimed depreciation is recaptured at up to 25%, and gains may owe capital-gains tax (a 1031 exchange can defer both). Figures are a year-1 estimate at your 24.0% rate — not tax advice; consult a CPA.
Schools (NCES district)
- District
- Fulton County
- NCES district ID
- 2102100
- Math proficiency
- 20% ▼ -11.00%
- Reading proficiency
- 33% ▼ -1.00%
- Median HH income
- $34,179
- Composite
- 21.74/100
- National rank
- #8263
- State rank
- #138 of 165 in KY
Livability — Hickman
- Score
- 64/100
- State rank
- #308
- US rank
- #14678
Category grades
Schools grade is shown separately in the Schools card above.
Census & demographics
- Census place
- Hickman, KY
- Population (ZIP)
- 3,129
Population outlook (Fulton County) Hauer SSP2
- Today (2025)
- 5,425 people
- By 2030
- 5,042 · -7.1%
- By 2040
- 4,456 · -17.9%
- By 2050
- 4,120 · -24.1%
- By 2075
- 4,003 · -26.2%
- By 2100
- 4,258 · -21.5%
Race, ethnicity, and origin ACS 2023
- Neighborhood character
- Predominantly White (76%)
- Race & ethnicity
- White 76% Black 23%
- Common ancestry
- Slovak 1% Iranian 1%
- Foreign-born
- 0%
- Languages at home
- 99% English-only · German/W. Germanic 1%
Political lean MEDSL · Fulton
- 2024 margin
- Solid R (+39.9) · D 29.6% · R 69.5%
- 2008→2024 swing
- -29.5pp toward R · 2008: -10.3pp · 2024: -39.9pp
- All cycles
- 2024: R+39.9 2020: R+33.5 2016: R+32.5 2012: R+16.2 2008: R+10.3
Not yet ingested
- Civics
- —
Market trends
- HPI YoY
- ▲ 3.49%
- Current HPI
- 124.8044
- Rent YoY
- —
- Metro
- —
- State GDP YoY
- ▲ 1.81%
- F500 in state
- 4
Industry mix (Fortune 500 HQ in KY)
| Industry | F500 HQs | Revenue |
|---|---|---|
| Healthcare | 1 | $118B |
|
||
| Food / Beverage | 1 | $7B |
|
||
Price history
+220.9% since first listed2 events — show timeline
- 2026-04-14 Listed $79,900 RRAR as distributed by MLS GRID
- 2005-04-08 Sold (Public Records) $24,900 Public Records
Cash-flow waterfall
monthlySold comps — $/sqft
last 12 mo · ≤1 miLoading sold comps…