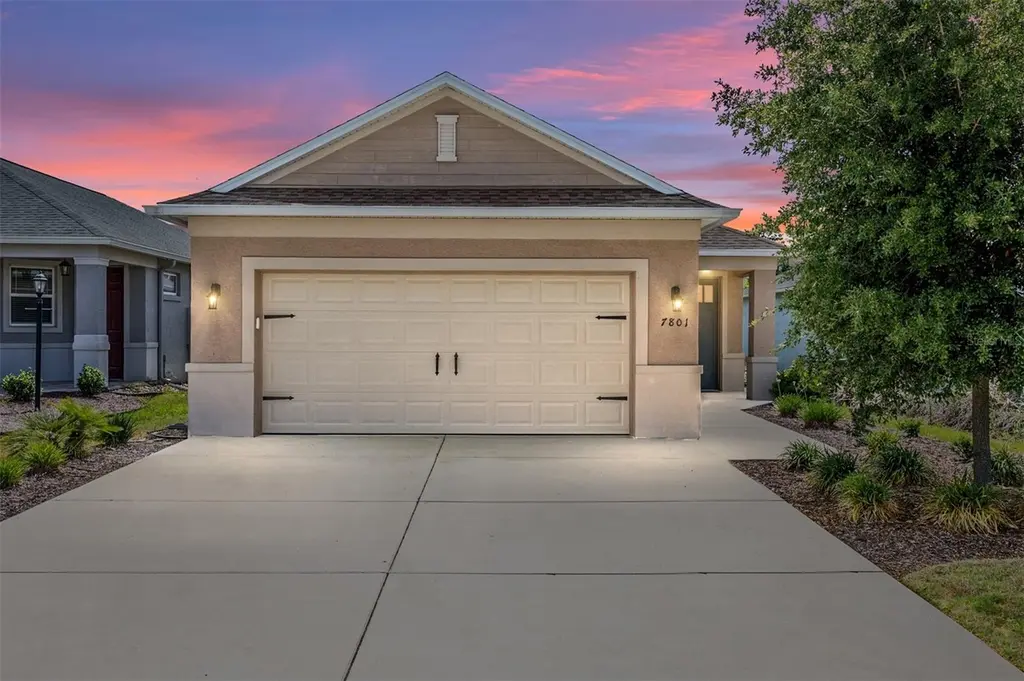
7801 SW 86th Terrace Rd · On Top of the World, FL
Flood risk 1/10 · Minimal
- FEMA flood zone
- X (unshaded)
- Chance of flooding over 30 yrs
- 0.0%
- Est. flood insurance / yr
- $507 – $1,088
Fire risk 5/10 · Moderate
- Est. fire insurance / yr
- $947 – $1,759
Heat risk 8/10 · Major
- Hot days now (above 107°F)
- 7 days/yr
- Hot days in 30 yrs
- 20 days/yr
Wind risk 9/10 · Severe
- Chance of severe wind over 30 yrs
- 99.0%
Air-quality risk 3/10 · Minor
- Unhealthy air days now
- 3 days/yr
- Unhealthy air days in 30 yrs
- 3 days/yr
Risk factors via First Street. Map © Google.
Why this score? — see what drove the D- grade
The composite is a weighted blend of 9 inputs, each scored 0–100. Each bar is that input's sub-score; the figure is the points it added to the 100-point composite (weight × sub-score).
- ARV discount +15.0/15.0
- Cash flow +8.1/30.0
- Schools +3.6/10.0
- 1% rule +2.8/10.0
- Rent growth +2.5/5.0
- Livability +2.5/5.0
- Condition / age +2.5/5.0
- DSCR +2.2/10.0
- Appreciation +0.0/10.0
$249,900
🖨 Deal sheet (PDF) 📄 Offer letter ✓ Due diligence
Listing remarks
Weybourne Landing at On Top of the World for under $250K. This well-maintained 2-bedroom, 2-bath, 2-car garage home is located on a quiet road with no front neighbors. No pet or smoking odors. The open-concept layout features rich wood cabinetry, granite countertops, travertine backsplash, and upgraded stainless steel appliances. The primary suite offers an oversized walk-in closet, dual vanities, and a frameless tile shower. Enjoy the screened porch and extended paver patio, perfect for relaxing and entertaining outdoors. The garage features durable epoxy flooring, and the golf cart is included. Residents enjoy private amenities including a pool, pickleball, fitness room, clubhouse, librar
Key facts
- Rich wood cabinetry
- Dual vanities
- Granite countertops
Tags
Property features AI
Finance
- Other: Community features include clubhouse, dog park, park, and pool
- Financial info: Lease restrictions apply
- HOA & community: HOA (monthly fee approximately $226.03); Association requires approval; Association amenities include clubhouse, fitness center, pickleball courts, recreation facilities, pool, private road, and trash service; Pets allowed: cats and dogs; Senior community
Exterior
- Parking: Attached 2-car garage
- Utilities: Private water; Private sewer; Cable connected; Electricity connected; Natural gas connected; Water connected; Irrigation equipment
- Home design: Single-family residence; One level; Faces west; PUD
- Construction: Block and stucco construction; Shingle roof; Slab foundation; Built by Colen Built (model: Oren)
- Exterior features: Patio; Screened porch; Rain gutters; Sprinkler (metered); Asphalt road access; Lot dimensions approximately 42 x 130
Interior
- Kitchen: Dishwasher; Range; Microwave; Refrigerator; Stone countertops
- Bedrooms: 2 bedrooms
- Flooring: Carpet; Tile
- Bathrooms: 2 full bathrooms
- Heating & cooling: Central heating; Central air conditioning
- Interior features: Ceiling fans; Kitchen/family room combo; Open floor plan; Split bedroom layout; Stone counters; Thermostat; Walk-in closet(s); Window treatments
- Laundry & utility: Laundry room; Washer; Dryer
Neighborhood map
What this means for you Summary
Snapshot
- This is a 2-bed/2.0-bath single-family listed at $250k.
Deal economics
- At list price, monthly cash flow is $-240 ($-3k/yr) — negative.
- To cash-flow at today's rent, offer at most $208k (16.9% below list).
- To meet the 1% rule (rent ≥ 1% of price), the offer needs to be $195k (22.0% below list).
- Recommended offer: $195k (22.0% below list) — sets the bar for 1% rule.
- Cap rate 5.1% vs local median 2.9% in On Top of the World — top-decile yield for the area; either an underpriced asset or a hidden risk that comps aren't pricing in. Stress-test before assuming the spread holds.
Location & tenants
- Location reads: area grade D — affects rentability + tenant quality, not the cash-flow math above.
- Marion (rural): math 42% / reading 43% proficiency, ranked #61 of 73 in FL (top 84%) — families likely to look elsewhere, expect single-tenant / working-renter base with shorter leases; 61% free/reduced lunch — lower-income household profile, screen leases tightly.
- Zoned schools: Saddlewood Elementary School (math 62% / reading 54%, grade C+, #751 of 2,144 statewide, top 36%, 917 students, 58% FRL); Liberty Middle School (math 40% / reading 41%, grade F, #360 of 571 statewide, top 64%, 1,365 students, 54% FRL); West Port High School (math 34% / reading 52%, grade F, #255 of 667 statewide, top 39%, 2,906 students, 52% FRL).
- Market conditions: 1173 active listings in the ZIP; 17 comparable units currently listed for rent nearby; rentals at typical pace (median 24d on market — plan ~3-4 weeks tenant-placement turnaround); 7,071 units permitted in Marion County in 2024 (534 in 5+ unit buildings).
- This rent runs 41% of the median local income ($57k/yr) — at the standard rent-burdened threshold; future hikes will face affordability resistance.
Forward outlook
- Local home prices are declining (-3.0%/yr); year-one equity from $2k of loan paydown is wiped out by about $7k of value loss. Plan a longer hold.
- Marion County population projected at +13% by 2050 — modest demand growth; plan on rents tracking national, not racing it.
Negotiation context
- It's been on market 21 days — a 2% lower offer ($246k) is reasonable based on typical stale-listing flexibility.
Risks & watch-outs
- Climate carrying-cost: severe wind risk, 99% chance of damaging wind over 30y; moderate wildfire risk; extreme-heat days projected 7→20/yr by 2055 (HVAC capex compounding) — expect insurance premiums to compound above CPI over the hold.
Questions for the listing agent
- What do current leases actually rent for vs. the listed asking? Can we see a recent rent roll and the last 12 months of T-12 income?
- What does the HOA fee cover, when was the last increase, and are there any pending special assessments or reserve-fund shortfalls?
- Is there a deadline driving the sale (1031 exchange, divorce, estate, relocation)? That informs how much negotiation room exists.
- The area grade is low — what's the realistic commute time and amenity access for the typical tenant pool here? Any planned neighborhood developments (good or bad) we should know about?
- What's the average days-on-market for RENTAL listings here right now (not sales)? A rising rental-DOM trend means longer vacancies and softer asking-rent achievability than the comps imply.
- What's the recent tenant-quality profile in this submarket — average credit score on applications, eviction rate, late-payment / NSF rate, and stable-employment percentage? A property-management company in the area should have these aggregated.
- How much new for-sale + rental construction is in the pipeline within 1–3 miles? Heavy new supply typically softens prices + rents 12–24 months out; constrained supply supports both.
Investment metrics
- 1% rule
- 0.78% ✗
- Cap rate
- 5.14%
- Cash-on-cash
- -4.11%
- DSCR
- 0.82
- GRM
- 10.7
CMA / ARV
- ARV (median comp)
- $309,675
- List price
- $249,900
- Delta
- -19.30%
- Verdict
- UNDERPRICED
- Comps
- 20 within 1.0 mi
Show comp detail 8 sales within ~0.75 mi
| Address | Dist | Beds/Ba | Sqft | Sold | Price | $/sf | Match |
|---|---|---|---|---|---|---|---|
| 7729 SW 86th Terrace Rd | 0.05mi | 2/2.0 | 1,342 (-0%) | 3mo | $243,000 | $181 | 95 |
| 8693 SW 76th Ln | 0.11mi | 2/2.0 | 1,469 (+9%) | 12mo | $314,900 | $214 | 69 |
| 8726 SW 73rd Pl | 0.32mi | 2/2.0 | 1,467 (+9%) | 11mo | $309,000 | $211 | 60 |
| 8694 SW 73rd Pl | 0.33mi | 2/2.0 | 1,467 (+9%) | 11mo | $303,000 | $207 | 60 |
| 7337 SW 89th Ter | 0.44mi | 2/2.0 | 1,467 (+9%) | 11mo | $280,000 | $191 | 55 |
| 8666 SW 72 Pl | 0.40mi | 2/2.0 | 1,467 (+9%) | 20mo | $292,680 | $200 | 49 |
| 8085 SW 81st Loop | 0.72mi | 2/2.0 | 1,332 (-1%) | 23mo | $249,900 | $188 | 46 |
| 7247 SW 91st Ct | 0.59mi | 2/2.0 | 1,423 (+6%) | 22mo | $273,400 | $192 | 44 |
Match score weights: distance 35% · size 25% · config 20% · recency 20%. Top-matched comps best support the ARV.
Projected returns pro-forma
-3.0% appreciation · 3.0% rent growth · sell at horizon
- IRR
- -23.2%
- Equity multiple
- 0.20×
- Total profit
- $-55,693
- Equity at exit
- $37,261
- IRR
- -17.7%
- Equity multiple
- 0.03×
- Total profit
- $-67,893
- Equity at exit
- $21,607
Cash invested: $69,972 (down + closing). Projections, not guarantees.
Landlord ↔ Tenant lean methodology
- Overall (STATE)
- 87 Strongly Landlord-Friendly
- State Florida
- 87 Strongly Landlord-Friendly · R+3
- County
- — inherits STATE
- City
- — inherits STATE
ZIP-level market 34481
- Home prices YoY
- -25.2%
- Active inventory
- 1173
- Price-to-rent
- 10.7×
Monthly cashflow live
- Estimated rent
- $1,950 high interval (Pro) →
- Mortgage (P&I)
- −$1,311
- Tax from tax record
- −$140 /mo · $1,677/yr
- Insurance
- −$104
- HOA
- −$226
- Lot rent
- −$0
- Vacancy / Maint / Mgmt
- −$410
- Net cashflow
- $-240
Break-even live
Sensitivity live
| Price | -10% $-98 | -5% $-169 | +0% $-240 | +5% $-310 | +10% $-381 |
|---|---|---|---|---|---|
| Rent | -10% $-394 | -5% $-317 | +0% $-240 | +5% $-163 | +10% $-86 |
| Rate | -1.0pp $-114 | -0.5pp $-176 | base $-240 | +0.5pp $-304 | +1.0pp $-370 |
UW: 25.0% down · 7.5% · 30yr · 1.5% tax · 5.0% vac · 8.0% maint · 8.0% mgmt
Financing live
Cash to close
- Down payment
- $62,475
- Closing costs
- $7,497
- Reserves months
- —
- Total cash needed
- —
Loan-product check · same deal, 3 products live
Conventional
25% down · 7.5% · 30yr
- Down + closing
- —
- Monthly P&I
- —
- Monthly cashflow
- —
- DSCR
- —
- Eligible?
- —
Personal DTI + credit; lowest rate.
DSCR
20% down · 8.5% · 30yr
- Down + closing
- —
- Monthly P&I
- —
- Monthly cashflow
- —
- DSCR
- —
- Eligible?
- —
No personal income docs; deal must DSCR.
Hard money
10% down · 12.0% · 12mo
- Down + closing
- —
- Monthly P&I
- —
- Monthly cashflow
- —
- DSCR
- —
- Eligible?
- —
Short-term bridge; refi at stabilization.
Rent comps 17 comps
| Address | Beds | Baths | Sqft | Rent | $/sqft | DOM | Units | Dist |
|---|---|---|---|---|---|---|---|---|
| 7274 SW 89th Ave Ocala, FL | 2.0 | 2.0 | 1467 | $2,200 | $1.50 | 16d | 1 | 0.42mi |
| 7978 SW 90th Ter Ocala, FL | 2.0 | 2.0 | 1226 | $1,875 | $1.53 | 16d | 1 | 0.42mi |
| 8714 SW 83rd Loop Ocala, FL | 2.0 | 2.0 | 1658 | $1,900 | $1.15 | 16d | 1 | 0.49mi |
| 9122 SW 70th Loop Ocala, FL | 2.0 | 2.0 | 1443 | $2,500 | $1.73 | 24d | 1 | 0.55mi |
| 7235 SW 91st Ct Ocala, FL | 2.0 | 2.0 | 1163 | $2,200 | $1.89 | 16d | 1 | 0.56mi |
| 7928 SW 80th Place Rd Ocala, FL | 3.0 | 2.0 | 1576 | $1,900 | $1.21 | 24d | 1 | 0.83mi |
| 8701 SW 83rd Cir Ocala, FL | 3.0 | 2.0 | 1726 | $2,200 | $1.27 | 16d | 1 | 0.94mi |
| 9106 SW 65th Loop Ocala, FL | 2.0 | 2.0 | 1556 | $2,400 | $1.54 | 16d | 1 | 0.94mi |
| 7754 SW 86th Loop Ocala, FL | 2.0 | 2.0 | 1460 | $1,800 | $1.23 | 24d | 1 | 1.24mi |
| 8431 SW 90th Ln Ocala, FL | 2.0 | 2.0 | 1366 | $1,395 | $1.02 | 24d | 1 | 1.28mi |
| 8430 SW 90th Ln Unit D Ocala, FL | 2.0 | 2.0 | 1454 | $1,600 | $1.10 | 24d | 1 | 1.30mi |
| 9013 SW 91st Cir Ocala, FL | 2.0 | 2.0 | 1494 | $1,900 | $1.27 | 16d | 1 | 1.35mi |
| 9513 SW 92nd Place Rd Ocala, FL | 2.0 | 2.0 | 1651 | $2,000 | $1.21 | 16d | 1 | 1.38mi |
| 9746 SW 89th Loop Ocala, FL | 2.0 | 2.0 | 1660 | $1,950 | $1.17 | 24d | 1 | 1.42mi |
| 9770 SW 92nd Place Rd Ocala, FL | 2.0 | 2.0 | 1399 | $2,200 | $1.57 | 24d | 1 | 1.42mi |
| 9257 SW 82nd Ter Unit H Ocala, FL | 2.0 | 2.0 | 1748 | $1,600 | $0.92 | 24d | 1 | 1.49mi |
| 8666 SW 92nd Ln Unit F Ocala, FL | 2.0 | 2.0 | 1748 | $2,000 | $1.14 | 24d | 1 | 1.49mi |
HOA detail
- Monthly dues
- $226 · $2,712/yr
- Likely covers
- pool
Listing history 1 events
-
2026-05-08$249,900 Active 772-char remark
ⓘ Source: listings_history table (triggers on properties + properties_extension) + one-shot
backfill from property_details.listing_events for pre-trigger history.
Tax reassessment forecast FL · Resets to sale price
- Current annual tax
- $1,677 · $140/mo
- Projected year-2 tax
- $2,074 · $173/mo
- Expected delta
- +$397/yr (+$33/mo · 23.7%)
ⓘ Screening estimate from a state-policy table — verify with the county assessor before closing.
Climate risk First Street
- Flood 1/10 Low FEMA zone X (unshaded) · 0% chance over 30 yrs
- Wildfire 5/10 Major
- Heat 8/10 Severe 7 d/yr ≥107°F today · 20 d/yr by 30 yrs out
- Wind 9/10 Extreme 99% chance of damaging wind over 30 yrs
- Air quality 3/10 Moderate 3 unhealthy d/yr today · 3 by 30 yrs out
Nearby sold comps map
Loading sold comps map…
Walkable amenities ~0.75 mi
Loading nearby amenities…
Taxation est. · year 1
- Rental income
- $23,404
- − Mortgage interest
- −$13,998
- − Property taxes
- −$1,677
- − Insurance
- −$1,250
- − Repairs & maintenance
- −$1,872
- − Management
- −$1,872
- − HOA
- −$2,712
- − Depreciation
- −$7,270
- Taxable loss
- −$7,247
- Est. tax savings @ 24.0%
- +$1,739
- After-tax cash flow
- $-1,136/yr
For passive investors: Depreciation is non-cash, so a rental often shows a tax loss while cash-flowing — sheltering income. Rental losses are passive: they offset passive income freely, and up to $25,000/yr can offset ordinary (W-2) income if you actively participate and your MAGI is under $100k (phasing out to $0 by $150k); unused losses carry forward. On sale, claimed depreciation is recaptured at up to 25%, and gains may owe capital-gains tax (a 1031 exchange can defer both). Figures are a year-1 estimate at your 24.0% rate — not tax advice; consult a CPA.
Schools (NCES district)
- District
- Marion
- NCES district ID
- 1201260
- Math proficiency
- 42% ▼ -7.00%
- Reading proficiency
- 43% ▼ -4.00%
- Median HH income
- $40,015
- Composite
- 35.61/100
- National rank
- #4890
- State rank
- #61 of 73 in FL
Livability — On Top of the World
No livability data for this city. (Only ~50 U.S. cities are tracked.)
Census & demographics
- Census place
- On Top of the World, FL
- County
- Marion County · 315,796 people
- City population
- 25,668
- Metro
- Ocala, FL
- Population (ZIP)
- 26,782
- Household income
- $57,324
- Rent vs Own
- Severe rent burden
- 313.0
Population outlook (Marion County) Hauer SSP2
- Today (2025)
- 365,905 people
- By 2030
- 376,768 · +3.0%
- By 2040
- 396,555 · +8.4%
- By 2050
- 412,723 · +12.8%
- By 2075
- 446,090 · +21.9%
- By 2100
- 436,193 · +19.2%
Race, ethnicity, and origin ACS 2023
- Neighborhood character
- Predominantly White (80%)
- Race & ethnicity
- White 80% Hispanic / Latino 11% Black 7% Two or more races 5%
- Hispanic origin (detail)
- Mexican 4% Puerto Rican 4% Cuban 1%
- Common ancestry
- Romanian 7% Lithuanian 3% Slovak 2%
- Foreign-born
- 8% · Canada, Jamaica
- Languages at home
- 88% English-only · Spanish 9% French/Haitian/Cajun 1% German/W. Germanic 1%
Political lean MEDSL · Marion
- 2024 margin
- Solid R (+31.6) · D 33.8% · R 65.5%
- 2008→2024 swing
- -20.0pp toward R · 2008: -11.6pp · 2024: -31.6pp
- All cycles
- 2024: R+31.6 2020: R+25.9 2016: R+26.2 2012: R+16.2 2008: R+11.6
Not yet ingested
- Civics
- —
Market trends
- HPI YoY
- ▼ -67.48%
- Current HPI
- 199.986
- Rent YoY
- —
- Metro
- Ocala, FL
- State GDP YoY
- ▲ 3.28%
- F500 in state
- 36
Industry mix (Fortune 500 HQ in FL)
| Industry | F500 HQs | Revenue |
|---|---|---|
| Industrial Technology | 2 | $29B |
|
||
| Insurance | 2 | $17B |
|
||
| Retail | 1 | $60B |
|
||
| Technology Distribution | 1 | $58B |
|
||
| Homebuilding | 1 | $35B |
|
||
| Technology Manufacturing | 1 | $35B |
|
||
Price history
2 events — show timeline
- 2026-05-29 Pending — Stellar MLS as Distributed by MLS Grid
- 2026-05-08 Listed $249,900 Stellar MLS as Distributed by MLS Grid
Property tax history
+46.9%/yrLatest (2025): $1,677 · +16.7% YoY. Source: county tax records.
Cash-flow waterfall
monthlySold comps — $/sqft
last 12 mo · ≤1 miLoading sold comps…