 🏗️ New Construction
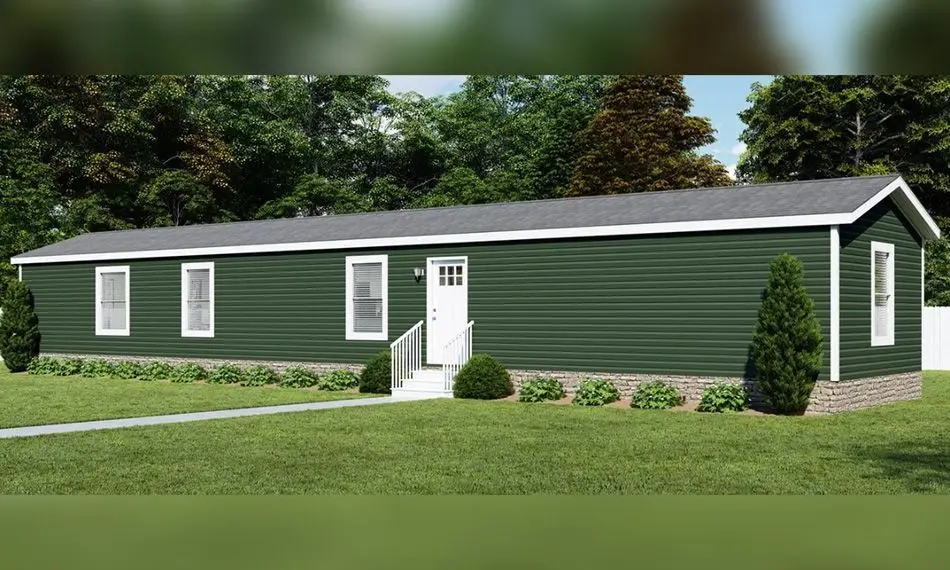
Highland Plan · Stevensville, MI
Flood risk 5/10 · Moderate
- FEMA flood zone
- X (unshaded)
- Chance of flooding over 30 yrs
- 0.24%
- Est. flood insurance / yr
- $507 – $1,088
Fire risk 1/10 · Minimal
- Est. fire insurance / yr
- $784 – $1,456
Heat risk 2/10 · Minimal
- Hot days now (above 99°F)
- 7 days/yr
- Hot days in 30 yrs
- 14 days/yr
Wind risk 2/10 · Minimal
- Chance of severe wind over 30 yrs
- —
Air-quality risk 4/10 · Minor
- Unhealthy air days now
- 4 days/yr
- Unhealthy air days in 30 yrs
- 6 days/yr
Risk factors via First Street. Map © Google.
Why this score? — see what drove the B grade
The composite is a weighted blend of 9 inputs, each scored 0–100. Each bar is that input's sub-score; the figure is the points it added to the 100-point composite (weight × sub-score).
- Cash flow +30.0/30.0
- 1% rule +10.0/10.0
- DSCR +10.0/10.0
- ARV discount +7.5/15.0
- Schools +5.3/10.0
- Livability +3.6/5.0
- Rent growth +2.5/5.0
- Condition / age +2.2/5.0
- Appreciation +0.0/10.0
$85,900
🖨 Deal sheet 📄 Offer letter ✓ Due diligence
Key facts
- Listed 14 days
Property features AI
Finance
- Financial info: List price $85,900
Exterior
- Home design: Plan (new construction inventory type); Addressed on W John Beers Rd, Stevensville, MI
- Exterior features: Living area of 1216
Interior
- Bedrooms: 3 bedrooms
- Bathrooms: 2 full bathrooms
- Interior features: Plan named Highland; Active listing
Neighborhood map
What this means for you Summary
Snapshot
- This is a 3-bed/2.0-bath manufactured listed at $86k. Condition is rated fair.
Deal economics
- At list price, monthly cash flow is $874 ($10k/yr) — positive.
- The deal already cash-flows at list — no discount required.
- Meets the 1% rule at list price ($2k rent vs $86k).
- Recommended offer: $85k (1.5% below list) — sets the bar for market timing.
- Cap rate 25.5% vs local median 2.2% in Stevensville — top-decile yield for the area; either an underpriced asset or a hidden risk that comps aren't pricing in. Stress-test before assuming the spread holds.
Location & tenants
- Location reads 72/100 on livability (#236 in MI) — a middle-class / working-renter tenant base. Strengths: crime A+, cost of living A+, housing A+; Watch: amenities F, commute F, health & safety F.
- Lakeshore School District (Berrien) (suburban): math 56% / reading 65% proficiency, ranked #37 of 540 in MI (top 7%) — acceptable for families but not a draw, mixed tenant base, ~2y average lease.
- Market conditions: 103 active listings in the ZIP; solid renter incomes; 397 units permitted in Berrien County in 2024 (40 in 5+ unit buildings).
Forward outlook
- Local home prices are declining (-3.0%/yr); year-one equity from $378 of loan paydown is wiped out by about $2k of value loss. Plan a longer hold.
- Berrien County population projected at -16% by 2050 — secular population decline; favor cash flow + early exit over multi-decade hold.
- At projected returns (-3.0% appreciation + 3.0% rent growth), your $15k cash investment doubles in ~2 years — after that, you're playing with house money.
Negotiation context
- It's been on market 15 days — a 2% lower offer ($85k) is reasonable based on typical stale-listing flexibility.
Risks & watch-outs
- Climate carrying-cost: moderate flood risk — expect insurance premiums to compound above CPI over the hold.
Questions for the listing agent
- Have any recent inspections been done? Can we get a copy of the seller's disclosures and any deferred-maintenance estimates?
- Is there a deadline driving the sale (1031 exchange, divorce, estate, relocation)? That informs how much negotiation room exists.
- Schools are B-rated — typically a magnet for longer-tenancy family renters. What's the average tenant stay here, and is there a school-zone premium baked into asking?
- What's the average days-on-market for RENTAL listings here right now (not sales)? A rising rental-DOM trend means longer vacancies and softer asking-rent achievability than the comps imply.
- What's the recent tenant-quality profile in this submarket — average credit score on applications, eviction rate, late-payment / NSF rate, and stable-employment percentage? A property-management company in the area should have these aggregated.
- How much new for-sale + rental construction is in the pipeline within 1–3 miles? Heavy new supply typically softens prices + rents 12–24 months out; constrained supply supports both.
Investment metrics
- 1% rule
- 2.90% ✓
- Cap rate
- 25.46%
- Cash-on-cash
- 68.46%
- DSCR
- 4.05
- GRM
- 2.9
CMA / ARV
- ARV (on-the-fly)
- $54,720
- Comps found
- 1
Show comp detail 1 sale within ~0.75 mi
| Address | Dist | Beds/Ba | Sqft | Sold | Price | $/sf | Match |
|---|---|---|---|---|---|---|---|
| 604 W John Beers Rd Unit 7K | 0.13mi | 3/2.0 | 1,100 (-10%) | 10mo | $50,000 | $45 | 70 |
Match score weights: distance 35% · size 25% · config 20% · recency 20%. Top-matched comps best support the ARV.
Projected returns pro-forma
-3.0% appreciation · 3.0% rent growth · sell at horizon
- IRR
- 67.9%
- Equity multiple
- 4.06×
- Total profit
- $46,829
- Equity at exit
- $8,159
- IRR
- 72.0%
- Equity multiple
- 8.35×
- Total profit
- $112,562
- Equity at exit
- $4,731
Cash invested: $15,322 (down + closing). Projections, not guarantees.
Landlord ↔ Tenant lean methodology
- Overall (STATE)
- 62 Landlord-Friendly
- State Michigan
- 62 Landlord-Friendly · EVEN
- County
- — inherits STATE
- City
- — inherits STATE
ZIP-level market 49127
- Active inventory
- 103
- Price-to-rent
- 4.5×
Monthly cashflow live
- Estimated rent
- $1,585 medium interval (Pro) →
- Mortgage (P&I)
- −$287
- Tax est. 1.5%
- −$68 /mo · $821/yr
- Insurance
- −$23
- HOA
- −$0
- Vacancy / Maint / Mgmt
- −$333
- Net cashflow
- $874
Break-even live
UW: 25.0% down · 7.5% · 30yr · 1.5% tax · 5.0% vac · 8.0% maint · 8.0% mgmt
Financing live
Cash to close
- Down payment
- $13,680
- Closing costs
- $1,642
- Reserves months
- —
- Total cash needed
- —
Loan-product check · same deal, 3 products live
Conventional
25% down · 7.5% · 30yr
- Down + closing
- —
- Monthly P&I
- —
- Monthly cashflow
- —
- DSCR
- —
- Eligible?
- —
Personal DTI + credit; lowest rate.
DSCR
20% down · 8.5% · 30yr
- Down + closing
- —
- Monthly P&I
- —
- Monthly cashflow
- —
- DSCR
- —
- Eligible?
- —
No personal income docs; deal must DSCR.
Hard money
10% down · 12.0% · 12mo
- Down + closing
- —
- Monthly P&I
- —
- Monthly cashflow
- —
- DSCR
- —
- Eligible?
- —
Short-term bridge; refi at stabilization.
Listing history 11 events
-
2026-06-19days on market $85,900 Active 15 DOM
-
2026-06-18days on market $85,900 Active 14 DOM
-
2026-06-17days on market $85,900 Active 13 DOM
-
2026-06-16days on market $85,900 Active 12 DOM
-
2026-06-15days on market $85,900 Active 11 DOM
-
2026-06-14days on market $85,900 Active 9 DOM
-
2026-06-13days on market $85,900 Active 8 DOM
-
2026-06-10days on market $85,900 Active 6 DOM
-
2026-06-09days on market $85,900 Active 5 DOM
-
2026-06-08days on market $85,900 Active 4 DOM
-
2026-06-07$85,900 Active 3 DOM
ⓘ Source: listings_history table (triggers on properties + properties_extension) + one-shot
backfill from property_details.listing_events for pre-trigger history.
Climate risk First Street
- Flood 5/10 Major FEMA zone X (unshaded) · 24% chance over 30 yrs
- Wildfire 1/10 Low
- Heat 2/10 Low 7 d/yr ≥99°F today · 14 d/yr by 30 yrs out
- Wind 2/10 Low
- Air quality 4/10 Moderate 4 unhealthy d/yr today · 6 by 30 yrs out
Nearby sold comps map
Loading sold comps map…
Walkable amenities ~0.75 mi
Loading nearby amenities…
Taxation est. · year 1
- Rental income
- $19,022
- − Mortgage interest
- −$3,065
- − Property taxes
- −$821
- − Insurance
- −$274
- − Repairs & maintenance
- −$1,522
- − Management
- −$1,522
- − Depreciation
- −$1,592
- Taxable income
- $10,227
- Est. tax owed @ 24.0%
- −$2,454
- After-tax cash flow
- $8,035/yr
For passive investors: Depreciation is non-cash, so a rental often shows a tax loss while cash-flowing — sheltering income. Rental losses are passive: they offset passive income freely, and up to $25,000/yr can offset ordinary (W-2) income if you actively participate and your MAGI is under $100k (phasing out to $0 by $150k); unused losses carry forward. On sale, claimed depreciation is recaptured at up to 25%, and gains may owe capital-gains tax (a 1031 exchange can defer both). Figures are a year-1 estimate at your 24.0% rate — not tax advice; consult a CPA.
Condition & rehab AI · 3 photos
The home is in fair condition with good exterior and interior walls. It needs a fresh coat of paint and some landscaping to enhance its curb appeal and value.
Value-add opportunities
- Both Paint exterior — Fresh paint can enhance curb appeal and value.
- Both Landscaping — Well-maintained landscaping can improve curb appeal and attract potential buyers/tenants.
Renovation cost estimate screening
Value-add ROI direction
- Both Paint exterior — Fresh paint can enhance curb appeal and value. ↑
- Both Landscaping — Well-maintained landscaping can improve curb appeal and attract potential buyers/tenants. ↑
ⓘ Cost ranges are severity-bucket heuristics (US national rule-of-thumb). Get contractor quotes + a written scope before underwriting a rehab budget.
Schools (NCES district)
- District
- Lakeshore School District (Berrien)
- NCES district ID
- 2620820
- Math proficiency
- 56% ▼ -4.00%
- Reading proficiency
- 65% ▲ 2.00%
- Median HH income
- $63,449
- Composite
- 52.75/100
- National rank
- #1546
- State rank
- #37 of 540 in MI
Livability — Stevensville
- Score
- 72/100
- State rank
- #236
- US rank
- #5954
Category grades
Schools grade is shown separately in the Schools card above.
Census & demographics
- County
- Berrien County · 71,477 people
- City population
- 11,155
- Metro
- Niles, MI
- Population (ZIP)
- 11,155
- Household income
- $93,338
- Rent vs Own
- Severe rent burden
- 100.0
Population outlook (Berrien County) Hauer SSP2
- Today (2025)
- 149,273 people
- By 2030
- 145,211 · -2.7%
- By 2040
- 135,435 · -9.3%
- By 2050
- 125,543 · -15.9%
- By 2075
- 103,986 · -30.3%
- By 2100
- 82,256 · -44.9%
Race, ethnicity, and origin ACS 2023
- Neighborhood character
- Predominantly White (83%)
- Race & ethnicity
- White 83% Two or more races 6% Hispanic / Latino 5% Black 4% Asian 3%
- Common ancestry
- Romanian 7% Iranian 4% Slovak 2%
- Foreign-born
- 8% · Canada
- Languages at home
- 93% English-only · Spanish 2% Other Indo-European 2% German/W. Germanic 1%
Political lean MEDSL · Berrien
- 2024 margin
- Lean R (+7.9) · D 45.4% · R 53.2% · Other 1.4%
- 2008→2024 swing
- -13.3pp toward R · 2008: 5.5pp · 2024: -7.9pp
- All cycles
- 2024: R+7.9 2020: R+7.4 2016: R+12.7 2012: R+6.6 2008: D+5.5
Not yet ingested
- Civics
- —
Market trends
- HPI YoY
- ▼ -297.38%
- Current HPI
- 209.9306
- Rent YoY
- —
- Metro
- Niles, MI
- State GDP YoY
- ▲ 1.37%
- F500 in state
- 28
Industry mix (Fortune 500 HQ in MI)
| Industry | F500 HQs | Revenue |
|---|---|---|
| Automotive Parts | 3 | $48B |
|
||
| Automotive | 2 | $372B |
|
||
| Chemicals | 1 | $45B |
|
||
| Automotive Retail | 1 | $29B |
|
||
| Healthcare / Medical Devices | 1 | $23B |
|
||
| Automotive Technology | 1 | $20B |
|
||
Cash-flow waterfall
monthlySold comps — $/sqft
last 12 mo · ≤1 miLoading sold comps…