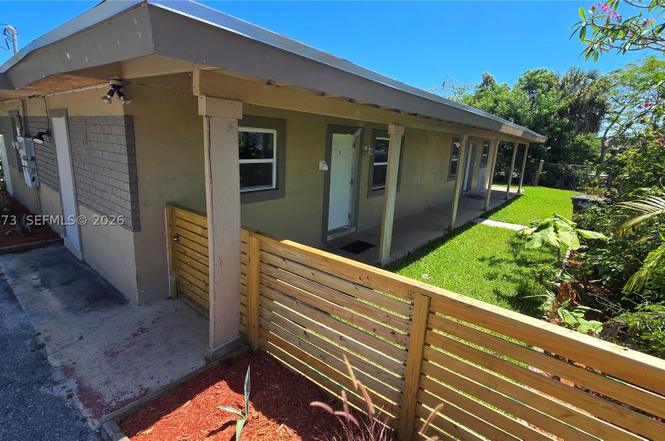
 Duplex
4000 Greenwood Ave · West Palm Beach, FL
Flood risk 1/10 · Minimal
- FEMA flood zone
- X (unshaded)
- Chance of flooding over 30 yrs
- 0.0%
- Est. flood insurance / yr
- $507 – $1,088
Fire risk 1/10 · Minimal
- Est. fire insurance / yr
- $947 – $1,759
Heat risk 10/10 · Severe
- Hot days now (above 105°F)
- 7 days/yr
- Hot days in 30 yrs
- 25 days/yr
Wind risk 10/10 · Severe
- Chance of severe wind over 30 yrs
- 99.0%
Air-quality risk 2/10 · Minimal
- Unhealthy air days now
- 1 days/yr
- Unhealthy air days in 30 yrs
- 1 days/yr
Risk factors via First Street. Map © Google.
Why this score? — see what drove the B grade
The composite is a weighted blend of 9 inputs, each scored 0–100. Each bar is that input's sub-score; the figure is the points it added to the 100-point composite (weight × sub-score).
- Cash flow +30.0/30.0
- DSCR +10.0/10.0
- 1% rule +9.4/10.0
- ARV discount +7.5/15.0
- Schools +4.3/10.0
- Livability +4.1/5.0
- Rent growth +3.3/5.0
- Condition / age +2.5/5.0
- Appreciation +0.0/10.0
$499,000
🖨 Deal sheet 📄 Offer letter ✓ Due diligence
Multi-family units
County records classify this as Multi-Family (2-4 Unit). Listing-text estimate: 2 units. confirmed
Listing remarks
Investor Special! Priced for quick sell. This meticulously renovated duplex offers a income producing opportunity. Both units have been renovated. Unit Specifications (Two Identical Units) Layout: 2 Bedrooms / 1 Bathroom per side. Rental Income: $3850 a month Lease Ends: February 2027 and April 2027 Kitchen: Solid wood cabinetry, granite countertops, quartz countertops and modern appliances. Both units rented on annual lease. Climate: Individual central AC systems for each unit. Convenience: In-unit washer and dryer included in both residences. Infrastructure & "Peace of Mind" Upgrades Unlike most vintage properties in WPB, this building has been modernized for maximu
Key facts
- Solid wood cabinetry
- Quartz countertops
- Modern appliances
Tags
Property features AI
Finance
- Financial info: Two separate rental units (each unit leased); Unit rents reported: $1,950 and $1,900
Exterior
- Parking: Two parking spaces; Parking spaces assigned to units
- Utilities: Cable available; Public sewer
- Home design: Single-story building
- Construction: Block construction; Built-Up roof
- Exterior features: Less than quarter acre lot
Interior
- Kitchen: Dishwasher; Electric range; Microwave; Refrigerator
- Bedrooms: Two bedrooms (each unit: 2 bedrooms)
- Flooring: Laminate; Tile; Vinyl
- Bathrooms: One full bathroom (each unit: 1 full bathroom)
- Heating & cooling: Central heating; Central air conditioning
- Interior features: Impact glass windows
- Laundry & utility: Washer and dryer; Electric meter
Neighborhood map
What this means for you Summary
Snapshot
- This is a 2 × 2.0-bed/1.0-bath units multifamily listed at $499k.
Deal economics
- At list price, monthly cash flow is $3k ($30k/yr) — positive. Per door: $1k/mo.
- The deal already cash-flows at list — no discount required.
- Meets the 1% rule at list price ($7k rent vs $499k).
- Recommended offer: $454k (9.0% below list) — sets the bar for market timing.
- Cap rate 12.4% vs local median 3.8% in West Palm Beach — top-decile yield for the area; either an underpriced asset or a hidden risk that comps aren't pricing in. Stress-test before assuming the spread holds.
Location & tenants
- Location reads 82/100 on livability (#75 in FL, #1,255 nationally) — a professional / high-income tenant draw. Strengths: commute A+, housing A+, health & safety A+; Watch: employment C-, crime F.
- Palm Beach (suburban): math 46% / reading 53% proficiency, ranked #34 of 73 in FL (top 47%) — families likely to look elsewhere, expect single-tenant / working-renter base with shorter leases.
- Market conditions: Rents rising (+3.1%/yr); 305 active listings in the ZIP; 32 comparable units currently listed for rent nearby; rentals at typical pace (median 25d on market — plan ~3-4 weeks tenant-placement turnaround); 3,974 units permitted in Palm Beach County in 2024 (1,012 in 5+ unit buildings).
- At $7,181/mo this rent would consume 144% of the median local household income ($60k/yr) (locally 2157% of renters already pay >50% of income on rent) — very limited rent-growth headroom before tenants either downsize or default.
Forward outlook
- Local home prices are declining (-3.0%/yr); year-one equity from $3k of loan paydown is wiped out by about $15k of value loss. Plan a longer hold.
- Palm Beach County population projected at +30% by 2050 — long-run rental-demand tailwind backs the buy-and-hold thesis.
- At projected returns (-3.0% appreciation + 3.1% rent growth), your $140k cash investment doubles in ~6 years — after that, you're playing with house money.
Negotiation context
- It's been on market 97 days — a 9% lower offer ($454k) is reasonable based on typical stale-listing flexibility.
- 12 sale attempts since 25y ago; this cycle's ask has dropped $80k (14%) from the opening price — seller is motivated, your offer sets the floor, not the list.
- Current owner paid $213k; list at $499k implies a 134% gain — meaningful room to come down on a strong offer.
Risks & watch-outs
- Watch-outs: built in 1958 — expect roof / HVAC / electrical / plumbing capex.
- Climate carrying-cost: severe wind risk, 99% chance of damaging wind over 30y; extreme-heat days projected 7→25/yr by 2055 (HVAC capex compounding) — expect insurance premiums to compound above CPI over the hold.
Questions for the listing agent
- It's been on market 97 days. Have you received any prior offers? Is the seller open to a 9% concession, seller financing, or rate buy-down credit?
- Can we see the unit-by-unit rent roll, current vacancy, and any below-market leases? What's the average tenancy length?
- What capital expenditures (roof, boiler, parking lot, exteriors) have been made in the last 5 years, and what's planned in the next 2?
- Built in 1958 — when were the roof, HVAC, electrical panel, plumbing, and water heater last replaced?
- Why hasn't it sold? Are there any deal-killer items the seller is aware of (foundation, flood, title, zoning, code violations)?
- Is there a deadline driving the sale (1031 exchange, divorce, estate, relocation)? That informs how much negotiation room exists.
- Crime grade is F in this area — have there been break-ins, vandalism, or insurance claims at this property in the last 3 years? What carrier currently insures it and at what premium?
- What's the average days-on-market for RENTAL listings here right now (not sales)? A rising rental-DOM trend means longer vacancies and softer asking-rent achievability than the comps imply.
- What's the recent tenant-quality profile in this submarket — average credit score on applications, eviction rate, late-payment / NSF rate, and stable-employment percentage? A property-management company in the area should have these aggregated.
- How much new apartment / multifamily construction is in the pipeline within 1–3 miles? Heavy new supply (>2% of stock underway) typically softens rents 12–24 months out; light construction supports rent growth.
Investment metrics
- 1% rule
- 1.44% ✓
- Cap rate
- 12.37%
- Cash-on-cash
- 21.70%
- DSCR
- 1.97
- GRM
- 5.8
CMA / ARV
No comps found within radius.
Projected returns pro-forma
-3.0% appreciation · 3.08% rent growth · sell at horizon
- IRR
- 14.4%
- Equity multiple
- 1.58×
- Total profit
- $80,532
- Equity at exit
- $74,403
- IRR
- 23.2%
- Equity multiple
- 3.00×
- Total profit
- $279,362
- Equity at exit
- $43,144
Cash invested: $139,720 (down + closing). Projections, not guarantees.
Landlord ↔ Tenant lean methodology
- Overall (STATE)
- 87 Strongly Landlord-Friendly
- State Florida
- 87 Strongly Landlord-Friendly · R+3
- County
- — inherits STATE
- City
- — inherits STATE
ZIP-level market 33407
- Rents YoY
- 3.1%
- Active inventory
- 305
- Price-to-rent
- 11.6×
Monthly cashflow live
- Estimated rent
- $7,181 high interval (Pro) →
- Mortgage (P&I)
- −$2,617
- Tax from tax record
- −$322 /mo · $3,866/yr
- Insurance
- −$208
- HOA
- −$0
- Vacancy / Maint / Mgmt
- −$1,508
- Net cashflow
- $2,526
Break-even live
2-unit breakdown (identical units grouped — click to expand)
| Units | Beds | Baths | Est. rent |
|---|---|---|---|
| 2× units | 2.0 | 1 | $7,182 |
| #1 | 2.0 | 1 | $3,591 |
| #2 | 2.0 | 1 | $3,591 |
| Total (2 units) | $7,181 | ||
UW: 25.0% down · 7.5% · 30yr · 1.5% tax · 5.0% vac · 8.0% maint · 8.0% mgmt
Financing live
Cash to close
- Down payment
- $124,750
- Closing costs
- $14,970
- Reserves months
- —
- Total cash needed
- —
Loan-product check · same deal, 3 products live
Conventional
25% down · 7.5% · 30yr
- Down + closing
- —
- Monthly P&I
- —
- Monthly cashflow
- —
- DSCR
- —
- Eligible?
- —
Personal DTI + credit; lowest rate.
DSCR
20% down · 8.5% · 30yr
- Down + closing
- —
- Monthly P&I
- —
- Monthly cashflow
- —
- DSCR
- —
- Eligible?
- —
No personal income docs; deal must DSCR.
Hard money
10% down · 12.0% · 12mo
- Down + closing
- —
- Monthly P&I
- —
- Monthly cashflow
- —
- DSCR
- —
- Eligible?
- —
Short-term bridge; refi at stabilization.
Rent comps 32 comps
| Address | Beds | Baths | Sqft | Rent | $/sqft | DOM | Units | Dist |
|---|---|---|---|---|---|---|---|---|
| 701 37th St West Palm Beach, FL | 3.0 | 2.0 | 1426 | $3,600 | $2.52 | 24d | 1 | 0.12mi |
| 3808 Westview Ave West Palm Beach, FL | 4.0 | 3.0 | 1617 | $3,100 | $1.92 | 24d | 1 | 0.17mi |
| 619 37th St West Palm Beach, FL | 3.0 | 2.0 | 1414 | $3,350 | $2.37 | 24d | 1 | 0.17mi |
| 636 35th St West Palm Beach, FL | 3.0 | 2.0 | 1133 | $3,500 | $3.09 | 24d | 1 | 0.25mi |
| 436 38th St West Palm Beach, FL | 4.0 | 3.0 | 1479 | $6,500 | $4.39 | 24d | 1 | 0.38mi |
| 933 30th Ct West Palm Beach, FL | 3.0 | 1.5 | 1085 | $3,100 | $2.86 | 24d | 1 | 0.46mi |
| 401 42nd St West Palm Beach, FL | 3.0 | 1.0 | 1100 | $4,950 | $4.50 | 24d | 1 | 0.46mi |
| 401 42nd St West Palm Beach, FL | 3.0 | 1.0 | 1400 | $4,950 | $3.54 | 15d | 1 | 0.46mi |
| 406 35th St West Palm Beach, FL | 3.0 | 2.0 | 1835 | $8,000 | $4.36 | 24d | 1 | 0.47mi |
| 511 32nd St West Palm Beach, FL | 4.0 | 3.5 | 2052 | $18,500 | $9.02 | 5d | 1 | 0.47mi |
| 419 30th St West Palm Beach, FL | 3.0 | 2.5 | 2104 | $7,700 | $3.66 | 24d | 1 | 0.63mi |
| 5101 Spruce Ave West Palm Beach, FL | 3.0 | 3.0 | 1151 | $3,100 | $2.69 | 24d | 1 | 0.71mi |
| 424 51st St Unit 426 West Palm Beach, FL | 3.0 | 2.0 | 1230 | $3,500 | $2.85 | 11d | 1 | 0.73mi |
| 216 32nd St West Palm Beach, FL | 3.0 | 3.0 | 1846 | $6,200 | $3.36 | 24d | 1 | 0.74mi |
| 202 32nd St West Palm Beach, FL | 3.0 | 2.0 | 1636 | $5,995 | $3.66 | 24d | 1 | 0.76mi |
| 5203 N Flagler Dr West Palm Beach, FL | 3.0 | 1.5 | 1458 | $6,000 | $4.12 | 24d | 1 | 0.79mi |
| 5301 N Flagler Dr West Palm Beach, FL | 4.0 | 3.0 | 1616 | $6,000 | $3.71 | 24d | 1 | 0.84mi |
| 411 26th St West Palm Beach, FL | 4.0 | 3.5 | 1847 | $6,900 | $3.74 | 24d | 1 | 0.84mi |
| 411 26th St West Palm Beach, FL | 3.0 | 3.5 | 1847 | $6,900 | $3.74 | 8d | 1 | 0.84mi |
| 1563 40th St West Palm Beach, FL | 4.0 | 2.0 | 1680 | $3,600 | $2.14 | 4d | 1 | 0.93mi |
| 629 56th St West Palm Beach, FL | 4.0 | 2.0 | 1689 | $3,100 | $1.84 | 15d | 1 | 0.93mi |
| 2800 N Flagler Dr #404 West Palm Beach, FL | 3.0 | 3.0 | 2063 | $7,200 | $3.49 | 24d | 1 | 0.96mi |
| 5600 N Flagler Dr West Palm Beach, FL | 1.0–3.0 | 2.0 | 1192 | $6,000 | $5.03 | 21d | 8 | 0.99mi |
| 716 21st St West Palm Beach, FL | 4.0 | 2.0 | 1560 | $3,800 | $2.44 | 18d | 1 | 1.03mi |
| 716 21st St West Palm Beach, FL | 4.0 | 2.0 | 1560 | $3,800 | $2.44 | 5d | 1 | 1.03mi |
| 735 20th St West Palm Beach, FL | 4.0 | 3.0 | 1767 | $3,600 | $2.04 | 8d | 1 | 1.05mi |
| 735 20th St West Palm Beach, FL | 4.0 | 3.0 | 1767 | $3,800 | $2.15 | 24d | 1 | 1.05mi |
| 1101 Grant St West Palm Beach, FL | 4.0 | 2.0 | 1726 | $2,995 | $1.74 | 16d | 1 | 1.16mi |
| 266 Colonial Ln Palm Beach, FL | 3.0 | 2.5 | 2012 | $45,000 | $22.37 | 24d | 1 | 1.32mi |
| 565 Lilac Ct West Palm Beach, FL | 3.0 | 2.0 | 1250 | $3,000 | $2.40 | 18d | 1 | 1.34mi |
| 1805 N Flagler Dr #107 West Palm Beach, FL | 3.0 | 2.0 | 1237 | $2,995 | $2.42 | 4d | 1 | 1.34mi |
| 926 14th St West Palm Beach, FL | 4.0 | 2.0 | 1050 | $3,000 | $2.86 | 15d | 1 | 1.50mi |
Listing history 50 events
-
2026-06-18price $499,000 Active 97 DOM
-
2026-06-18days on market $535,000 Active 97 DOM
-
2026-06-17days on market $535,000 Active 96 DOM
-
2026-06-16days on market $535,000 Active 95 DOM
-
2026-06-15days on market $535,000 Active 94 DOM
-
2026-06-13days on market $535,000 Active 92 DOM
-
2026-06-09days on market $535,000 Active 88 DOM
-
2026-06-08days on market $535,000 Active 87 DOM
-
2026-06-07days on market $535,000 Active 86 DOM
-
2026-06-04days on market $535,000 Active 83 DOM
-
2026-06-03days on market $535,000 Active 82 DOM
-
2026-06-02days on market $535,000 Active 81 DOM
-
2026-06-01days on market $535,000 Active 80 DOM
-
2026-05-31days on market $535,000 Active 79 DOM
-
2026-05-17price $535,000
-
2026-05-09status Active
-
2026-03-24price $569,900
-
2026-02-13$578,800 Active
-
2025-08-25historical
-
2025-07-31$448,000 Active
-
2021-02-09historical
-
2020-11-09price $280,000
-
2020-10-08$289,000 Active
-
2015-12-09historical
-
2015-10-20price $63,700
-
2015-10-09price $109,000
-
2015-09-21price $114,000
-
2015-09-07status Active
-
2015-09-01historical Contingent
-
2015-08-19$115,000 Active
-
2015-03-11historical
-
2015-02-19price $85,000
-
2015-02-17price $109,500
-
2015-02-08price $112,500
-
2015-01-15$115,000 Active
-
2014-11-19historical
-
2014-10-19historical Contingent
-
2014-09-10price $99,900
-
2014-08-29status Active
-
2014-04-18historical
-
2014-04-18price $119,900
-
2014-04-12price $124,000
-
2014-03-27$112,000 Active
-
2006-12-04soldstatus $213,000
-
2005-03-04soldstatus $151,000
-
2005-01-09historical
-
2004-12-27$154,900
-
2002-10-30soldstatus $104,000
-
2002-10-28soldstatus $104,000
-
2002-10-08historical
ⓘ Source: listings_history table (triggers on properties + properties_extension) + one-shot
backfill from property_details.listing_events for pre-trigger history.
Tax reassessment forecast FL · Resets to sale price
- Current annual tax
- $3,866 · $322/mo
- Projected year-2 tax
- $4,142 · $345/mo
- Expected delta
- +$276/yr (+$23/mo · 7.1%)
ⓘ Screening estimate from a state-policy table — verify with the county assessor before closing.
Climate risk First Street
- Flood 1/10 Low FEMA zone X (unshaded) · 0% chance over 30 yrs
- Wildfire 1/10 Low
- Heat 10/10 Extreme 7 d/yr ≥105°F today · 25 d/yr by 30 yrs out
- Wind 10/10 Extreme 99% chance of damaging wind over 30 yrs
- Air quality 2/10 Low 1 unhealthy d/yr today · 1 by 30 yrs out
Nearby sold comps map
Loading sold comps map…
Walkable amenities ~0.75 mi
Loading nearby amenities…
Taxation est. · year 1
- Rental income
- $86,172
- − Mortgage interest
- −$27,952
- − Property taxes
- −$3,866
- − Insurance
- −$2,495
- − Repairs & maintenance
- −$6,894
- − Management
- −$6,894
- − Depreciation
- −$14,516
- Taxable income
- $23,556
- Est. tax owed @ 24.0%
- −$5,653
- After-tax cash flow
- $24,660/yr
For passive investors: Depreciation is non-cash, so a rental often shows a tax loss while cash-flowing — sheltering income. Rental losses are passive: they offset passive income freely, and up to $25,000/yr can offset ordinary (W-2) income if you actively participate and your MAGI is under $100k (phasing out to $0 by $150k); unused losses carry forward. On sale, claimed depreciation is recaptured at up to 25%, and gains may owe capital-gains tax (a 1031 exchange can defer both). Figures are a year-1 estimate at your 24.0% rate — not tax advice; consult a CPA.
Schools (NCES district)
- District
- Palm Beach
- NCES district ID
- 1201500
- Math proficiency
- 46% ▼ -16.00%
- Reading proficiency
- 53% ▼ -4.00%
- Median HH income
- $53,943
- Composite
- 42.72/100
- National rank
- #3160
- State rank
- #34 of 73 in FL
Livability — West Palm Beach
- Score
- 82/100
- State rank
- #75
- US rank
- #1255
Category grades
Schools grade is shown separately in the Schools card above.
Census & demographics
- Census place
- West Palm Beach, FL
- County
- Palm Beach County · 1,438,312 people
- City population
- 222,012
- Metro
- Miami-Fort Lauderdale-Pompano Beach, FL
- Population (ZIP)
- 34,851
- Household income
- $59,993
- Rent vs Own
- Severe rent burden
- 2157.0
Population outlook (Palm Beach County) Hauer SSP2
- Today (2025)
- 1,637,487 people
- By 2030
- 1,743,255 · +6.5%
- By 2040
- 1,948,712 · +19.0%
- By 2050
- 2,132,979 · +30.3%
- By 2075
- 2,530,027 · +54.5%
- By 2100
- 2,706,979 · +65.3%
Race, ethnicity, and origin ACS 2023
- Neighborhood character
- Diverse neighborhood (Simpson 0.62)
- Race & ethnicity
- Black 54% White 21% Hispanic / Latino 20% Two or more races 13% Asian 2%
- Hispanic origin (detail)
- Mexican 2% Puerto Rican 2% Cuban 2%
- Common ancestry
- Hispanic 8% Lithuanian 1% Romanian 1%
- Foreign-born
- 26% · Canada, Vietnam, Jamaica
- Languages at home
- 72% English-only · Spanish 17% French/Haitian/Cajun 8% Other Indo-European 1%
Political lean MEDSL · Palm Beach
- 2024 margin
- Toss-up / Even · D 50.0% · R 49.2%
- 2008→2024 swing
- -22.1pp toward R · 2008: 22.9pp · 2024: 0.8pp
- All cycles
- 2024: D+0.8 2020: D+12.8 2016: D+15.3 2012: D+17.0 2008: D+22.9
Not yet ingested
- Civics
- —
Market trends
- HPI YoY
- ▼ -299.26%
- Current HPI
- 363.3995
- Rent YoY
- ▲ 3.08%
- Metro
- Miami-Fort Lauderdale-Pompano Beach, FL
- State GDP YoY
- ▲ 3.28%
- F500 in state
- 36
Industry mix (Fortune 500 HQ in FL)
| Industry | F500 HQs | Revenue |
|---|---|---|
| Industrial Technology | 2 | $29B |
|
||
| Insurance | 2 | $17B |
|
||
| Retail | 1 | $60B |
|
||
| Technology Distribution | 1 | $58B |
|
||
| Homebuilding | 1 | $35B |
|
||
| Technology Manufacturing | 1 | $35B |
|
||
Price history
+613.3% since first listed43 events — show timeline
- 2026-05-17 Price Changed $535,000 MARMLS
- 2026-05-09 Relisted — MARMLS
- 2026-03-24 Price Changed $569,900 MARMLS
- 2026-02-13 Listed $578,800 MARMLS
- 2025-08-25 Listing Removed — MARMLS
- 2025-07-31 Listed $448,000 MARMLS
- 2021-02-09 Listing Removed — MARMLS
- 2020-11-09 Price Changed $280,000 MARMLS
- 2020-10-08 Listed $289,000 MARMLS
- 2015-12-09 Listing Removed — Beaches MLS
- 2015-10-20 Price Changed $63,700 Beaches MLS
- 2015-10-09 Price Changed $109,000 Beaches MLS
- 2015-09-21 Price Changed $114,000 Beaches MLS
- 2015-09-07 Relisted — Beaches MLS
- 2015-09-01 Contingent — Beaches MLS
- 2015-08-19 Listed $115,000 Beaches MLS
- 2015-03-11 Listing Removed — Beaches MLS
- 2015-02-19 Price Changed $85,000 Beaches MLS
- 2015-02-17 Price Changed $109,500 Beaches MLS
- 2015-02-08 Price Changed $112,500 Beaches MLS
- 2015-01-15 Listed $115,000 Beaches MLS
- 2014-11-19 Listing Removed — Beaches MLS
- 2014-10-19 Contingent — Beaches MLS
- 2014-09-10 Price Changed $99,900 Beaches MLS
- 2014-08-29 Relisted — Beaches MLS
- 2014-04-18 Listing Removed — Beaches MLS
- 2014-04-18 Price Changed $119,900 Beaches MLS
- 2014-04-12 Price Changed $124,000 Beaches MLS
- 2014-03-27 Listed $112,000 Beaches MLS
- 2006-12-04 Sold (Public Records) $213,000 Public Records
- 2005-03-04 Sold (MLS) $151,000 Beaches MLS
- 2005-01-09 Listing Removed — Beaches MLS
- 2004-12-27 Listed $154,900 Beaches MLS
- 2002-10-30 Sold (Public Records) $104,000 Public Records
- 2002-10-28 Sold (MLS) $104,000 Beaches MLS
- 2002-10-08 Listing Removed — Beaches MLS
- 2002-08-28 Listed $104,900 Beaches MLS
- 2002-06-07 Sold (Public Records) $82,000 Public Records
- 2001-10-31 Sold (Public Records) $44,000 Public Records
- 2001-10-09 Sold (MLS) $44,000 Beaches MLS
- 2001-08-14 Listing Removed — Beaches MLS
- 2001-08-08 Listed $49,900 Beaches MLS
- 1999-09-23 Sold (Public Records) $75,000 Public Records
Property tax history
+6.8%/yrLatest (2025): $3,866 · +8.2% YoY. Source: county tax records.
Cash-flow waterfall
monthlySold comps — $/sqft
last 12 mo · ≤1 miLoading sold comps…