6809 Willowbrook Dr #1 · Fayetteville, NC
Flood risk 1/10 · Minimal
- FEMA flood zone
- X (unshaded)
- Chance of flooding over 30 yrs
- 0.0%
- Est. flood insurance / yr
- $507 – $1,088
Fire risk 3/10 · Minor
- Est. fire insurance / yr
- $906 – $1,684
Heat risk 7/10 · Major
- Hot days now (above 106°F)
- 7 days/yr
- Hot days in 30 yrs
- 16 days/yr
Wind risk 6/10 · Moderate
- Chance of severe wind over 30 yrs
- 73.0%
Air-quality risk 2/10 · Minimal
- Unhealthy air days now
- 0 days/yr
- Unhealthy air days in 30 yrs
- 1 days/yr
Risk factors via First Street. Map © Google.
Why this score? — see what drove the B- grade
The composite is a weighted blend of 9 inputs, each scored 0–100. Each bar is that input's sub-score; the figure is the points it added to the 100-point composite (weight × sub-score).
- Cash flow +26.7/30.0
- DSCR +9.2/10.0
- 1% rule +9.1/10.0
- ARV discount +7.5/15.0
- Livability +3.8/5.0
- Rent growth +3.3/5.0
- Schools +3.1/10.0
- Condition / age +2.5/5.0
- Appreciation +0.0/10.0
$83,900
🖨 Deal sheet 📄 Offer letter ✓ Due diligence
Listing remarks
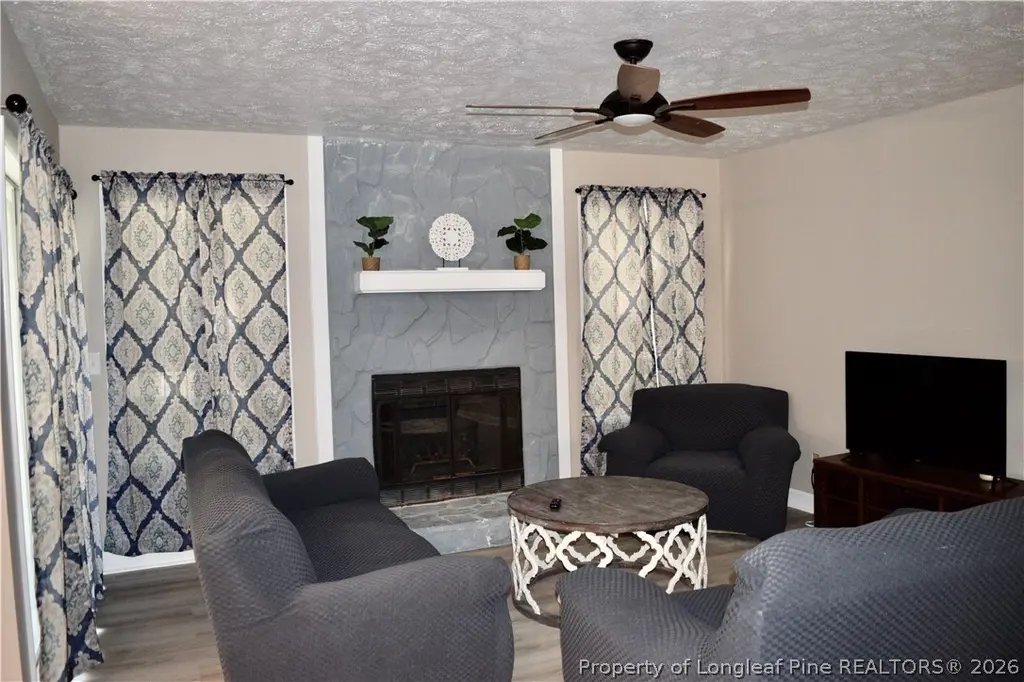
Fully furnished condo ready to move in! Kitchen was updated a couple of years ago with new cabinets, granite countertops and kitchen appliances. Fresh paint, updated bathrooms with a tile shower in master. Don't miss out on this opportunity! This is already an income producing property that is ready to go. Home will not qualify FHA/VA financing
Key facts
- Updated bathrooms
- Tile shower
- $198 HOA
Tags
Property features AI
Finance
- HOA & community: Monthly HOA fee of $198.95; Community pool
Exterior
- Parking: No garage
- Utilities: Public water; Public sewer
- Home design: Residential condominium
- Construction: Masonite exterior
- Exterior features: Balcony
Interior
- Kitchen: Dishwasher; Free-standing electric range; Microwave; Refrigerator
- Bedrooms: Total rooms: 4
- Flooring: Laminate; Tile
- Bathrooms: 2 full bathrooms
- Heating & cooling: Central air; Electric heating; Forced air heating; Ceiling fan(s)
- Interior features: Breakfast bar; Ceiling fans; Eat-in kitchen; Granite counters; Walk-in closet(s); Furnished; Gas/electric appliances included
- Laundry & utility: Washer and dryer in unit
Neighborhood map
What this means for you Summary
Snapshot
- This is a 2-bed/2.0-bath condo listed at $84k.
Deal economics
- At list price, monthly cash flow is $227 ($3k/yr) — positive.
- The deal already cash-flows at list — no discount required.
- Meets the 1% rule at list price ($1k rent vs $84k).
- Cap rate 9.5% vs local median 4.9% in Fayetteville — top-decile yield for the area; either an underpriced asset or a hidden risk that comps aren't pricing in. Stress-test before assuming the spread holds.
Location & tenants
- Location reads 75/100 on livability (#45 in NC, #4,031 nationally) — a middle-class / working-renter tenant base. Strengths: commute A+, cost of living A+, housing A+; Watch: crime F, employment D-.
- Cumberland County Schools (urban): math 32% / reading 41% proficiency, ranked #126 of 178 in NC (top 71%) — families likely to look elsewhere, expect single-tenant / working-renter base with shorter leases.
- Zoned schools: Westover Middle (math 20% / reading 30%, grade F, #396 of 475 statewide, top 84%, 784 students, 100% FRL); Westover High (math 42% / reading 39%, grade F, #387 of 535 statewide, top 73%, 1,202 students, 100% FRL) — zoned schools average 100% FRL vs 55% district-wide (45 pts higher); higher-poverty schools than district average — tighter screening recommended.
- Market conditions: Rents rising (+3.1%/yr); 429 active listings in the ZIP; 40 comparable units currently listed for rent nearby; rentals at typical pace (median 23d on market — plan ~3-4 weeks tenant-placement turnaround); 1,125 units permitted in Cumberland County in 2024 (104 in 5+ unit buildings).
Forward outlook
- Local home prices are declining (-3.0%/yr); year-one equity from $580 of loan paydown is wiped out by about $3k of value loss. Plan a longer hold.
- At projected returns (-3.0% appreciation + 3.1% rent growth), your $23k cash investment doubles in ~10 years — after that, you're playing with house money.
Negotiation context
- Only 14 days on market — expect competitive offers; lowballing is unlikely to land.
- 3 sale attempts with the ask held roughly flat each time — persistent listings suggest the price (not the market) is what's stuck; bring a comps-based counter.
- Current owner paid $60k; 40% above their basis — modest negotiation headroom, anchor on the comps not their cost.
Risks & watch-outs
- Climate carrying-cost: major wind risk, 73% chance of damaging wind over 30y; extreme-heat days projected 7→16/yr by 2055 (HVAC capex compounding) — expect insurance premiums to compound above CPI over the hold.
Questions for the listing agent
- What does the HOA fee cover, when was the last increase, and are there any pending special assessments or reserve-fund shortfalls?
- Any open or pending special assessments — roof, HVAC, plumbing, elevator, façade? What's the per-unit balance and payoff schedule, and is the seller paying it off at close or rolling it to the buyer?
- Is there a deadline driving the sale (1031 exchange, divorce, estate, relocation)? That informs how much negotiation room exists.
- Crime grade is F in this area — have there been break-ins, vandalism, or insurance claims at this property in the last 3 years? What carrier currently insures it and at what premium?
- What's the average days-on-market for RENTAL listings here right now (not sales)? A rising rental-DOM trend means longer vacancies and softer asking-rent achievability than the comps imply.
- What's the recent tenant-quality profile in this submarket — average credit score on applications, eviction rate, late-payment / NSF rate, and stable-employment percentage? A property-management company in the area should have these aggregated.
- How much new apartment / multifamily construction is in the pipeline within 1–3 miles? Heavy new supply (>2% of stock underway) typically softens rents 12–24 months out; light construction supports rent growth.
Investment metrics
- 1% rule
- 1.41% ✓
- Cap rate
- 9.54%
- Cash-on-cash
- 11.58%
- DSCR
- 1.52
- GRM
- 5.9
CMA / ARV
No comps found within radius.
Projected returns pro-forma
-3.0% appreciation · 3.11% rent growth · sell at horizon
- IRR
- 1.2%
- Equity multiple
- 1.05×
- Total profit
- $1,073
- Equity at exit
- $12,510
- IRR
- 11.0%
- Equity multiple
- 1.87×
- Total profit
- $20,453
- Equity at exit
- $7,254
Cash invested: $23,492 (down + closing). Projections, not guarantees.
Landlord ↔ Tenant lean methodology
- Overall (STATE)
- 85 Strongly Landlord-Friendly
- State North Carolina
- 85 Strongly Landlord-Friendly · R+3
- County
- — inherits STATE
- City
- — inherits STATE
ZIP-level market 28314
- Home prices YoY
- -15.7%
- Rents YoY
- 3.1%
- Active inventory
- 429
- Price-to-rent
- 5.9×
Monthly cashflow live
- Estimated rent
- $1,179 high interval (Pro) →
- Mortgage (P&I)
- −$440
- Tax from tax record
- −$32 /mo · $382/yr
- Insurance
- −$35
- HOA
- −$198
- Vacancy / Maint / Mgmt
- −$248
- Net cashflow
- $227
Break-even live
UW: 25.0% down · 7.5% · 30yr · 1.5% tax · 5.0% vac · 8.0% maint · 8.0% mgmt
Financing live
Cash to close
- Down payment
- $20,975
- Closing costs
- $2,517
- Reserves months
- —
- Total cash needed
- —
Loan-product check · same deal, 3 products live
Conventional
25% down · 7.5% · 30yr
- Down + closing
- —
- Monthly P&I
- —
- Monthly cashflow
- —
- DSCR
- —
- Eligible?
- —
Personal DTI + credit; lowest rate.
DSCR
20% down · 8.5% · 30yr
- Down + closing
- —
- Monthly P&I
- —
- Monthly cashflow
- —
- DSCR
- —
- Eligible?
- —
No personal income docs; deal must DSCR.
Hard money
10% down · 12.0% · 12mo
- Down + closing
- —
- Monthly P&I
- —
- Monthly cashflow
- —
- DSCR
- —
- Eligible?
- —
Short-term bridge; refi at stabilization.
Rent comps 40 comps
| Address | Beds | Baths | Sqft | Rent | $/sqft | DOM | Units | Dist |
|---|---|---|---|---|---|---|---|---|
| 6809 Willowbrook Dr Fayetteville, NC | 2.0 | 2.0 | 1050 | $990 | $0.94 | 23d | 1 | 0.02mi |
| 6804 Willowbrook Dr Fayetteville, NC | 1.0 | 1.0 | 800 | $890 | $1.11 | 23d | 1 | 0.07mi |
| 1018 Wood Creek Dr #9 Fayetteville, NC | 3.0 | 2.0 | 1101 | $1,195 | $1.09 | 23d | 1 | 0.10mi |
| 6792 Willowbrook Dr #16 Fayetteville, NC | 1.0 | 1.0 | 800 | $795 | $0.99 | 23d | 1 | 0.10mi |
| 6792 Willowbrook Dr Fayetteville, NC | 1.0 | 1.0 | 900 | $795 | $0.88 | 13d | 1 | 0.10mi |
| 942 Stewarts Creek Dr #9 Fayetteville, NC | 3.0 | 2.0 | 1250 | $1,250 | $1.00 | 23d | 1 | 0.13mi |
| 942 Stewarts Creek Dr #8 Fayetteville, NC | 2.0 | 2.0 | 1020 | $1,055 | $1.03 | 23d | 1 | 0.13mi |
| 1000 Wood Creek Dr #9 Fayetteville, NC | 2.0 | 2.0 | 1100 | $1,175 | $1.07 | 23d | 1 | 0.14mi |
| 1022 Brookhollow Dr #5 Fayetteville, NC | 2.0 | 2.0 | 1086 | $1,050 | $0.97 | 23d | 1 | 0.19mi |
| 1014 Brookhollow Dr Fayetteville, NC | 2.0 | 2.0 | 1050 | $1,000 | $0.95 | 13d | 1 | 0.22mi |
| 6748 Willowbrook Dr #9 Fayetteville, NC | 2.0 | 2.0 | 1157 | $1,100 | $0.95 | 23d | 1 | 0.24mi |
| 1002 Brookhollow Dr #5 Fayetteville, NC | 3.0 | 2.0 | 1311 | $1,290 | $0.98 | 21d | 1 | 0.30mi |
| 6720 Willowbrook Dr #5 Fayetteville, NC | 2.0 | 2.0 | 1200 | $1,150 | $0.96 | 13d | 1 | 0.31mi |
| 6855 Shawcross Ln Fayetteville, NC | 3.0 | 2.0 | 1100 | $1,495 | $1.36 | 23d | 1 | 0.32mi |
| 6848 Torrance Ln Fayetteville, NC | 3.0 | 2.5 | 1290 | $3,295 | $2.55 | 13d | 1 | 0.34mi |
| 1001 Brookhollow Dr #4 Fayetteville, NC | 3.0 | 2.0 | 1311 | $1,550 | $1.18 | 23d | 1 | 0.34mi |
| 6734 Winchester St Fayetteville, NC | 3.0 | 2.0 | 1068 | $3,195 | $2.99 | 13d | 1 | 0.45mi |
| 244 Wickford Ct Unit 6 Fayetteville, NC | 2.0 | 1.5 | 1141 | $995 | $0.87 | 23d | 1 | 0.46mi |
| 916 Glen Reilly Dr Fayetteville, NC | 3.0 | 2.0 | 1071 | $1,400 | $1.31 | 23d | 1 | 0.52mi |
| 205 Brookford Ct Fayetteville, NC | 3.0 | 2.0 | 1196 | $1,640 | $1.37 | 23d | 1 | 0.59mi |
| 605 S Reilly Rd Fayetteville, NC | 1.0–3.0 | 1.0–2.0 | 992 | $1,110 | $1.12 | 13d | 1 | 0.70mi |
| 621 Marshtree Ln #305 Fayetteville, NC | 2.0 | 2.0 | 1140 | $1,500 | $1.32 | 23d | 1 | 0.72mi |
| 625 Marshtree Ln Fayetteville, NC | 2.0–3.0 | 2.0 | 1170 | $1,200 | $1.03 | 13d | 2 | 0.76mi |
| 6535 Jefferey Dr Fayetteville, NC | 1.0 | 1.0 | 700 | $905 | $1.29 | 13d | 3 | 0.84mi |
| 6521 Cissna Dr Fayetteville, NC | 3.0 | 2.0 | 1456 | $1,375 | $0.94 | 13d | 1 | 0.86mi |
| 6407 Wallaby Ct Fayetteville, NC | 2.0 | 1.5 | 1100 | $1,200 | $1.09 | 13d | 1 | 0.90mi |
| 6510 Cissna Dr Fayetteville, NC | 3.0 | 1.5 | 1100 | $1,095 | $1.00 | 13d | 1 | 0.91mi |
| 6445 Independence Pl Dr Fayetteville, NC | 1.0–3.0 | 1.0–3.0 | 1106 | $1,529 | $1.38 | 13d | 18 | 0.93mi |
| 338 Milburn Dr Fayetteville, NC | 3.0 | 1.5 | 1128 | $1,550 | $1.37 | 23d | 1 | 0.94mi |
| 540 Auburndale Ln Fayetteville, NC | 3.0 | 2.0 | 1100 | $1,600 | $1.45 | 13d | 1 | 1.06mi |
| 6793 Candlewood Dr Fayetteville, NC | 3.0 | 2.0 | 1240 | $1,475 | $1.19 | 13d | 1 | 1.08mi |
| 111 Grande Oaks Dr Fayetteville, NC | 1.0–3.0 | 1.0–2.0 | 1205 | $1,412 | $1.17 | 13d | 46 | 1.09mi |
| 278 Crabapple Cir #57 Fayetteville, NC | 2.0 | 1.0 | 796 | $990 | $1.24 | 23d | 1 | 1.12mi |
| 307 Family Lodge Dr Unit 5 Fayetteville, NC | 2.0 | 2.5 | 1200 | $1,100 | $0.92 | 13d | 1 | 1.12mi |
| 7252 Ainsley St Fayetteville, NC | 3.0 | 1.0 | 1265 | $1,299 | $1.03 | 23d | 1 | 1.16mi |
| 567 Cutchen Ln Fayetteville, NC | 1.0–3.0 | 1.0–2.0 | 975 | $1,175 | $1.20 | 13d | 61 | 1.21mi |
| 7639 Fletcher Ave Fayetteville, NC | 3.0 | 2.0 | 1300 | $1,400 | $1.08 | 23d | 1 | 1.21mi |
| 202 Bertram Pl Fayetteville, NC | 3.0 | 2.0 | 1175 | $1,300 | $1.11 | 13d | 1 | 1.28mi |
| 7526 Bridgeman Dr Fayetteville, NC | 3.0 | 2.0 | 1300 | $1,450 | $1.12 | 23d | 1 | 1.30mi |
| 495 Stiles Pl Fayetteville, NC | 3.0 | 2.0 | 1300 | $1,250 | $0.96 | 13d | 1 | 1.32mi |
HOA detail condo
- Monthly dues
- $198 · $2,376/yr
- Assessments
- None detected in remarks — confirm with the listing agent.
Listing history 11 events
-
2026-06-18days on market $83,900 Active 14 DOM
-
2026-06-17days on market $83,900 Active 13 DOM
-
2026-06-16days on market $83,900 Active 12 DOM
-
2026-06-15days on market $83,900 Active 11 DOM
-
2026-06-14days on market $83,900 Active 9 DOM
-
2026-06-13days on market $83,900 Active 8 DOM
-
2026-06-10days on market $83,900 Active 6 DOM
-
2026-06-09days on market $83,900 Active 5 DOM
-
2026-06-08days on market $83,900 Active 4 DOM
-
2026-06-07remarks 346-char remark
-
2026-06-07$83,900 Active 3 DOM
ⓘ Source: listings_history table (triggers on properties + properties_extension) + one-shot
backfill from property_details.listing_events for pre-trigger history.
Tax reassessment forecast NC · Resets to sale price
- Current annual tax
- $382 · $32/mo
- Projected year-2 tax
- $688 · $57/mo
- Expected delta
- +$306/yr (+$25/mo · 79.9%)
ⓘ Screening estimate from a state-policy table — verify with the county assessor before closing.
Climate risk First Street
- Flood 1/10 Low FEMA zone X (unshaded) · 0% chance over 30 yrs
- Wildfire 3/10 Moderate
- Heat 7/10 Severe 7 d/yr ≥106°F today · 16 d/yr by 30 yrs out
- Wind 6/10 Major 73% chance of damaging wind over 30 yrs
- Air quality 2/10 Low 0 unhealthy d/yr today · 1 by 30 yrs out
Nearby sold comps map
Loading sold comps map…
Walkable amenities ~0.75 mi
Loading nearby amenities…
Taxation est. · year 1
- Rental income
- $14,150
- − Mortgage interest
- −$4,700
- − Property taxes
- −$382
- − Insurance
- −$420
- − Repairs & maintenance
- −$1,132
- − Management
- −$1,132
- − HOA
- −$2,376
- − Depreciation
- −$2,441
- Taxable income
- $1,568
- Est. tax owed @ 24.0%
- −$376
- After-tax cash flow
- $2,345/yr
For passive investors: Depreciation is non-cash, so a rental often shows a tax loss while cash-flowing — sheltering income. Rental losses are passive: they offset passive income freely, and up to $25,000/yr can offset ordinary (W-2) income if you actively participate and your MAGI is under $100k (phasing out to $0 by $150k); unused losses carry forward. On sale, claimed depreciation is recaptured at up to 25%, and gains may owe capital-gains tax (a 1031 exchange can defer both). Figures are a year-1 estimate at your 24.0% rate — not tax advice; consult a CPA.
Schools (NCES district)
- District
- Cumberland County Schools
- NCES district ID
- 3700011
- Math proficiency
- 32% ▼ -2.00%
- Reading proficiency
- 41% ▼ -1.00%
- Median HH income
- $44,168
- Composite
- 31.0/100
- National rank
- #6096
- State rank
- #126 of 178 in NC
Livability — Fayetteville
- Score
- 75/100
- State rank
- #45
- US rank
- #4031
Category grades
Schools grade is shown separately in the Schools card above.
Census & demographics
- Census place
- Fayetteville, NC
- County
- Cumberland County · 265,314 people
- City population
- 226,118
- Metro
- Fayetteville, NC
- Population (ZIP)
- 55,834
- Household income
- $62,249
- Rent vs Own
- Severe rent burden
- 2511.0
Population outlook (Cumberland County) Hauer SSP2
- Today (2025)
- 330,855 people
- By 2030
- 333,523 · +0.8%
- By 2040
- 335,583 · +1.4%
- By 2050
- 335,325 · +1.4%
- By 2075
- 342,853 · +3.6%
- By 2100
- 340,698 · +3.0%
Race, ethnicity, and origin ACS 2023
- Neighborhood character
- Diverse neighborhood (Simpson 0.67)
- Race & ethnicity
- Black 49% White 25% Hispanic / Latino 16% Two or more races 11% Asian 3%
- Hispanic origin (detail)
- Mexican 5% Puerto Rican 6% Dominican 1%
- Common ancestry
- Slovak 1% Romanian 1% Lithuanian 1%
- Foreign-born
- 9% · Canada, South Korea
- Languages at home
- 84% English-only · Spanish 10% Korean 1% Other Asian/Pacific 1%
Political lean MEDSL · Cumberland
- 2024 margin
- D (+13.4) · D 56.1% · R 42.7% · Other 1.2%
- 2008→2024 swing
- -4.3pp toward R · 2008: 17.7pp · 2024: 13.4pp
- All cycles
- 2024: D+13.4 2020: D+16.6 2016: D+16.0 2012: D+19.7 2008: D+17.7
Not yet ingested
- Civics
- —
Market trends
- HPI YoY
- ▼ -43.20%
- Current HPI
- 231.873
- Rent YoY
- ▲ 3.11%
- Metro
- Fayetteville, NC
- State GDP YoY
- ▲ 3.28%
- F500 in state
- 26
Industry mix (Fortune 500 HQ in NC)
| Industry | F500 HQs | Revenue |
|---|---|---|
| Financial Services | 2 | $213B |
|
||
| Retail | 2 | $95B |
|
||
| Industrial Conglomerate | 1 | $38B |
|
||
| Metals / Steel | 1 | $35B |
|
||
| Utilities | 1 | $30B |
|
||
| Industrial Machinery | 1 | $19B |
|
||
Price history
+49.8% since first listed8 events — show timeline
- 2026-06-04 Listed $83,900 LPRMLS
- 2025-09-01 Price Changed $93,500 LPRMLS
- 2025-07-19 Relisted — LPRMLS
- 2025-07-14 Pending — LPRMLS
- 2025-06-16 Listed $95,500 LPRMLS
- 2006-05-05 Sold (Public Records) $60,000 Public Records
- 1995-02-14 Sold (Public Records) $62,000 Public Records
- 1989-09-29 Sold (Public Records) $56,000 Public Records
Property tax history
-13.4%/yrLatest (2019): $382 · +0.0% YoY. Source: county tax records.
Cash-flow waterfall
monthlySold comps — $/sqft
last 12 mo · ≤1 miLoading sold comps…