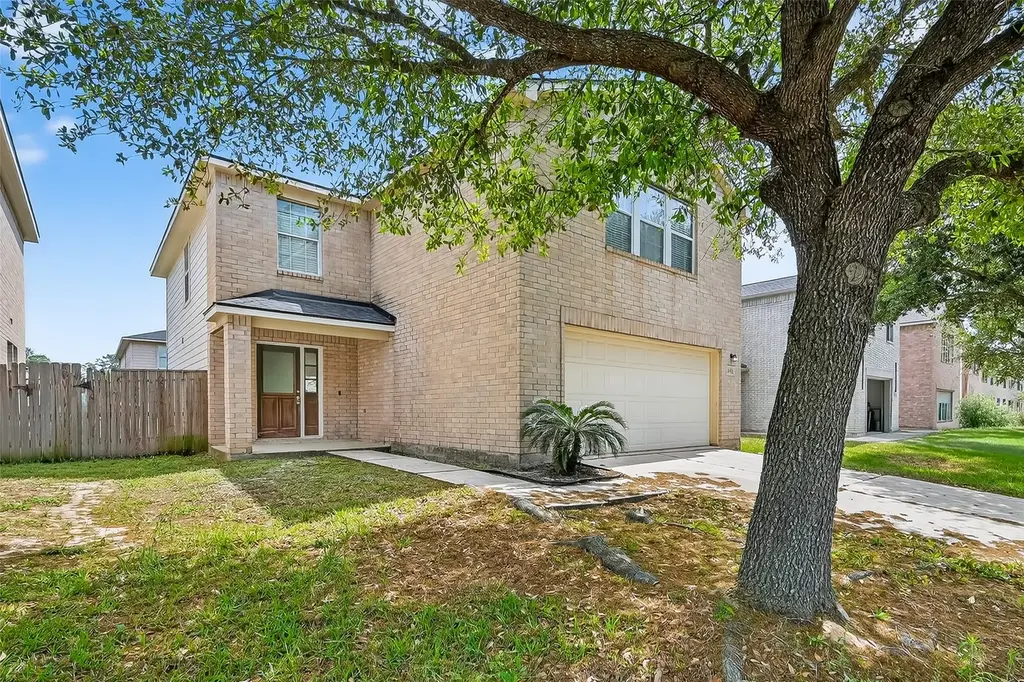
22802 Sherioaks Ln · The Woodlands, TX
Flood risk 1/10 · Minimal
- FEMA flood zone
- X (unshaded)
- Chance of flooding over 30 yrs
- 0.0%
- Est. flood insurance / yr
- $507 – $1,088
Fire risk 3/10 · Minor
- Est. fire insurance / yr
- $1,222 – $2,270
Heat risk 9/10 · Severe
- Hot days now (above 110°F)
- 7 days/yr
- Hot days in 30 yrs
- 25 days/yr
Wind risk 8/10 · Major
- Chance of severe wind over 30 yrs
- 99.0%
Air-quality risk 3/10 · Minor
- Unhealthy air days now
- 3 days/yr
- Unhealthy air days in 30 yrs
- 3 days/yr
Risk factors via First Street. Map © Google.
Why this score? — see what drove the D- grade
The composite is a weighted blend of 9 inputs, each scored 0–100. Each bar is that input's sub-score; the figure is the points it added to the 100-point composite (weight × sub-score).
- Cash flow +12.0/30.0
- 1% rule +4.8/10.0
- ARV discount +4.7/15.0
- Livability +4.5/5.0
- Schools +4.1/10.0
- DSCR +3.6/10.0
- Rent growth +3.0/5.0
- Condition / age +2.5/5.0
- Appreciation +0.0/10.0
$274,900
🖨 Deal sheet 📄 Offer letter ✓ Due diligence
Listing remarks MLS
Incredible value in Spring Klein. Move-in ready, 2 story home located FoxHollow community. New roof replaced in 2025, updated kitchen offers granite counters, new dishwasher, gas stove. 10 miles from The Woodlands, with easy access to 99 grand parkway and 1-45 North, and conveniently located close to Exxon Mobil campus, great location and opportunity. Built in 2005, 2,380 sq.ft. living space, 4 bedrooms all upstairs, 2.5 bathrooms, oversized primary bedroom, large game rooms upstairs, open living and dining areas, generous backyard. Perfect for families looking for space, functionality, and value in the highly desirable spring/klein area. Clean, well-maintained and ready for its next owner. Fantastic opportunity to own near The Woodlands without the price tag. Low Tax Rate.
Key facts
- Gas stove
- Updated kitchen
- Granite counters
Tags
Neighborhood map
What this means for you Summary
Snapshot
- This is a 4-bed/2.5-bath single-family listed at $275k.
Deal economics
- At list price, monthly cash flow is $-64 ($-768/yr) — negative.
- To cash-flow at today's rent, offer at most $264k (4.1% below list).
- To meet the 1% rule (rent ≥ 1% of price), the offer needs to be $270k (1.8% below list).
- Recommended offer: $258k (6.0% below list) — sets the bar for market timing.
- Cap rate 6.0% vs local median 2.3% in The Woodlands — top-decile yield for the area; either an underpriced asset or a hidden risk that comps aren't pricing in. Stress-test before assuming the spread holds.
Location & tenants
- Location reads 91/100 on livability (#1 in TX, #47 nationally) — a professional / high-income tenant draw. Strengths: schools A+, amenities A+, commute A+; Watch: cost of living D-.
- Klein ISD (suburban): math 41% / reading 48% proficiency, ranked #213 of 826 in TX (top 26%) — families likely to look elsewhere, expect single-tenant / working-renter base with shorter leases.
- Market conditions: Rents rising (+1.9%/yr); 383 active listings in the ZIP; 16 comparable units currently listed for rent nearby; rentals at typical pace (median 21d on market — plan ~3-4 weeks tenant-placement turnaround); high-income renter base; 29,883 units permitted in Harris County in 2024 (8,621 in 5+ unit buildings).
Forward outlook
- Local home prices are declining (-3.0%/yr); year-one equity from $2k of loan paydown is wiped out by about $8k of value loss. Plan a longer hold.
- Harris County population projected at +47% by 2050 — long-run rental-demand tailwind backs the buy-and-hold thesis.
Negotiation context
- It's been on market 76 days — a 6% lower offer ($258k) is reasonable based on typical stale-listing flexibility.
- 8 sale attempts since 20y ago with the ask held roughly flat each time — persistent listings suggest the price (not the market) is what's stuck; bring a comps-based counter.
Risks & watch-outs
- Watch-outs: property tax is 2.6% of price.
- Climate carrying-cost: severe wind risk, 99% chance of damaging wind over 30y; extreme-heat days projected 7→25/yr by 2055 (HVAC capex compounding) — expect insurance premiums to compound above CPI over the hold.
Questions for the listing agent
- What do current leases actually rent for vs. the listed asking? Can we see a recent rent roll and the last 12 months of T-12 income?
- It's been on market 76 days. Have you received any prior offers? Is the seller open to a 6% concession, seller financing, or rate buy-down credit?
- Property tax is high relative to price — has the assessment been appealed recently, and will the sale trigger a re-assessment?
- What does the HOA fee cover, when was the last increase, and are there any pending special assessments or reserve-fund shortfalls?
- Why hasn't it sold? Are there any deal-killer items the seller is aware of (foundation, flood, title, zoning, code violations)?
- Is there a deadline driving the sale (1031 exchange, divorce, estate, relocation)? That informs how much negotiation room exists.
- Schools are A-rated — typically a magnet for longer-tenancy family renters. What's the average tenant stay here, and is there a school-zone premium baked into asking?
- The area grade is low — what's the realistic commute time and amenity access for the typical tenant pool here? Any planned neighborhood developments (good or bad) we should know about?
- What's the average days-on-market for RENTAL listings here right now (not sales)? A rising rental-DOM trend means longer vacancies and softer asking-rent achievability than the comps imply.
- What's the recent tenant-quality profile in this submarket — average credit score on applications, eviction rate, late-payment / NSF rate, and stable-employment percentage? A property-management company in the area should have these aggregated.
- How much new for-sale + rental construction is in the pipeline within 1–3 miles? Heavy new supply typically softens prices + rents 12–24 months out; constrained supply supports both.
Investment metrics
- 1% rule
- 0.98% ✗
- Cap rate
- 6.01%
- Cash-on-cash
- -1.00%
- DSCR
- 0.96
- GRM
- 8.5
CMA / ARV
- ARV (median comp)
- $259,062
- List price
- $274,900
- Delta
- 6.11%
- Verdict
- FAIR
- Comps
- 20 within 1.0 mi
Show comp detail 12 sales within ~0.75 mi
| Address | Dist | Beds/Ba | Sqft | Sold | Price | $/sf | Match |
|---|---|---|---|---|---|---|---|
| 5143 Roth Forest Ln | 0.05mi | 4/2.5 | 2,344 (-2%) | 5mo | $245,000 | $105 | 91 |
| 22610 Cutter Mill Dr | 0.30mi | 3/2.0 (-1) | 2,404 (+1%) | 0mo | $349,500 | $145 | 77 |
| 22647 Cutter Mill Dr | 0.22mi | 3/2.5 (-1) | 2,236 (-6%) | 1mo | $375,000 | $168 | 74 |
| 22503 Birch Ridge Meadow Dr | 0.40mi | 3/2.0 (-1) | 2,320 (-2%) | 1mo | $368,000 | $159 | 70 |
| 4914 Woodbury Mill Dr | 0.22mi | 4/2.0 | 2,196 (-8%) | 8mo | $323,000 | $147 | 68 |
| 22610 Birch Ridge Meadow Dr | 0.29mi | 4/2.0 | 2,202 (-8%) | 6mo | $319,999 | $145 | 67 |
| 22534 Cutter Mill Dr | 0.34mi | 3/2.0 (-1) | 2,258 (-5%) | 3mo | $415,000 | $184 | 66 |
| 22906 Squirrel Tree St | 0.25mi | 4/2.0 | 2,071 (-13%) | 2mo | $247,000 | $119 | 63 |
| 22914 Squirrel Tree St | 0.27mi | 4/2.0 | 2,122 (-11%) | 7mo | $279,995 | $132 | 62 |
| 22618 Cutter Mill Dr | 0.28mi | 4/2.5 | 2,716 (+14%) | 7mo | $380,000 | $140 | 58 |
| 22202 Weller Oaks Dr | 0.74mi | 3/2.0 (-1) | 2,360 (-1%) | 1mo | $365,000 | $155 | 57 |
| 23323 N Preserve Glen Cir | 0.58mi | 3/2.5 (-1) | 2,589 (+9%) | 3mo | $445,000 | $172 | 51 |
Match score weights: distance 35% · size 25% · config 20% · recency 20%. Top-matched comps best support the ARV.
Projected returns pro-forma
-3.0% appreciation · 1.94% rent growth · sell at horizon
- IRR
- -19.2%
- Equity multiple
- 0.33×
- Total profit
- $-51,248
- Equity at exit
- $40,988
- IRR
- -14.4%
- Equity multiple
- 0.22×
- Total profit
- $-60,414
- Equity at exit
- $23,768
Cash invested: $76,972 (down + closing). Projections, not guarantees.
Landlord ↔ Tenant lean methodology
- Overall (STATE)
- 87 Strongly Landlord-Friendly
- State Texas
- 87 Strongly Landlord-Friendly · R+5
- County
- — inherits STATE
- City
- — inherits STATE
ZIP-level market 77389
- Rents YoY
- 1.9%
- Active inventory
- 383
- Price-to-rent
- 8.5×
Monthly cashflow live
- Estimated rent
- $2,700 high interval (Pro) →
- Mortgage (P&I)
- −$1,442
- Tax from tax record
- −$599 /mo · $7,185/yr
- Insurance
- −$115
- HOA
- −$42
- Vacancy / Maint / Mgmt
- −$567
- Net cashflow
- $-64
Break-even live
UW: 25.0% down · 7.5% · 30yr · 1.5% tax · 5.0% vac · 8.0% maint · 8.0% mgmt
Financing live
Cash to close
- Down payment
- $68,725
- Closing costs
- $8,247
- Reserves months
- —
- Total cash needed
- —
Loan-product check · same deal, 3 products live
Conventional
25% down · 7.5% · 30yr
- Down + closing
- —
- Monthly P&I
- —
- Monthly cashflow
- —
- DSCR
- —
- Eligible?
- —
Personal DTI + credit; lowest rate.
DSCR
20% down · 8.5% · 30yr
- Down + closing
- —
- Monthly P&I
- —
- Monthly cashflow
- —
- DSCR
- —
- Eligible?
- —
No personal income docs; deal must DSCR.
Hard money
10% down · 12.0% · 12mo
- Down + closing
- —
- Monthly P&I
- —
- Monthly cashflow
- —
- DSCR
- —
- Eligible?
- —
Short-term bridge; refi at stabilization.
Rent comps 16 comps
| Address | Beds | Baths | Sqft | Rent | $/sqft | DOM | Units | Dist |
|---|---|---|---|---|---|---|---|---|
| 4814 Preserve Creek Ct Unit 1 Spring, TX | 4.0 | 4.0 | 3250 | $3,395 | $1.04 | 20d | 1 | 0.70mi |
| 4702 Preserve Park Dr Unit SF10K2 Spring, TX | 4.0 | 3.0 | 2647 | $2,600 | $0.98 | 43d | 1 | 0.74mi |
| 5730 Blue Harvest DR The Woodlands, TX | 3.0–4.0 | 2.5 | 1660 | $3,391 | $2.04 | 5d | 98 | 0.76mi |
| 5522 Mesquite Oaks Trl Spring, TX | 4.0 | 2.0 | 2145 | $2,500 | $1.17 | 12d | 1 | 1.19mi |
| 21831 Catoosa Dr Spring, TX | 4.0 | 2.5 | 2287 | $2,100 | $0.92 | 43d | 1 | 1.31mi |
| 22197 Northcrest Dr Spring, TX | 3.0 | 2.0 | 1592 | $2,260 | $1.42 | 24d | 1 | 1.36mi |
| 22418 Bridgestone Ridge Dr Spring, TX | 4.0 | 3.5 | 2932 | $2,695 | $0.92 | 24d | 1 | 1.40mi |
| 4209 Spring Stuebner Rd Unit 4242 Spring, TX | 3.0 | 2.0 | 1584 | $2,210 | $1.40 | 11d | 1 | 1.41mi |
| 4209 Spring Stuebner Rd Unit 3228 Spring, TX | 3.0 | 2.0 | 1584 | $2,178 | $1.38 | 3d | 1 | 1.41mi |
| 5907 Wrest Point Ct Spring, TX | 4.0 | 2.5 | 2587 | $5,500 | $2.13 | 43d | 1 | 1.43mi |
| 4614 Bridgestone Path Dr Spring, TX | 4.0 | 2.5 | 2450 | $2,325 | $0.95 | 17d | 1 | 1.46mi |
| 21801 Northcrest Dr Unit 21834 Spring, TX | 3.0 | 2.0 | 1607 | $2,305 | $1.43 | 43d | 1 | 1.46mi |
| 21801 Northcrest Dr Unit 3174 Spring, TX | 3.0 | 2.0 | 1607 | $2,304 | $1.43 | 11d | 1 | 1.46mi |
| 21801 Northcrest Dr Unit 3228 Spring, TX | 3.0 | 2.0 | 1607 | $2,272 | $1.41 | 3d | 1 | 1.46mi |
| 6110 Wilcox Point Dr Spring, TX | 3.0 | 2.5 | 2429 | $2,245 | $0.92 | 43d | 1 | 1.48mi |
| 21801 Northcrest Dr Unit 3047 Spring, TX | 3.0 | 2.0 | 1607 | $2,304 | $1.43 | 3d | 1 | 1.50mi |
HOA detail
- Monthly dues
- $42 · $504/yr
- Likely covers
- gas
Listing history 30 events
-
2026-06-18days on market $274,900 Active 76 DOM
-
2026-06-17days on market $274,900 Active 75 DOM
-
2026-06-16days on market $274,900 Active 74 DOM
-
2026-06-15days on market $274,900 Active 73 DOM
-
2026-06-13days on market $274,900 Active 71 DOM
-
2026-06-09days on market $274,900 Active 67 DOM
-
2026-06-08days on market $274,900 Active 66 DOM
-
2026-06-07days on market $274,900 Active 65 DOM
-
2026-06-04days on market $274,900 Active 62 DOM
-
2026-06-03days on market $274,900 Active 61 DOM
-
2026-06-02days on market $274,900 Active 60 DOM
-
2026-06-01days on market $274,900 Active 59 DOM
-
2026-05-31days on market $274,900 Active 58 DOM
-
2026-04-03$274,900 Active 787-char remark
Show marketing remark (787 chars)
Incredible value in Spring Klein. Move-in ready, 2 story home located FoxHollow community. New roof replaced in 2025, updated kitchen offers granite counters, new dishwasher, gas stove. 10 miles from The Woodlands, with easy access to 99 grand parkway and 1-45 North, and conveniently located close to Exxon Mobil campus, great location and opportunity. Built in 2005, 2,380 sq.ft. living space, 4 bedrooms all upstairs, 2.5 bathrooms, oversized primary bedroom, large game rooms upstairs, open living and dining areas, generous backyard. Perfect for families looking for space, functionality, and value in the highly desirable spring/klein area. Clean, well-maintained and ready for its next owner. Fantastic opportunity to own near The Woodlands without the price tag. Low Tax Rate.
-
2026-01-27historical
-
2025-08-11price $289,900
-
2025-06-09$299,900 Active
-
2024-10-28historical $1,800
-
2024-10-19historical $1,800
-
2024-09-13$1,800
-
2024-09-10$1,800
-
2023-09-17historical $1,795
-
2023-09-15$1,795
-
2023-09-14historical $1,795
-
2023-08-22historical $1,795
-
2023-08-16$1,795
-
2023-08-15$1,795
-
2019-03-04soldstatus
-
2007-02-12historical
-
2006-10-03$139,900
ⓘ Source: listings_history table (triggers on properties + properties_extension) + one-shot
backfill from property_details.listing_events for pre-trigger history.
Tax reassessment forecast TX · Resets to sale price
- Current annual tax
- $7,185 · $599/mo
- Projected year-2 tax
- $7,185 · $599/mo
- Expected delta
- $0/yr ($0/mo · 0.0%)
ⓘ Screening estimate from a state-policy table — verify with the county assessor before closing.
Climate risk First Street
- Flood 1/10 Low FEMA zone X (unshaded) · 0% chance over 30 yrs
- Wildfire 3/10 Moderate
- Heat 9/10 Extreme 7 d/yr ≥110°F today · 25 d/yr by 30 yrs out
- Wind 8/10 Severe 99% chance of damaging wind over 30 yrs
- Air quality 3/10 Moderate 3 unhealthy d/yr today · 3 by 30 yrs out
Nearby sold comps map
Loading sold comps map…
Walkable amenities ~0.75 mi
Loading nearby amenities…
Taxation est. · year 1
- Rental income
- $32,399
- − Mortgage interest
- −$15,399
- − Property taxes
- −$7,185
- − Insurance
- −$1,374
- − Repairs & maintenance
- −$2,592
- − Management
- −$2,592
- − HOA
- −$504
- − Depreciation
- −$7,997
- Taxable loss
- −$5,245
- Est. tax savings @ 24.0%
- +$1,259
- After-tax cash flow
- $491/yr
For passive investors: Depreciation is non-cash, so a rental often shows a tax loss while cash-flowing — sheltering income. Rental losses are passive: they offset passive income freely, and up to $25,000/yr can offset ordinary (W-2) income if you actively participate and your MAGI is under $100k (phasing out to $0 by $150k); unused losses carry forward. On sale, claimed depreciation is recaptured at up to 25%, and gains may owe capital-gains tax (a 1031 exchange can defer both). Figures are a year-1 estimate at your 24.0% rate — not tax advice; consult a CPA.
Schools (NCES district)
- District
- Klein ISD
- NCES district ID
- 4825740
- Math proficiency
- 41% ▼ -12.00%
- Reading proficiency
- 48% ▼ -3.00%
- Median HH income
- $78,288
- Composite
- 40.91/100
- National rank
- #3615
- State rank
- #213 of 826 in TX
Livability — The Woodlands
- Score
- 91/100
- State rank
- #1
- US rank
- #47
Category grades
Schools grade is shown separately in the Schools card above.
Census & demographics
- County
- Harris County · 4,702,590 people
- City population
- 106,505
- Metro
- Houston-The Woodlands-Sugar Land, TX
- Population (ZIP)
- 45,701
- Household income
- $140,683
- Rent vs Own
- Severe rent burden
- 1191.0
Population outlook (Harris County) Hauer SSP2
- Today (2025)
- 5,571,493 people
- By 2030
- 6,089,821 · +9.3%
- By 2040
- 7,142,806 · +28.2%
- By 2050
- 8,185,864 · +46.9%
- By 2075
- 10,574,329 · +89.8%
- By 2100
- 12,109,958 · +117.4%
Race, ethnicity, and origin ACS 2023
- Neighborhood character
- Diverse neighborhood (Simpson 0.62)
- Race & ethnicity
- White 53% Hispanic / Latino 30% Two or more races 15% Black 7% Asian 6%
- Hispanic origin (detail)
- Mexican 19%
- Common ancestry
- Lithuanian 3% Romanian 2% Italian 2%
- Foreign-born
- 22% · Canada, Jamaica, China
- Languages at home
- 69% English-only · Spanish 21% Other Indo-European 4% Russian/Polish/Slavic 1%
Political lean MEDSL · Harris
- 2024 margin
- Lean D (+5.5) · D 52.0% · R 46.4% · Other 1.6%
- 2008→2024 swing
- +3.9pp toward D · 2008: 1.6pp · 2024: 5.5pp
- All cycles
- 2024: D+5.5 2020: D+13.3 2016: D+12.4 2012: D+0.1 2008: D+1.6
Not yet ingested
- Civics
- —
Market trends
- HPI YoY
- ▼ -159.54%
- Current HPI
- 236.5688
- Rent YoY
- ▲ 1.94%
- Metro
- Houston-The Woodlands-Sugar Land, TX
- State GDP YoY
- ▲ 3.95%
- F500 in state
- 110
Industry mix (Fortune 500 HQ in TX)
| Industry | F500 HQs | Revenue |
|---|---|---|
| Energy | 16 | $1,198B |
|
||
| Technology | 5 | $198B |
|
||
| Engineering / Construction | 4 | $72B |
|
||
| Energy Services | 3 | $60B |
|
||
| Utilities | 3 | $41B |
|
||
| Healthcare | 2 | $330B |
|
||
Price history
+96.5% since first listed17 events — show timeline
- 2026-04-03 Listed $274,900 HARMLS
- 2026-01-27 Listing Removed — HARMLS
- 2025-08-11 Price Changed $289,900 HARMLS
- 2025-06-09 Listed $299,900 HARMLS
- 2024-10-28 Rental Removed $1,800 RENT.
- 2024-10-19 Rental Removed $1,800 HARMLS
- 2024-09-13 Listed for Rent $1,800 RENT.
- 2024-09-10 Listed for Rent $1,800 HARMLS
- 2023-09-17 Rental Removed $1,795 RENTFEEDER
- 2023-09-15 Listed for Rent $1,795 RENTFEEDER
- 2023-09-14 Rental Removed $1,795 RENT.
- 2023-08-22 Rental Removed $1,795 RENTFEEDER
- 2023-08-16 Listed for Rent $1,795 RENTFEEDER
- 2023-08-15 Listed for Rent $1,795 RENT.
- 2019-03-04 Sold (Public Records) — Public Records
- 2007-02-12 Listing Removed — HARMLS
- 2006-10-03 Listed $139,900 HARMLS
Property tax history
+7.0%/yrLatest (2025): $7,185 · +12.3% YoY. Source: county tax records.
Cash-flow waterfall
monthlySold comps — $/sqft
last 12 mo · ≤1 miLoading sold comps…