1599 W J Williams Ln · Dunnellon, FL
Flood risk 1/10 · Minimal
- FEMA flood zone
- X (unshaded)
- Chance of flooding over 30 yrs
- 0.0%
- Est. flood insurance / yr
- $507 – $1,088
Fire risk 5/10 · Moderate
- Est. fire insurance / yr
- $947 – $1,759
Heat risk 9/10 · Severe
- Hot days now (above 106°F)
- 7 days/yr
- Hot days in 30 yrs
- 23 days/yr
Wind risk 9/10 · Severe
- Chance of severe wind over 30 yrs
- 99.0%
Air-quality risk 2/10 · Minimal
- Unhealthy air days now
- 0 days/yr
- Unhealthy air days in 30 yrs
- 1 days/yr
Risk factors via First Street. Map © Google.
Why this score? — see what drove the B+ grade
The composite is a weighted blend of 9 inputs, each scored 0–100. Each bar is that input's sub-score; the figure is the points it added to the 100-point composite (weight × sub-score).
- Cash flow +30.0/30.0
- ARV discount +15.0/15.0
- DSCR +10.0/10.0
- 1% rule +9.6/10.0
- Schools +4.1/10.0
- Livability +3.5/5.0
- Rent growth +2.5/5.0
- Condition / age +2.5/5.0
- Appreciation +0.1/10.0
$135,000
🖨 Deal sheet 📄 Offer letter ✓ Due diligence
Listing remarks MLS
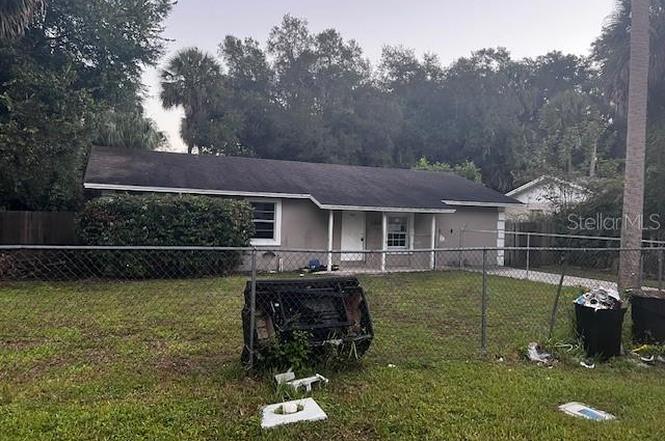
COMPLETELY UPDATED 3 Bedroom, 2 Bath Dunnellon HOME!! This lovely home was fully updated just one year ago with NEW ROOF, NEW VINYL, NEW BLINDS, NEW PAINT, NEW KITCHEN CABINETS, NEW COUNTERTOPS, NEW APPLIANCES and more! This is NOT a short sale or bank owned home, just a GREAT HOME at a GREAT PRICE!! Come and SEE IT TODAY!!
Key facts
- Functional kitchen
- Updated appliances
- Vinyl flooring
Tags
Property features AI
Finance
- Other: Residential property (single family); Zoning: CLRMH
- Financial info: No lease restrictions
- HOA & community: No association; No association approval required
Exterior
- Parking: Driveway
- Utilities: Public water; Septic tank; Electricity connected
- Home design: Single family residence; One story; Faces south
- Construction: Block construction; Shingle roof; Slab foundation; Built on 0.22-acre lot
- Exterior features: Other exterior features; Level lot; Mature landscaping; Paved road access
Interior
- Kitchen: Dishwasher; Microwave; Range
- Bedrooms: 3 bedrooms
- Flooring: Vinyl
- Bathrooms: 2 full bathrooms
- Heating & cooling: Central heating; Central air conditioning
- Interior features: Ceiling fans; Thermostat; Blinds
- Laundry & utility: Inside laundry
Neighborhood map
What this means for you Summary
Snapshot
- This is a 3-bed/2.0-bath single-family listed at $135k.
Deal economics
- At list price, monthly cash flow is $689 ($8k/yr) — positive.
- The deal already cash-flows at list — no discount required.
- Meets the 1% rule at list price ($2k rent vs $135k).
- Recommended offer: $119k (12.0% below list) — sets the bar for market timing.
Location & tenants
- Location reads 70/100 on livability (#443 in FL) — a middle-class / working-renter tenant base. Strengths: crime A+, cost of living A+, health & safety A+; Watch: schools D+, amenities F, commute F.
- Citrus (rural): math 49% / reading 50% proficiency, ranked #44 of 73 in FL (top 60%) — families likely to look elsewhere, expect single-tenant / working-renter base with shorter leases.
- Market conditions: 1242 active listings in the ZIP; 2 comparable units currently listed for rent nearby; 2,443 units permitted in Citrus County in 2024 (0 in 5+ unit buildings).
- This rent runs 34% of the median local income ($69k/yr) — at the standard rent-burdened threshold; future hikes will face affordability resistance.
Forward outlook
- Local home prices are declining (-3.0%/yr); year-one equity from $933 of loan paydown is wiped out by about $4k of value loss. Plan a longer hold.
- Citrus County population projected to shrink 10% by 2050 — rents likely to lag national; underwrite the cash flow, not the appreciation.
- At projected returns (-3.0% appreciation + 3.0% rent growth), your $38k cash investment doubles in ~6 years — after that, you're playing with house money.
Negotiation context
- It's been on market 223 days — a 12% lower offer ($119k) is reasonable based on typical stale-listing flexibility.
- 3 sale attempts since 6y ago; this cycle's ask has dropped $45k (25%) from the opening price — seller is motivated, your offer sets the floor, not the list.
- Current owner paid $95k; 42% above their basis — modest negotiation headroom, anchor on the comps not their cost.
Risks & watch-outs
- Climate carrying-cost: severe wind risk, 99% chance of damaging wind over 30y; moderate wildfire risk; extreme-heat days projected 7→23/yr by 2055 (HVAC capex compounding) — expect insurance premiums to compound above CPI over the hold.
Questions for the listing agent
- It's been on market 223 days. Have you received any prior offers? Is the seller open to a 12% concession, seller financing, or rate buy-down credit?
- Built in 1975 — when were the roof, HVAC, electrical panel, plumbing, and water heater last replaced?
- Why hasn't it sold? Are there any deal-killer items the seller is aware of (foundation, flood, title, zoning, code violations)?
- Is there a deadline driving the sale (1031 exchange, divorce, estate, relocation)? That informs how much negotiation room exists.
- Schools are D-rated, which usually means shorter tenancies and higher turnover. Who's the typical renter profile here, and what's been the actual vacancy rate?
- What's the average days-on-market for RENTAL listings here right now (not sales)? A rising rental-DOM trend means longer vacancies and softer asking-rent achievability than the comps imply.
- What's the recent tenant-quality profile in this submarket — average credit score on applications, eviction rate, late-payment / NSF rate, and stable-employment percentage? A property-management company in the area should have these aggregated.
- How much new for-sale + rental construction is in the pipeline within 1–3 miles? Heavy new supply typically softens prices + rents 12–24 months out; constrained supply supports both.
Investment metrics
- 1% rule
- 1.46% ✓
- Cap rate
- 12.42%
- Cash-on-cash
- 21.87%
- DSCR
- 1.97
- GRM
- 5.7
CMA / ARV
- ARV (on-the-fly)
- $172,224
- Comps found
- 3
Show comp detail 3 sales within ~0.75 mi
| Address | Dist | Beds/Ba | Sqft | Sold | Price | $/sf | Match |
|---|---|---|---|---|---|---|---|
| 1644 W Pinion Ln | 0.50mi | 3/1.5 | 1,348 (+8%) | 5mo | $185,650 | $138 | 58 |
| 11820 N Par Ter | 0.52mi | 3/1.5 | 1,380 (+11%) | 9mo | $174,900 | $127 | 49 |
| 20327 The Granada | 0.49mi | 3/2.0 | 1,376 (+10%) | 14mo | $200,000 | $145 | 48 |
Match score weights: distance 35% · size 25% · config 20% · recency 20%. Top-matched comps best support the ARV.
Projected returns pro-forma
-3.0% appreciation · 3.0% rent growth · sell at horizon
- IRR
- 14.5%
- Equity multiple
- 1.58×
- Total profit
- $22,000
- Equity at exit
- $20,129
- IRR
- 23.3%
- Equity multiple
- 3.00×
- Total profit
- $75,632
- Equity at exit
- $11,672
Cash invested: $37,800 (down + closing). Projections, not guarantees.
Landlord ↔ Tenant lean methodology
- Overall (STATE)
- 87 Strongly Landlord-Friendly
- State Florida
- 87 Strongly Landlord-Friendly · R+3
- County
- — inherits STATE
- City
- — inherits STATE
ZIP-level market 34434
- Home prices YoY
- -2.9%
- Active inventory
- 1242
- Price-to-rent
- 5.7×
Monthly cashflow live
- Estimated rent
- $1,976 medium interval (Pro) →
- Mortgage (P&I)
- −$708
- Tax from tax record
- −$108 /mo · $1,292/yr
- Insurance
- −$56
- HOA
- −$0
- Vacancy / Maint / Mgmt
- −$415
- Net cashflow
- $689
Break-even live
UW: 25.0% down · 7.5% · 30yr · 1.5% tax · 5.0% vac · 8.0% maint · 8.0% mgmt
Financing live
Cash to close
- Down payment
- $33,750
- Closing costs
- $4,050
- Reserves months
- —
- Total cash needed
- —
Loan-product check · same deal, 3 products live
Conventional
25% down · 7.5% · 30yr
- Down + closing
- —
- Monthly P&I
- —
- Monthly cashflow
- —
- DSCR
- —
- Eligible?
- —
Personal DTI + credit; lowest rate.
DSCR
20% down · 8.5% · 30yr
- Down + closing
- —
- Monthly P&I
- —
- Monthly cashflow
- —
- DSCR
- —
- Eligible?
- —
No personal income docs; deal must DSCR.
Hard money
10% down · 12.0% · 12mo
- Down + closing
- —
- Monthly P&I
- —
- Monthly cashflow
- —
- DSCR
- —
- Eligible?
- —
Short-term bridge; refi at stabilization.
Rent comps 2 comps
| Address | Beds | Baths | Sqft | Rent | $/sqft | DOM | Units | Dist |
|---|---|---|---|---|---|---|---|---|
| 2186 W G Martinelli Blvd Citrus Springs, FL | 3.0 | 2.0 | 1448 | $1,950 | $1.35 | 21d | 1 | 1.00mi |
| 1150 W G Martinelli Blvd Citrus Springs, FL | 3.0 | 2.0 | 1276 | $1,600 | $1.25 | 21d | 1 | 1.43mi |
Listing history 34 events
-
2026-06-19days on market $135,000 Active 223 DOM
-
2026-06-18days on market $135,000 Active 222 DOM
-
2026-06-17days on market $135,000 Active 221 DOM
-
2026-06-16days on market $135,000 Active 220 DOM
-
2026-06-15days on market $135,000 Active 219 DOM
-
2026-06-14days on market $135,000 Active 217 DOM
-
2026-06-13days on market $135,000 Active 216 DOM
-
2026-06-09days on market $135,000 Active 213 DOM
-
2026-06-08days on market $135,000 Active 212 DOM
-
2026-06-03days on market $135,000 Active 207 DOM
-
2026-06-02days on market $135,000 Active 206 DOM
-
2026-06-01days on market $135,000 Active 205 DOM
-
2026-05-31days on market $135,000 Active 204 DOM
-
2026-05-30days on market $135,000 Active 203 DOM
-
2026-04-24price $135,000
-
2026-04-09price $105,000
-
2026-03-23price $110,000
-
2026-03-04status Active
-
2026-02-20status Pending
-
2026-02-13price $120,000
-
2026-01-30price $130,000
-
2026-01-15price $138,000
-
2025-12-31price $144,000
-
2025-12-16price $150,000
-
2025-12-02price $160,000
-
2025-11-18price $170,000
-
2025-10-27$180,000 Active
-
2020-05-11soldstatus $95,000
-
2020-05-08soldstatus $95,000 330-char remark
Show marketing remark (330 chars)
COMPLETELY UPDATED 3 Bedroom, 2 Bath Dunnellon HOME!! This lovely home was fully updated just one year ago with NEW ROOF, NEW VINYL, NEW BLINDS, NEW PAINT, NEW KITCHEN CABINETS, NEW COUNTERTOPS, NEW APPLIANCES and more! This is NOT a short sale or bank owned home, just a GREAT HOME at a GREAT PRICE!! Come and SEE IT TODAY!!
-
2020-02-13$89,900 330-char remark
Show marketing remark (330 chars)
COMPLETELY UPDATED 3 Bedroom, 2 Bath Dunnellon HOME!! This lovely home was fully updated just one year ago with NEW ROOF, NEW VINYL, NEW BLINDS, NEW PAINT, NEW KITCHEN CABINETS, NEW COUNTERTOPS, NEW APPLIANCES and more! This is NOT a short sale or bank owned home, just a GREAT HOME at a GREAT PRICE!! Come and SEE IT TODAY!!
-
1998-03-17soldstatus $35,000
-
1995-06-01soldstatus $38,300
-
1994-01-01soldstatus $35,500
-
1983-09-01soldstatus $21,826
ⓘ Source: listings_history table (triggers on properties + properties_extension) + one-shot
backfill from property_details.listing_events for pre-trigger history.
Tax reassessment forecast FL · Resets to sale price
- Current annual tax
- $1,292 · $108/mo
- Projected year-2 tax
- $1,292 · $108/mo
- Expected delta
- $0/yr ($0/mo · 0.0%)
ⓘ Screening estimate from a state-policy table — verify with the county assessor before closing.
Climate risk First Street
- Flood 1/10 Low FEMA zone X (unshaded) · 0% chance over 30 yrs
- Wildfire 5/10 Major
- Heat 9/10 Extreme 7 d/yr ≥106°F today · 23 d/yr by 30 yrs out
- Wind 9/10 Extreme 99% chance of damaging wind over 30 yrs
- Air quality 2/10 Low 0 unhealthy d/yr today · 1 by 30 yrs out
Nearby sold comps map
Loading sold comps map…
Walkable amenities ~0.75 mi
Loading nearby amenities…
Taxation est. · year 1
- Rental income
- $23,709
- − Mortgage interest
- −$7,562
- − Property taxes
- −$1,292
- − Insurance
- −$675
- − Repairs & maintenance
- −$1,897
- − Management
- −$1,897
- − Depreciation
- −$3,927
- Taxable income
- $6,460
- Est. tax owed @ 24.0%
- −$1,550
- After-tax cash flow
- $6,718/yr
For passive investors: Depreciation is non-cash, so a rental often shows a tax loss while cash-flowing — sheltering income. Rental losses are passive: they offset passive income freely, and up to $25,000/yr can offset ordinary (W-2) income if you actively participate and your MAGI is under $100k (phasing out to $0 by $150k); unused losses carry forward. On sale, claimed depreciation is recaptured at up to 25%, and gains may owe capital-gains tax (a 1031 exchange can defer both). Figures are a year-1 estimate at your 24.0% rate — not tax advice; consult a CPA.
Schools (NCES district)
- District
- Citrus
- NCES district ID
- 1200270
- Math proficiency
- 49% ▼ -10.00%
- Reading proficiency
- 50% ▼ -6.00%
- Median HH income
- $38,618
- Composite
- 41.28/100
- National rank
- #3519
- State rank
- #44 of 73 in FL
Livability — Dunnellon
- Score
- 70/100
- State rank
- #443
- US rank
- #7922
Category grades
Schools grade is shown separately in the Schools card above.
Census & demographics
- County
- Citrus County · 111,314 people
- City population
- 20,859
- Metro
- Homosassa Springs, FL
- Population (ZIP)
- 11,074
- Household income
- $68,939
- Rent vs Own
- Severe rent burden
- 171.0
Population outlook (Citrus County) Hauer SSP2
- Today (2025)
- 138,622 people
- By 2030
- 136,886 · -1.3%
- By 2040
- 132,009 · -4.8%
- By 2050
- 125,196 · -9.7%
- By 2075
- 108,570 · -21.7%
- By 2100
- 84,454 · -39.1%
Race, ethnicity, and origin ACS 2023
- Neighborhood character
- Predominantly White (78%)
- Race & ethnicity
- White 78% Two or more races 11% Hispanic / Latino 9% Black 6%
- Hispanic origin (detail)
- Mexican 3% Puerto Rican 4%
- Common ancestry
- Iranian 3% Romanian 2% Slovak 2%
- Foreign-born
- 4% · Canada
- Languages at home
- 93% English-only · Spanish 5% German/W. Germanic 1% Other Indo-European 1%
Political lean MEDSL · Citrus
- 2024 margin
- Solid R (+45.9) · D 26.8% · R 72.6%
- 2008→2024 swing
- -29.8pp toward R · 2008: -16.1pp · 2024: -45.9pp
- All cycles
- 2024: R+45.9 2020: R+41.0 2016: R+39.7 2012: R+21.9 2008: R+16.1
Not yet ingested
- Civics
- —
Market trends
- HPI YoY
- ▼ -9.70%
- Current HPI
- 328.2164
- Rent YoY
- —
- Metro
- Homosassa Springs, FL
- State GDP YoY
- ▲ 3.28%
- F500 in state
- 36
Industry mix (Fortune 500 HQ in FL)
| Industry | F500 HQs | Revenue |
|---|---|---|
| Industrial Technology | 2 | $29B |
|
||
| Insurance | 2 | $17B |
|
||
| Retail | 1 | $60B |
|
||
| Technology Distribution | 1 | $58B |
|
||
| Homebuilding | 1 | $35B |
|
||
| Technology Manufacturing | 1 | $35B |
|
||
Price history
+518.5% since first listed20 events — show timeline
- 2026-04-24 Price Changed $135,000 Stellar MLS as Distributed by MLS Grid
- 2026-04-09 Price Changed $105,000 Stellar MLS as Distributed by MLS Grid
- 2026-03-23 Price Changed $110,000 Stellar MLS as Distributed by MLS Grid
- 2026-03-04 Relisted — Stellar MLS as Distributed by MLS Grid
- 2026-02-20 Pending — Stellar MLS as Distributed by MLS Grid
- 2026-02-13 Price Changed $120,000 Stellar MLS as Distributed by MLS Grid
- 2026-01-30 Price Changed $130,000 Stellar MLS as Distributed by MLS Grid
- 2026-01-15 Price Changed $138,000 Stellar MLS as Distributed by MLS Grid
- 2025-12-31 Price Changed $144,000 Stellar MLS as Distributed by MLS Grid
- 2025-12-16 Price Changed $150,000 Stellar MLS as Distributed by MLS Grid
- 2025-12-02 Price Changed $160,000 Stellar MLS as Distributed by MLS Grid
- 2025-11-18 Price Changed $170,000 Stellar MLS as Distributed by MLS Grid
- 2025-10-27 Listed $180,000 Stellar MLS as Distributed by MLS Grid
- 2020-05-11 Sold (Public Records) $95,000 Public Records
- 2020-05-08 Sold (MLS) $95,000 Stellar MLS as Distributed by MLS Grid
- 2020-02-13 Listed $89,900 Stellar MLS as Distributed by MLS Grid
- 1998-03-17 Sold (Public Records) $35,000 Public Records
- 1995-06-01 Sold (Public Records) $38,300 Public Records
- 1994-01-01 Sold (Public Records) $35,500 Public Records
- 1983-09-01 Sold (Public Records) $21,826 Public Records
Property tax history
+4.7%/yrLatest (2025): $1,292 · +7.2% YoY. Source: county tax records.
Cash-flow waterfall
monthlySold comps — $/sqft
last 12 mo · ≤1 miLoading sold comps…