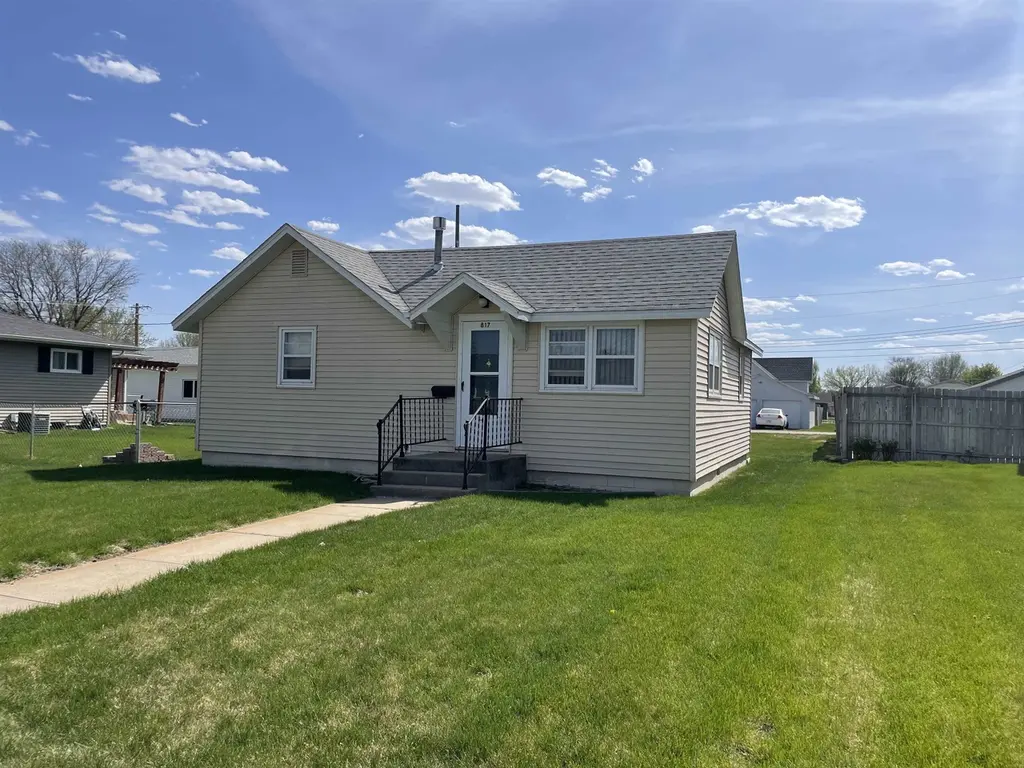
817 Jefferson St · Gothenburg, NE
Flood risk 1/10 · Minimal
- FEMA flood zone
- X (unshaded)
- Chance of flooding over 30 yrs
- 0.0%
- Est. flood insurance / yr
- $507 – $1,088
Fire risk 3/10 · Minor
- Est. fire insurance / yr
- $1,161 – $2,155
Heat risk 3/10 · Minor
- Hot days now (above 100°F)
- 7 days/yr
- Hot days in 30 yrs
- 18 days/yr
Wind risk 2/10 · Minimal
- Chance of severe wind over 30 yrs
- —
Air-quality risk 1/10 · Minimal
- Unhealthy air days now
- 0 days/yr
- Unhealthy air days in 30 yrs
- 0 days/yr
Risk factors via First Street. Map © Google.
Why this score? — see what drove the C- grade
The composite is a weighted blend of 9 inputs, each scored 0–100. Each bar is that input's sub-score; the figure is the points it added to the 100-point composite (weight × sub-score).
- Cash flow +23.0/30.0
- DSCR +7.4/10.0
- 1% rule +6.0/10.0
- ARV discount +4.9/15.0
- Livability +4.2/5.0
- Schools +4.0/10.0
- Rent growth +2.5/5.0
- Condition / age +2.5/5.0
- Appreciation +0.0/10.0
$89,900
🖨 Deal sheet 📄 Offer letter ✓ Due diligence
Listing remarks
Don't miss this Charming 2-Bedroom Home with Detached Garage This cozy 2-bedroom, 1-bathroom home offers comfort, simplicity, and great value. Perfect for first-time buyers, downsizers, or investors, the home features a functional layout with a bright living space, a practical kitchen, and two comfortably sized bedrooms. Located in a quiet neighborhood. Call for a tour today
Key facts
- 5,600 sq ft lot
- Garage
- Built 1930
Property features AI
Exterior
- Parking: Detached garage with garage door opener; 1 garage space
- Utilities: Public water; Public sewer; Natural gas available
- Home design: Single-family residence; Residential property
- Construction: Frame construction; Crawl space foundation
- Exterior features: 40 x 140 lot; Zoned residential
Interior
- Kitchen: Dishwasher; Electric range; Refrigerator
- Bathrooms: One main-level bathroom
- Heating & cooling: Ceiling fan(s); Has cooling
- Interior features: Dishwasher; Electric range; Refrigerator; Ceiling fan(s)
- Laundry & utility: Main-level laundry
Neighborhood map
What this means for you Summary
Snapshot
- This is a 2-bed/1.0-bath single-family listed at $90k.
Deal economics
- At list price, monthly cash flow is $159 ($2k/yr) — positive.
- The deal already cash-flows at list — no discount required.
- Meets the 1% rule at list price ($988 rent vs $90k).
- Cap rate 8.4% vs local median 3.3% in Gothenburg — top-decile yield for the area; either an underpriced asset or a hidden risk that comps aren't pricing in. Stress-test before assuming the spread holds.
Location & tenants
- Location reads 83/100 on livability (#10 in NE, #854 nationally) — a professional / high-income tenant draw. Strengths: crime A+, cost of living A+, housing A+; Watch: amenities D+, commute F.
- Gothenburg Public Schools (town): math 42% / reading 51% proficiency, ranked #74 of 111 in NE (top 67%) — families likely to look elsewhere, expect single-tenant / working-renter base with shorter leases.
- Market conditions: 44 active listings in the ZIP; 61 units permitted in Dawson County in 2024 (36 in 5+ unit buildings).
Forward outlook
- Local home prices are declining (-3.0%/yr); year-one equity from $622 of loan paydown is wiped out by about $3k of value loss. Plan a longer hold.
- Dawson County population projected to shrink 8% by 2050 — rents likely to lag national; underwrite the cash flow, not the appreciation.
Negotiation context
- Only 12 days on market — expect competitive offers; lowballing is unlikely to land.
- 2 sale attempts; this cycle's ask is 6% above the opening price — seller raised mid-cycle; expect resistance to lowballs.
Risks & watch-outs
- Watch-outs: built in 1930 — expect roof / HVAC / electrical / plumbing capex.
Questions for the listing agent
- Built in 1930 — when were the roof, HVAC, electrical panel, plumbing, and water heater last replaced?
- Is there a deadline driving the sale (1031 exchange, divorce, estate, relocation)? That informs how much negotiation room exists.
- What's the average days-on-market for RENTAL listings here right now (not sales)? A rising rental-DOM trend means longer vacancies and softer asking-rent achievability than the comps imply.
- What's the recent tenant-quality profile in this submarket — average credit score on applications, eviction rate, late-payment / NSF rate, and stable-employment percentage? A property-management company in the area should have these aggregated.
- How much new for-sale + rental construction is in the pipeline within 1–3 miles? Heavy new supply typically softens prices + rents 12–24 months out; constrained supply supports both.
Investment metrics
- 1% rule
- 1.10% ✓
- Cap rate
- 8.42%
- Cash-on-cash
- 7.59%
- DSCR
- 1.34
- GRM
- 7.6
CMA / ARV
- ARV (median comp)
- $85,000
- List price
- $89,900
- Delta
- 5.76%
- Verdict
- FAIR
- Comps
- 15 within 1.0 mi
Show comp detail 2 sales within ~0.75 mi
| Address | Dist | Beds/Ba | Sqft | Sold | Price | $/sf | Match |
|---|---|---|---|---|---|---|---|
| 817 Jefferson St | 0.00mi | 2/1.0 | 710 (0%) | 0mo | $85,000 | $120 | 100 |
| 1146 H Ave | 0.06mi | 2/1.0 | 760 (+7%) | 20mo | $42,500 | $56 | 69 |
Match score weights: distance 35% · size 25% · config 20% · recency 20%. Top-matched comps best support the ARV.
Projected returns pro-forma
-3.0% appreciation · 3.0% rent growth · sell at horizon
- IRR
- -4.7%
- Equity multiple
- 0.82×
- Total profit
- $-4,415
- Equity at exit
- $13,404
- IRR
- 5.0%
- Equity multiple
- 1.37×
- Total profit
- $9,271
- Equity at exit
- $7,773
Cash invested: $25,172 (down + closing). Projections, not guarantees.
Landlord ↔ Tenant lean methodology
- Overall (STATE)
- 83 Strongly Landlord-Friendly
- State Nebraska
- 83 Strongly Landlord-Friendly · R+13
- County
- — inherits STATE
- City
- — inherits STATE
ZIP-level market 69138
- Home prices YoY
- -18.6%
- Active inventory
- 44
- Price-to-rent
- 7.6×
Monthly cashflow live
- Estimated rent
- $988 medium interval (Pro) →
- Mortgage (P&I)
- −$471
- Tax est. 1.5%
- −$112 /mo · $1,348/yr
- Insurance
- −$37
- HOA
- −$0
- Vacancy / Maint / Mgmt
- −$207
- Net cashflow
- $159
Break-even live
UW: 25.0% down · 7.5% · 30yr · 1.5% tax · 5.0% vac · 8.0% maint · 8.0% mgmt
Financing live
Cash to close
- Down payment
- $22,475
- Closing costs
- $2,697
- Reserves months
- —
- Total cash needed
- —
Loan-product check · same deal, 3 products live
Conventional
25% down · 7.5% · 30yr
- Down + closing
- —
- Monthly P&I
- —
- Monthly cashflow
- —
- DSCR
- —
- Eligible?
- —
Personal DTI + credit; lowest rate.
DSCR
20% down · 8.5% · 30yr
- Down + closing
- —
- Monthly P&I
- —
- Monthly cashflow
- —
- DSCR
- —
- Eligible?
- —
No personal income docs; deal must DSCR.
Hard money
10% down · 12.0% · 12mo
- Down + closing
- —
- Monthly P&I
- —
- Monthly cashflow
- —
- DSCR
- —
- Eligible?
- —
Short-term bridge; refi at stabilization.
Listing history 6 events
-
2026-05-09status Pending 378-char remark
-
2026-04-27$89,900 Active 378-char remark
-
2006-06-19soldstatus $27,500
-
2006-06-09soldstatus $27,500
-
2004-11-24soldstatus $43,500
-
2001-12-07soldstatus $39,500
ⓘ Source: listings_history table (triggers on properties + properties_extension) + one-shot
backfill from property_details.listing_events for pre-trigger history.
Climate risk First Street
- Flood 1/10 Low FEMA zone X (unshaded) · 0% chance over 30 yrs
- Wildfire 3/10 Moderate
- Heat 3/10 Moderate 7 d/yr ≥100°F today · 18 d/yr by 30 yrs out
- Wind 2/10 Low
- Air quality 1/10 Low 0 unhealthy d/yr today · 0 by 30 yrs out
Nearby sold comps map
Loading sold comps map…
Walkable amenities ~0.75 mi
Loading nearby amenities…
Taxation est. · year 1
- Rental income
- $11,855
- − Mortgage interest
- −$5,036
- − Property taxes
- −$1,348
- − Insurance
- −$450
- − Repairs & maintenance
- −$948
- − Management
- −$948
- − Depreciation
- −$2,615
- Taxable income
- $509
- Est. tax owed @ 24.0%
- −$122
- After-tax cash flow
- $1,788/yr
For passive investors: Depreciation is non-cash, so a rental often shows a tax loss while cash-flowing — sheltering income. Rental losses are passive: they offset passive income freely, and up to $25,000/yr can offset ordinary (W-2) income if you actively participate and your MAGI is under $100k (phasing out to $0 by $150k); unused losses carry forward. On sale, claimed depreciation is recaptured at up to 25%, and gains may owe capital-gains tax (a 1031 exchange can defer both). Figures are a year-1 estimate at your 24.0% rate — not tax advice; consult a CPA.
Schools (NCES district)
- District
- Gothenburg Public Schools
- NCES district ID
- 3171100
- Math proficiency
- 42% ▼ -10.00%
- Reading proficiency
- 51% ▼ -3.00%
- Median HH income
- $52,914
- Composite
- 40.13/100
- National rank
- #3796
- State rank
- #74 of 111 in NE
Livability — Gothenburg
- Score
- 83/100
- State rank
- #10
- US rank
- #854
Category grades
Schools grade is shown separately in the Schools card above.
Census & demographics
- Census place
- Gothenburg, NE
- Population (ZIP)
- 4,304
Population outlook (Dawson County) Hauer SSP2
- Today (2025)
- 23,318 people
- By 2030
- 22,912 · -1.7%
- By 2040
- 22,097 · -5.2%
- By 2050
- 21,358 · -8.4%
- By 2075
- 19,801 · -15.1%
- By 2100
- 17,647 · -24.3%
Race, ethnicity, and origin ACS 2023
- Neighborhood character
- Predominantly White (87%)
- Race & ethnicity
- White 87% Two or more races 9% Hispanic / Latino 6%
- Hispanic origin (detail)
- Mexican 6%
- Common ancestry
- Romanian 3% Slovak 3% Serbian 2%
- Foreign-born
- 3% · Canada
- Languages at home
- 94% English-only · Spanish 3% Tagalog/Filipino 2% Other Indo-European 1%
Political lean MEDSL · Dawson
- 2024 margin
- Solid R (+49.6) · D 24.7% · R 74.3%
- 2008→2024 swing
- -11.3pp toward R · 2008: -38.3pp · 2024: -49.6pp
- All cycles
- 2024: R+49.6 2020: R+43.8 2016: R+45.0 2012: R+41.8 2008: R+38.3
Not yet ingested
- Civics
- —
Market trends
- HPI YoY
- ▼ -46.40%
- Current HPI
- 203.5948
- Rent YoY
- —
- Metro
- —
- State GDP YoY
- ▲ 0.68%
- F500 in state
- 2
Industry mix (Fortune 500 HQ in NE)
| Industry | F500 HQs | Revenue |
|---|---|---|
| Conglomerate | 1 | $371B |
|
||
Price history
+115.2% since first listed9 events — show timeline
- 2026-06-15 Listed $85,000 LCBR
- 2026-06-12 Sold (MLS) $85,000 GMNMLS
- 2026-06-12 Sold (MLS) $85,000 LCBR
- 2026-05-09 Pending — GMNMLS
- 2026-04-27 Listed $89,900 GMNMLS
- 2006-06-19 Sold (Public Records) $27,500 Public Records
- 2006-06-09 Sold (Public Records) $27,500 Public Records
- 2004-11-24 Sold (Public Records) $43,500 Public Records
- 2001-12-07 Sold (Public Records) $39,500 Public Records
Cash-flow waterfall
monthlySold comps — $/sqft
last 12 mo · ≤1 miLoading sold comps…