1213 Craigmont Dr · Lynchburg, VA
Flood risk 1/10 · Minimal
- FEMA flood zone
- X (unshaded)
- Chance of flooding over 30 yrs
- 0.0%
- Est. flood insurance / yr
- $507 – $1,088
Fire risk 2/10 · Minimal
- Est. fire insurance / yr
- $666 – $1,236
Heat risk 6/10 · Moderate
- Hot days now (above 102°F)
- 7 days/yr
- Hot days in 30 yrs
- 19 days/yr
Wind risk 2/10 · Minimal
- Chance of severe wind over 30 yrs
- 2.0%
Air-quality risk 2/10 · Minimal
- Unhealthy air days now
- 0 days/yr
- Unhealthy air days in 30 yrs
- 1 days/yr
Risk factors via First Street. Map © Google.
Why this score? — see what drove the D+ grade
The composite is a weighted blend of 9 inputs, each scored 0–100. Each bar is that input's sub-score; the figure is the points it added to the 100-point composite (weight × sub-score).
- ARV discount +15.0/15.0
- Cash flow +13.9/30.0
- Livability +4.5/5.0
- DSCR +4.2/10.0
- Schools +4.0/10.0
- Rent growth +2.8/5.0
- 1% rule +2.7/10.0
- Condition / age +2.5/5.0
- Appreciation +0.0/10.0
$229,900
🖨 Deal sheet 📄 Offer letter ✓ Due diligence
Listing remarks MLS
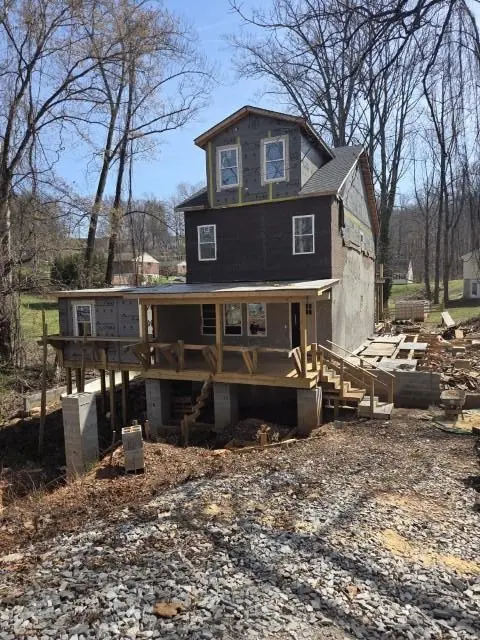
A wonderful opportunity to provide the completion and design of this large 3 story home. Six bedrooms and 4 1/2 baths are possible with plenty of open space on the first floor. Great front and rear covered porches for relaxing. Large deck off the primary bedroom.
Key facts
- 0.23 acre lot
- 4 parking spots
- Built 2024
Neighborhood map
What this means for you Summary
Snapshot
- This is a 6-bed/5.5-bath single-family listed at $230k.
Deal economics
- At list price, monthly cash flow is $25 ($296/yr) — positive.
- The deal already cash-flows at list — no discount required.
- To meet the 1% rule (rent ≥ 1% of price), the offer needs to be $176k (23.3% below list).
- Recommended offer: $176k (23.3% below list) — sets the bar for 1% rule.
- Cap rate 6.4% vs local median 4.0% in Lynchburg — top-decile yield for the area; either an underpriced asset or a hidden risk that comps aren't pricing in. Stress-test before assuming the spread holds.
Location & tenants
- Location reads 91/100 on livability (#1 in VA, #58 nationally) — a professional / high-income tenant draw. Strengths: amenities A+, commute A+, cost of living A+; Watch: crime C-, employment D+.
- Lynchburg City Public School District (urban): math 36% / reading 61% proficiency, ranked #104 of 131 in VA (top 79%) — families likely to look elsewhere, expect single-tenant / working-renter base with shorter leases; 61% free/reduced lunch — lower-income household profile, screen leases tightly.
- Market conditions: Rents rising (+1.1%/yr); 216 active listings in the ZIP; lower-income renter base — watch delinquency; 472 units permitted in Lynchburg city in 2024 (240 in 5+ unit buildings).
- At $1,764/mo this rent would consume 50% of the median local household income ($42k/yr) (locally 1717% of renters already pay >50% of income on rent) — very limited rent-growth headroom before tenants either downsize or default.
Forward outlook
- Local home prices are declining (-3.0%/yr); year-one equity from $2k of loan paydown is wiped out by about $7k of value loss. Plan a longer hold.
- Lynchburg County population projected at +37% by 2050 — long-run rental-demand tailwind backs the buy-and-hold thesis.
Negotiation context
- It's been on market 85 days — a 6% lower offer ($216k) is reasonable based on typical stale-listing flexibility.
- 8 sale attempts since 14y ago with the ask held roughly flat each time — persistent listings suggest the price (not the market) is what's stuck; bring a comps-based counter.
- Current owner paid $9k; list at $230k implies a 2454% gain — meaningful room to come down on a strong offer.
Risks & watch-outs
- Climate carrying-cost: extreme-heat days projected 7→19/yr by 2055 (HVAC capex compounding) — expect insurance premiums to compound above CPI over the hold.
Questions for the listing agent
- It's been on market 85 days. Have you received any prior offers? Is the seller open to a 23% concession, seller financing, or rate buy-down credit?
- Why hasn't it sold? Are there any deal-killer items the seller is aware of (foundation, flood, title, zoning, code violations)?
- Is there a deadline driving the sale (1031 exchange, divorce, estate, relocation)? That informs how much negotiation room exists.
- Schools are A-rated — typically a magnet for longer-tenancy family renters. What's the average tenant stay here, and is there a school-zone premium baked into asking?
- The area grade is low — what's the realistic commute time and amenity access for the typical tenant pool here? Any planned neighborhood developments (good or bad) we should know about?
- What's the average days-on-market for RENTAL listings here right now (not sales)? A rising rental-DOM trend means longer vacancies and softer asking-rent achievability than the comps imply.
- What's the recent tenant-quality profile in this submarket — average credit score on applications, eviction rate, late-payment / NSF rate, and stable-employment percentage? A property-management company in the area should have these aggregated.
- How much new for-sale + rental construction is in the pipeline within 1–3 miles? Heavy new supply typically softens prices + rents 12–24 months out; constrained supply supports both.
Investment metrics
- 1% rule
- 0.77% ✗
- Cap rate
- 6.42%
- Cash-on-cash
- 0.46%
- DSCR
- 1.02
- GRM
- 10.9
CMA / ARV
- ARV (median comp)
- $375,984
- List price
- $229,900
- Delta
- -38.85%
- Verdict
- UNDERPRICED
- Comps
- 5 within 1.0 mi
Projected returns pro-forma
-3.0% appreciation · 1.15% rent growth · sell at horizon
- IRR
- -17.4%
- Equity multiple
- 0.39×
- Total profit
- $-39,016
- Equity at exit
- $34,279
- IRR
- -12.9%
- Equity multiple
- 0.30×
- Total profit
- $-45,140
- Equity at exit
- $19,878
Cash invested: $64,372 (down + closing). Projections, not guarantees.
Landlord ↔ Tenant lean methodology
- Overall (STATE)
- 55 Moderately Landlord-Leaning
- State Virginia
- 55 Moderately Landlord-Leaning · D+2
- County
- — inherits STATE
- City
- — inherits STATE
ZIP-level market 24501
- Rents YoY
- 1.1%
- Active inventory
- 216
- Price-to-rent
- 10.9×
Monthly cashflow live
- Estimated rent
- $1,764 medium interval (Pro) →
- Mortgage (P&I)
- −$1,206
- Tax from tax record
- −$67 /mo · $810/yr
- Insurance
- −$96
- HOA
- −$0
- Vacancy / Maint / Mgmt
- −$370
- Net cashflow
- $25
Break-even live
UW: 25.0% down · 7.5% · 30yr · 1.5% tax · 5.0% vac · 8.0% maint · 8.0% mgmt
Financing live
Cash to close
- Down payment
- $57,475
- Closing costs
- $6,897
- Reserves months
- —
- Total cash needed
- —
Loan-product check · same deal, 3 products live
Conventional
25% down · 7.5% · 30yr
- Down + closing
- —
- Monthly P&I
- —
- Monthly cashflow
- —
- DSCR
- —
- Eligible?
- —
Personal DTI + credit; lowest rate.
DSCR
20% down · 8.5% · 30yr
- Down + closing
- —
- Monthly P&I
- —
- Monthly cashflow
- —
- DSCR
- —
- Eligible?
- —
No personal income docs; deal must DSCR.
Hard money
10% down · 12.0% · 12mo
- Down + closing
- —
- Monthly P&I
- —
- Monthly cashflow
- —
- DSCR
- —
- Eligible?
- —
Short-term bridge; refi at stabilization.
Listing history 33 events
-
2026-06-19days on market $229,900 Active 85 DOM
-
2026-06-18days on market $229,900 Active 84 DOM
-
2026-06-17days on market $229,900 Active 83 DOM
-
2026-06-16days on market $229,900 Active 82 DOM
-
2026-06-15days on market $229,900 Active 81 DOM
-
2026-06-14days on market $229,900 Active 79 DOM
-
2026-06-13days on market $229,900 Active 78 DOM
-
2026-06-10days on market $229,900 Active 76 DOM
-
2026-06-09days on market $229,900 Active 75 DOM
-
2026-06-08days on market $229,900 Active 74 DOM
-
2026-06-07days on market $229,900 Active 73 DOM
-
2026-06-03days on market $229,900 Active 69 DOM
-
2026-06-02days on market $229,900 Active 68 DOM
-
2026-06-01days on market $229,900 Active 67 DOM
-
2026-05-31days on market $229,900 Active 66 DOM
-
2026-05-30days on market $229,900 Active 65 DOM
-
2026-05-05price $216,900 263-char remark
Show marketing remark (263 chars)
A wonderful opportunity to provide the completion and design of this large 3 story home. Six bedrooms and 4 1/2 baths are possible with plenty of open space on the first floor. Great front and rear covered porches for relaxing. Large deck off the primary bedroom.
-
2026-04-27price $226,900 263-char remark
Show marketing remark (263 chars)
A wonderful opportunity to provide the completion and design of this large 3 story home. Six bedrooms and 4 1/2 baths are possible with plenty of open space on the first floor. Great front and rear covered porches for relaxing. Large deck off the primary bedroom.
-
2026-04-09price $229,600 263-char remark
Show marketing remark (263 chars)
A wonderful opportunity to provide the completion and design of this large 3 story home. Six bedrooms and 4 1/2 baths are possible with plenty of open space on the first floor. Great front and rear covered porches for relaxing. Large deck off the primary bedroom.
-
2026-03-25$229,900 Active 263-char remark
Show marketing remark (263 chars)
A wonderful opportunity to provide the completion and design of this large 3 story home. Six bedrooms and 4 1/2 baths are possible with plenty of open space on the first floor. Great front and rear covered porches for relaxing. Large deck off the primary bedroom.
-
2023-09-05soldstatus $9,000 Closed
-
2023-08-15soldstatus $9,000
-
2023-07-25status Pending
-
2023-06-29$9,900 Active
-
2019-11-20$9,900
-
2018-12-31historical
-
2017-12-04$13,900
-
2017-09-30historical
-
2016-09-21$13,900
-
2016-09-21$13,900
-
2013-06-06historical
-
2012-12-21$9,000
ⓘ Source: listings_history table (triggers on properties + properties_extension) + one-shot
backfill from property_details.listing_events for pre-trigger history.
Tax reassessment forecast VA · Resets to sale price
- Current annual tax
- $810 · $67/mo
- Projected year-2 tax
- $1,885 · $157/mo
- Expected delta
- +$1,075/yr (+$90/mo · 132.8%)
ⓘ Screening estimate from a state-policy table — verify with the county assessor before closing.
Climate risk First Street
- Flood 1/10 Low FEMA zone X (unshaded) · 0% chance over 30 yrs
- Wildfire 2/10 Low
- Heat 6/10 Major 7 d/yr ≥102°F today · 19 d/yr by 30 yrs out
- Wind 2/10 Low 2% chance of damaging wind over 30 yrs
- Air quality 2/10 Low 0 unhealthy d/yr today · 1 by 30 yrs out
Nearby sold comps map
Loading sold comps map…
Walkable amenities ~0.75 mi
Loading nearby amenities…
Taxation est. · year 1
- Rental income
- $21,168
- − Mortgage interest
- −$12,878
- − Property taxes
- −$810
- − Insurance
- −$1,150
- − Repairs & maintenance
- −$1,693
- − Management
- −$1,693
- − Depreciation
- −$6,688
- Taxable loss
- −$3,744
- Est. tax savings @ 24.0%
- +$899
- After-tax cash flow
- $1,195/yr
For passive investors: Depreciation is non-cash, so a rental often shows a tax loss while cash-flowing — sheltering income. Rental losses are passive: they offset passive income freely, and up to $25,000/yr can offset ordinary (W-2) income if you actively participate and your MAGI is under $100k (phasing out to $0 by $150k); unused losses carry forward. On sale, claimed depreciation is recaptured at up to 25%, and gains may owe capital-gains tax (a 1031 exchange can defer both). Figures are a year-1 estimate at your 24.0% rate — not tax advice; consult a CPA.
Schools (NCES district)
- District
- Lynchburg City Public School District
- NCES district ID
- 5102340
- Math proficiency
- 36% ▼ -38.00%
- Reading proficiency
- 61% ▼ -8.00%
- Median HH income
- $39,097
- Composite
- 40.4/100
- National rank
- #3730
- State rank
- #104 of 131 in VA
Livability — Lynchburg
- Score
- 91/100
- State rank
- #1
- US rank
- #58
Category grades
Schools grade is shown separately in the Schools card above.
Census & demographics
- Census place
- Lynchburg, VA
- County
- Lynchburg City · 97,036 people
- City population
- 97,036
- Metro
- Lynchburg, VA
- Population (ZIP)
- 25,006
- Household income
- $42,222
- Rent vs Own
- Severe rent burden
- 1717.0
Population outlook (Lynchburg County) Hauer SSP2
- Today (2025)
- 87,977 people
- By 2030
- 93,626 · +6.4%
- By 2040
- 106,145 · +20.7%
- By 2050
- 120,783 · +37.3%
- By 2075
- 162,249 · +84.4%
- By 2100
- 191,358 · +117.5%
Race, ethnicity, and origin ACS 2023
- Neighborhood character
- Diverse neighborhood (Simpson 0.55)
- Race & ethnicity
- White 58% Black 34% Two or more races 4% Hispanic / Latino 3%
- Common ancestry
- Slovak 1% Italian 1% Serbian 1%
- Foreign-born
- 3% · Canada
- Languages at home
- 96% English-only · Spanish 2%
Political lean MEDSL · Lynchburg
- 2024 margin
- Lean R (+7.9) · D 45.4% · R 53.3% · Other 1.3%
- 2008→2024 swing
- -3.9pp toward R · 2008: -4.0pp · 2024: -7.9pp
- All cycles
- 2024: R+7.9 2020: D+2.6 2016: R+9.0 2012: R+10.6 2008: R+4.0
Not yet ingested
- Civics
- —
Market trends
- HPI YoY
- ▼ -131.06%
- Current HPI
- 223.6839
- Rent YoY
- ▲ 1.15%
- Metro
- Lynchburg, VA
- State GDP YoY
- ▲ 2.40%
- F500 in state
- 50
Industry mix (Fortune 500 HQ in VA)
| Industry | F500 HQs | Revenue |
|---|---|---|
| Aerospace / Defense | 4 | $236B |
|
||
| Technology / Defense | 3 | $32B |
|
||
| Financial Services | 2 | $176B |
|
||
| Utilities | 2 | $27B |
|
||
| Insurance | 2 | $25B |
|
||
| Technology | 2 | $15B |
|
||
Price history
+2310.0% since first listed17 events — show timeline
- 2026-05-05 Price Changed $216,900 LMLS
- 2026-04-27 Price Changed $226,900 LMLS
- 2026-04-09 Price Changed $229,600 LMLS
- 2026-03-25 Listed $229,900 MLSRV
- 2026-03-25 Listed $229,900 LMLS
- 2023-09-05 Sold (MLS) $9,000 LMLS
- 2023-08-15 Sold (Public Records) $9,000 Public Records
- 2023-07-25 Pending — LMLS
- 2023-06-29 Listed $9,900 LMLS
- 2019-11-20 Listed $9,900 LMLS
- 2018-12-31 Listing Removed — MLSRV
- 2017-12-04 Listed $13,900 MLSRV
- 2017-09-30 Listing Removed — MLSRV
- 2016-09-21 Listed $13,900 MLSRV
- 2016-09-21 Listed $13,900 LMLS
- 2013-06-06 Listing Removed — MLSRV
- 2012-12-21 Listed $9,000 MLSRV
Property tax history
+21.7%/yrLatest (2025): $810 · +468.7% YoY. Source: county tax records.
Cash-flow waterfall
monthlySold comps — $/sqft
last 12 mo · ≤1 miLoading sold comps…