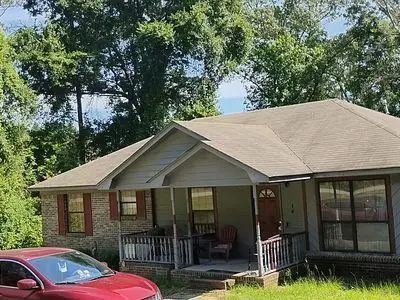
370 Saint Stephens Ave · Millry, AL
Flood risk 1/10 · Minimal
- FEMA flood zone
- X (unshaded)
- Chance of flooding over 30 yrs
- 0.0%
- Est. flood insurance / yr
- $507 – $1,088
Fire risk 3/10 · Minor
- Est. fire insurance / yr
- $916 – $1,700
Heat risk 7/10 · Major
- Hot days now (above 108°F)
- 7 days/yr
- Hot days in 30 yrs
- 21 days/yr
Wind risk 8/10 · Major
- Chance of severe wind over 30 yrs
- 98.0%
Air-quality risk 1/10 · Minimal
- Unhealthy air days now
- 0 days/yr
- Unhealthy air days in 30 yrs
- 0 days/yr
Risk factors via First Street. Map © Google.
Why this score? — see what drove the C+ grade
The composite is a weighted blend of 9 inputs, each scored 0–100. Each bar is that input's sub-score; the figure is the points it added to the 100-point composite (weight × sub-score).
- Cash flow +23.8/30.0
- DSCR +7.7/10.0
- ARV discount +7.5/15.0
- Appreciation +6.7/10.0
- 1% rule +6.2/10.0
- Livability +3.1/5.0
- Rent growth +2.5/5.0
- Schools +2.4/10.0
- Condition / age +1.0/5.0
$96,000
🖨 Deal sheet 📄 Offer letter ✓ Due diligence
Listing remarks
Need renovation inside water damage from plumbing and sewage pipes. Wall damage from termites and rodents from living in woodland area.
Key facts
- Built 1989
- Listed 15 days
Neighborhood map
What this means for you Summary
Snapshot
- This is a 4-bed/2.0-bath other listed at $96k. Condition is rated poor.
Deal economics
- At list price, monthly cash flow is $185 ($2k/yr) — positive.
- The deal already cash-flows at list — no discount required.
- Meets the 1% rule at list price ($1k rent vs $96k).
- Recommended offer: $95k (1.5% below list) — sets the bar for market timing.
Location & tenants
- Location reads 62/100 on livability (#221 in AL) — a middle-class / working-renter tenant base. Strengths: crime A+, cost of living A+, housing A+; Watch: employment D, schools F, amenities F.
- Washington County (rural): math 13% / reading 44% proficiency, ranked #76 of 129 in AL (top 59%) — low school quality limits family demand, transient renter base, plan for 1-2y turnover.
- Market conditions: 7 active listings in the ZIP.
Forward outlook
- In year one you build about $4k of equity ($664 loan paydown + $3k appreciation (3.5% local appreciation)).
- Washington County population projected at -22% by 2050 — secular population decline; favor cash flow + early exit over multi-decade hold.
- At projected returns (3.5% appreciation + 3.0% rent growth), your $27k cash investment doubles in ~4 years — after that, you're playing with house money.
- By year 9, paydown + projected appreciation supports a ~$34k cash-out refi (75% LTV) — recoverable capital for the next deal without selling this one.
Negotiation context
- It's been on market 16 days — a 2% lower offer ($95k) is reasonable based on typical stale-listing flexibility.
Risks & watch-outs
- Climate carrying-cost: severe wind risk, 98% chance of damaging wind over 30y; extreme-heat days projected 7→21/yr by 2055 (HVAC capex compounding) — expect insurance premiums to compound above CPI over the hold.
Questions for the listing agent
- Have any recent inspections been done? Can we get a copy of the seller's disclosures and any deferred-maintenance estimates?
- Is there a deadline driving the sale (1031 exchange, divorce, estate, relocation)? That informs how much negotiation room exists.
- Schools are F-rated, which usually means shorter tenancies and higher turnover. Who's the typical renter profile here, and what's been the actual vacancy rate?
- What's the average days-on-market for RENTAL listings here right now (not sales)? A rising rental-DOM trend means longer vacancies and softer asking-rent achievability than the comps imply.
- What's the recent tenant-quality profile in this submarket — average credit score on applications, eviction rate, late-payment / NSF rate, and stable-employment percentage? A property-management company in the area should have these aggregated.
- How much new for-sale + rental construction is in the pipeline within 1–3 miles? Heavy new supply typically softens prices + rents 12–24 months out; constrained supply supports both.
Investment metrics
- 1% rule
- 1.12% ✓
- Cap rate
- 8.60%
- Cash-on-cash
- 8.25%
- DSCR
- 1.37
- GRM
- 7.5
CMA / ARV
No comps found within radius.
Projected returns pro-forma
3.46% appreciation · 3.0% rent growth · sell at horizon
- IRR
- 16.3%
- Equity multiple
- 1.96×
- Total profit
- $25,687
- Equity at exit
- $45,654
- IRR
- 17.6%
- Equity multiple
- 3.68×
- Total profit
- $72,146
- Equity at exit
- $72,357
Cash invested: $26,880 (down + closing). Projections, not guarantees.
Landlord ↔ Tenant lean methodology
- Overall (STATE)
- 90 Strongly Landlord-Friendly
- State Alabama
- 90 Strongly Landlord-Friendly · R+15
- County
- — inherits STATE
- City
- — inherits STATE
ZIP-level market 36558
- Home prices YoY
- 2.3%
- Active inventory
- 7
- Price-to-rent
- 7.5×
Monthly cashflow live
- Estimated rent
- $1,074 medium interval (Pro) →
- Mortgage (P&I)
- −$503
- Tax est. 1.5%
- −$120 /mo · $1,440/yr
- Insurance
- −$40
- HOA
- −$0
- Vacancy / Maint / Mgmt
- −$225
- Net cashflow
- $185
Break-even live
UW: 25.0% down · 7.5% · 30yr · 1.5% tax · 5.0% vac · 8.0% maint · 8.0% mgmt
Financing live
Cash to close
- Down payment
- $24,000
- Closing costs
- $2,880
- Reserves months
- —
- Total cash needed
- —
Loan-product check · same deal, 3 products live
Conventional
25% down · 7.5% · 30yr
- Down + closing
- —
- Monthly P&I
- —
- Monthly cashflow
- —
- DSCR
- —
- Eligible?
- —
Personal DTI + credit; lowest rate.
DSCR
20% down · 8.5% · 30yr
- Down + closing
- —
- Monthly P&I
- —
- Monthly cashflow
- —
- DSCR
- —
- Eligible?
- —
No personal income docs; deal must DSCR.
Hard money
10% down · 12.0% · 12mo
- Down + closing
- —
- Monthly P&I
- —
- Monthly cashflow
- —
- DSCR
- —
- Eligible?
- —
Short-term bridge; refi at stabilization.
Listing history 13 events
-
2026-06-19days on market $96,000 Active 16 DOM
-
2026-06-18days on market $96,000 Active 15 DOM
-
2026-06-17days on market $96,000 Active 14 DOM
-
2026-06-16days on market $96,000 Active 13 DOM
-
2026-06-15days on market $96,000 Active 12 DOM
-
2026-06-14days on market $96,000 Active 10 DOM
-
2026-06-12days on market $96,000 Active 9 DOM
-
2026-06-09days on market $96,000 Active 6 DOM
-
2026-06-08days on market $96,000 Active 5 DOM
-
2026-06-07days on market $96,000 Active 4 DOM
-
2026-06-07days on market $96,000 Active 3 DOM
-
2026-06-04remarks 135-char remark
-
2026-06-04$96,000 Active 1 DOM
ⓘ Source: listings_history table (triggers on properties + properties_extension) + one-shot
backfill from property_details.listing_events for pre-trigger history.
Climate risk First Street
- Flood 1/10 Low FEMA zone X (unshaded) · 0% chance over 30 yrs
- Wildfire 3/10 Moderate
- Heat 7/10 Severe 7 d/yr ≥108°F today · 21 d/yr by 30 yrs out
- Wind 8/10 Severe 98% chance of damaging wind over 30 yrs
- Air quality 1/10 Low 0 unhealthy d/yr today · 0 by 30 yrs out
Nearby sold comps map
Loading sold comps map…
Walkable amenities ~0.75 mi
Loading nearby amenities…
Taxation est. · year 1
- Rental income
- $12,884
- − Mortgage interest
- −$5,377
- − Property taxes
- −$1,440
- − Insurance
- −$480
- − Repairs & maintenance
- −$1,031
- − Management
- −$1,031
- − Depreciation
- −$2,793
- Taxable income
- $732
- Est. tax owed @ 24.0%
- −$176
- After-tax cash flow
- $2,041/yr
For passive investors: Depreciation is non-cash, so a rental often shows a tax loss while cash-flowing — sheltering income. Rental losses are passive: they offset passive income freely, and up to $25,000/yr can offset ordinary (W-2) income if you actively participate and your MAGI is under $100k (phasing out to $0 by $150k); unused losses carry forward. On sale, claimed depreciation is recaptured at up to 25%, and gains may owe capital-gains tax (a 1031 exchange can defer both). Figures are a year-1 estimate at your 24.0% rate — not tax advice; consult a CPA.
Condition & rehab AI · 2 photos
This property requires extensive repairs, including a new roof and siding, and significant maintenance to improve its condition and value.
Repairs flagged
- Major roof — Significant damage visible from aerial view
- Major exterior siding — Weathered and in need of repair
Value-add opportunities
- Both repair and replace roof — Critical to safety and appearance
- Both repair and replace exterior siding — Improves curb appeal and structural integrity
- Both paint interior and exterior — Enhances curb appeal and interior aesthetics
Renovation cost estimate screening
| Repair item | Severity | Est. cost |
|---|---|---|
| roof · Significant damage visible from aerial view | Major | $15,000–50,000 |
| exterior siding · Weathered and in need of repair | Major | $15,000–50,000 |
| Total estimated repair cost · 2 items | $30,000–100,000 |
Value-add ROI direction
- Both repair and replace roof — Critical to safety and appearance ↑
- Both repair and replace exterior siding — Improves curb appeal and structural integrity ↑
- Both paint interior and exterior — Enhances curb appeal and interior aesthetics ↑
ⓘ Cost ranges are severity-bucket heuristics (US national rule-of-thumb). Get contractor quotes + a written scope before underwriting a rehab budget.
Schools (NCES district)
- District
- Washington County
- NCES district ID
- 0103480
- Math proficiency
- 13% ▼ -23.00%
- Reading proficiency
- 44% ▲ 1.00%
- Median HH income
- $40,168
- Composite
- 23.9/100
- National rank
- #7791
- State rank
- #76 of 129 in AL
Livability — Millry
- Score
- 62/100
- State rank
- #221
- US rank
- #16698
Category grades
Schools grade is shown separately in the Schools card above.
Census & demographics
- Census place
- Millry, AL
- City population
- 4,503
- Population (ZIP)
- 4,503
Population outlook (Washington County) Hauer SSP2
- Today (2025)
- 15,750 people
- By 2030
- 15,072 · -4.3%
- By 2040
- 13,638 · -13.4%
- By 2050
- 12,241 · -22.3%
- By 2075
- 9,825 · -37.6%
- By 2100
- 8,379 · -46.8%
Race, ethnicity, and origin ACS 2023
- Neighborhood character
- Predominantly White (71%)
- Race & ethnicity
- White 71% Black 17% Two or more races 8% Hispanic / Latino 5%
- Common ancestry
- Slovak 2%
- Foreign-born
- 1%
- Languages at home
- 99% English-only · German/W. Germanic 1%
Political lean MEDSL · Washington
- 2024 margin
- Solid R (+55.4) · D 22.1% · R 77.5%
- 2008→2024 swing
- -25.9pp toward R · 2008: -29.5pp · 2024: -55.4pp
- All cycles
- 2024: R+55.4 2020: R+48.5 2016: R+43.2 2012: R+31.7 2008: R+29.5
Not yet ingested
- Civics
- —
Market trends
- HPI YoY
- ▲ 3.46%
- Current HPI
- 154.1389
- Rent YoY
- —
- Metro
- —
- State GDP YoY
- ▲ 2.94%
- F500 in state
- 4
Industry mix (Fortune 500 HQ in AL)
| Industry | F500 HQs | Revenue |
|---|---|---|
| Financial Services | 1 | $8B |
|
||
| Healthcare | 1 | $5B |
|
||
Price history
1 event — show timeline
- 2026-06-04 Listed $96,000 FSBO.com
Cash-flow waterfall
monthlySold comps — $/sqft
last 12 mo · ≤1 miLoading sold comps…