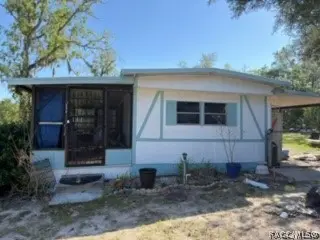
5276 W Oaklawn St · Homosassa Springs, FL
Flood risk 1/10 · Minimal
- FEMA flood zone
- X (unshaded)
- Chance of flooding over 30 yrs
- 0.0%
- Est. flood insurance / yr
- $507 – $1,088
Fire risk 5/10 · Moderate
- Est. fire insurance / yr
- $947 – $1,759
Heat risk 9/10 · Severe
- Hot days now (above 108°F)
- 7 days/yr
- Hot days in 30 yrs
- 22 days/yr
Wind risk 9/10 · Severe
- Chance of severe wind over 30 yrs
- 99.0%
Air-quality risk 1/10 · Minimal
- Unhealthy air days now
- 0 days/yr
- Unhealthy air days in 30 yrs
- 0 days/yr
Risk factors via First Street. Map © Google.
Why this score? — see what drove the B- grade
The composite is a weighted blend of 9 inputs, each scored 0–100. Each bar is that input's sub-score; the figure is the points it added to the 100-point composite (weight × sub-score).
- Cash flow +30.0/30.0
- DSCR +10.0/10.0
- 1% rule +8.5/10.0
- ARV discount +7.5/15.0
- Schools +4.1/10.0
- Livability +3.6/5.0
- Rent growth +2.5/5.0
- Condition / age +2.5/5.0
- Appreciation +0.0/10.0
$110,000
🖨 Deal sheet 📄 Offer letter ✓ Due diligence
Listing remarks
Affordable living in a great Homosassa location! This 2-bedroom, 1-bath single-wide home sits on a corner lot and offers a wonderful opportunity for a primary residence, seasonal retreat, or investment property. No kitchen cabinets but other features include a beautifully remodeled bathroom by West Shore, well and septic, and a fully fenced yard for added privacy and outdoor enjoyment. Located in a non-flood zone, this property offers both value and peace of mind. Don’t miss this great opportunity! ¡Vida asequible en una excelente ubicación en Homosassa! Esta casa móvil de una sola sección, con 2 habitaciones y 1 baño, se encuentra en un lote de esqu
Key facts
- Remodeled bathroom
- Non-flood zone
- Fully fenced yard
Tags
Property features AI
Exterior
- Parking: Private driveway (unpaved)
- Utilities: Private well water; Septic tank
- Home design: Manufactured home; Single wide; One story
- Construction: Metal roof
- Exterior features: Chain link fencing; Cleared lot; Private maintained road access; County and private road frontage
Interior
- Kitchen: Electric oven; Electric range; Refrigerator
- Bedrooms: Manufactured single-wide home (one level)
- Flooring: Laminate flooring
- Bathrooms: 1 full bathroom
- Heating & cooling: Central heating (electric); Central air conditioning
- Interior features: Electric oven; Electric range; Refrigerator
Neighborhood map
What this means for you Summary
Snapshot
- This is a 2-bed/1.0-bath manufactured listed at $110k.
Deal economics
- At list price, monthly cash flow is $510 ($6k/yr) — positive.
- The deal already cash-flows at list — no discount required.
- Meets the 1% rule at list price ($1k rent vs $110k).
- Recommended offer: $108k (1.5% below list) — sets the bar for market timing.
- Cap rate 11.9% vs local median 5.9% in Homosassa Springs — top-decile yield for the area; either an underpriced asset or a hidden risk that comps aren't pricing in. Stress-test before assuming the spread holds.
Location & tenants
- Location reads 71/100 on livability (#391 in FL) — a middle-class / working-renter tenant base. Strengths: cost of living A+, housing A+, health & safety A+; Watch: crime C-, amenities F, commute F.
- Citrus (rural): math 49% / reading 50% proficiency, ranked #44 of 73 in FL (top 60%) — families likely to look elsewhere, expect single-tenant / working-renter base with shorter leases.
- Zoned schools: Lecanto Primary School (math 55% / reading 53%, grade C, #936 of 2,144 statewide, top 44%, 820 students, 63% FRL); Lecanto Middle School (math 49% / reading 49%, grade C-, #265 of 571 statewide, top 48%, 809 students, 55% FRL); Lecanto High School (math 46% / reading 53%, grade D, #179 of 667 statewide, top 29%, 1,630 students, 46% FRL) — zoned schools at 54% FRL track the district average.
- Market conditions: 582 active listings in the ZIP; 2,443 units permitted in Citrus County in 2024 (0 in 5+ unit buildings).
- This rent runs 30% of the median local income ($59k/yr) — at the standard rent-burdened threshold; future hikes will face affordability resistance.
Forward outlook
- Local home prices are declining (-3.0%/yr); year-one equity from $761 of loan paydown is wiped out by about $3k of value loss. Plan a longer hold.
- Citrus County population projected to shrink 10% by 2050 — rents likely to lag national; underwrite the cash flow, not the appreciation.
- At projected returns (-3.0% appreciation + 3.0% rent growth), your $31k cash investment doubles in ~7 years — after that, you're playing with house money.
Negotiation context
- It's been on market 17 days — a 2% lower offer ($108k) is reasonable based on typical stale-listing flexibility.
- Current owner paid $70k; list at $110k implies a 57% gain — meaningful room to come down on a strong offer.
Risks & watch-outs
- Climate carrying-cost: severe wind risk, 99% chance of damaging wind over 30y; moderate wildfire risk; extreme-heat days projected 7→22/yr by 2055 (HVAC capex compounding) — expect insurance premiums to compound above CPI over the hold.
Questions for the listing agent
- Built in 1979 — when were the roof, HVAC, electrical panel, plumbing, and water heater last replaced?
- Is there a deadline driving the sale (1031 exchange, divorce, estate, relocation)? That informs how much negotiation room exists.
- Schools are F-rated, which usually means shorter tenancies and higher turnover. Who's the typical renter profile here, and what's been the actual vacancy rate?
- What's the average days-on-market for RENTAL listings here right now (not sales)? A rising rental-DOM trend means longer vacancies and softer asking-rent achievability than the comps imply.
- What's the recent tenant-quality profile in this submarket — average credit score on applications, eviction rate, late-payment / NSF rate, and stable-employment percentage? A property-management company in the area should have these aggregated.
- How much new for-sale + rental construction is in the pipeline within 1–3 miles? Heavy new supply typically softens prices + rents 12–24 months out; constrained supply supports both.
Investment metrics
- 1% rule
- 1.35% ✓
- Cap rate
- 11.86%
- Cash-on-cash
- 19.87%
- DSCR
- 1.88
- GRM
- 6.2
CMA / ARV
- ARV (on-the-fly)
- $63,336
- Comps found
- 7
Show comp detail 7 sales within ~0.75 mi
| Address | Dist | Beds/Ba | Sqft | Sold | Price | $/sf | Match |
|---|---|---|---|---|---|---|---|
| 5371 W Starburst Ln | 0.22mi | 2/1.0 | 728 (0%) | 3mo | $63,000 | $87 | 88 |
| 5175 W Winter Sun Ln | 0.31mi | 2/2.0 | 784 (+8%) | 1mo | $39,000 | $50 | 68 |
| 4939 W Foxhill Ln | 0.36mi | 2/1.5 | 784 (+8%) | 4mo | $140,000 | $179 | 66 |
| 5085 S Pastel Pt | 0.19mi | 2/1.5 | 784 (+8%) | 16mo | $103,000 | $131 | 63 |
| 5711 W Thomas Ct | 0.53mi | 2/1.0 | 784 (+8%) | 6mo | $29,000 | $37 | 57 |
| 5407 W Richland Ln | 0.39mi | 3/2.0 (+1) | 784 (+8%) | 5mo | $53,000 | $68 | 56 |
| 5442 S Oldfield Ave | 0.33mi | 2/1.0 | 672 (-8%) | 23mo | $80,000 | $119 | 53 |
Match score weights: distance 35% · size 25% · config 20% · recency 20%. Top-matched comps best support the ARV.
Projected returns pro-forma
-3.0% appreciation · 3.0% rent growth · sell at horizon
- IRR
- 12.0%
- Equity multiple
- 1.47×
- Total profit
- $14,613
- Equity at exit
- $16,401
- IRR
- 20.9%
- Equity multiple
- 2.77×
- Total profit
- $54,388
- Equity at exit
- $9,511
Cash invested: $30,800 (down + closing). Projections, not guarantees.
Landlord ↔ Tenant lean methodology
- Overall (STATE)
- 87 Strongly Landlord-Friendly
- State Florida
- 87 Strongly Landlord-Friendly · R+3
- County
- — inherits STATE
- City
- — inherits STATE
ZIP-level market 34446
- Home prices YoY
- -10.4%
- Active inventory
- 582
- Price-to-rent
- 6.2×
Monthly cashflow live
- Estimated rent
- $1,483 medium interval (Pro) →
- Mortgage (P&I)
- −$577
- Tax from tax record
- −$39 /mo · $465/yr
- Insurance
- −$46
- HOA
- −$0
- Vacancy / Maint / Mgmt
- −$311
- Net cashflow
- $510
Break-even live
UW: 25.0% down · 7.5% · 30yr · 1.5% tax · 5.0% vac · 8.0% maint · 8.0% mgmt
Financing live
Cash to close
- Down payment
- $27,500
- Closing costs
- $3,300
- Reserves months
- —
- Total cash needed
- —
Loan-product check · same deal, 3 products live
Conventional
25% down · 7.5% · 30yr
- Down + closing
- —
- Monthly P&I
- —
- Monthly cashflow
- —
- DSCR
- —
- Eligible?
- —
Personal DTI + credit; lowest rate.
DSCR
20% down · 8.5% · 30yr
- Down + closing
- —
- Monthly P&I
- —
- Monthly cashflow
- —
- DSCR
- —
- Eligible?
- —
No personal income docs; deal must DSCR.
Hard money
10% down · 12.0% · 12mo
- Down + closing
- —
- Monthly P&I
- —
- Monthly cashflow
- —
- DSCR
- —
- Eligible?
- —
Short-term bridge; refi at stabilization.
Listing history 13 events
-
2026-06-19days on market $110,000 Active 17 DOM
-
2026-06-18days on market $110,000 Active 16 DOM
-
2026-06-17days on market $110,000 Active 15 DOM
-
2026-06-16days on market $110,000 Active 14 DOM
-
2026-06-15days on market $110,000 Active 13 DOM
-
2026-06-14days on market $110,000 Active 11 DOM
-
2026-06-13days on market $110,000 Active 10 DOM
-
2026-06-10days on market $110,000 Active 8 DOM
-
2026-06-09days on market $110,000 Active 7 DOM
-
2026-06-08days on market $110,000 Active 6 DOM
-
2026-06-07days on market $110,000 Active 5 DOM
-
2026-06-03remarks 659-char remark
-
2026-06-03$110,000 Active 1 DOM
ⓘ Source: listings_history table (triggers on properties + properties_extension) + one-shot
backfill from property_details.listing_events for pre-trigger history.
Tax reassessment forecast FL · Resets to sale price
- Current annual tax
- $465 · $39/mo
- Projected year-2 tax
- $913 · $76/mo
- Expected delta
- +$448/yr (+$37/mo · 96.5%)
ⓘ Screening estimate from a state-policy table — verify with the county assessor before closing.
Climate risk First Street
- Flood 1/10 Low FEMA zone X (unshaded) · 0% chance over 30 yrs
- Wildfire 5/10 Major
- Heat 9/10 Extreme 7 d/yr ≥108°F today · 22 d/yr by 30 yrs out
- Wind 9/10 Extreme 99% chance of damaging wind over 30 yrs
- Air quality 1/10 Low 0 unhealthy d/yr today · 0 by 30 yrs out
Nearby sold comps map
Loading sold comps map…
Walkable amenities ~0.75 mi
Loading nearby amenities…
Taxation est. · year 1
- Rental income
- $17,792
- − Mortgage interest
- −$6,162
- − Property taxes
- −$465
- − Insurance
- −$550
- − Repairs & maintenance
- −$1,423
- − Management
- −$1,423
- − Depreciation
- −$3,200
- Taxable income
- $4,569
- Est. tax owed @ 24.0%
- −$1,097
- After-tax cash flow
- $5,022/yr
For passive investors: Depreciation is non-cash, so a rental often shows a tax loss while cash-flowing — sheltering income. Rental losses are passive: they offset passive income freely, and up to $25,000/yr can offset ordinary (W-2) income if you actively participate and your MAGI is under $100k (phasing out to $0 by $150k); unused losses carry forward. On sale, claimed depreciation is recaptured at up to 25%, and gains may owe capital-gains tax (a 1031 exchange can defer both). Figures are a year-1 estimate at your 24.0% rate — not tax advice; consult a CPA.
Schools (NCES district)
- District
- Citrus
- NCES district ID
- 1200270
- Math proficiency
- 49% ▼ -10.00%
- Reading proficiency
- 50% ▼ -6.00%
- Median HH income
- $38,618
- Composite
- 41.28/100
- National rank
- #3519
- State rank
- #44 of 73 in FL
Livability — Homosassa Springs
- Score
- 71/100
- State rank
- #391
- US rank
- #6877
Category grades
Schools grade is shown separately in the Schools card above.
Census & demographics
- Census place
- Homosassa Springs, FL
- County
- Citrus County · 111,314 people
- Metro
- Homosassa Springs, FL
- Population (ZIP)
- 19,102
- Household income
- $58,802
- Rent vs Own
- Severe rent burden
- 121.0
Population outlook (Citrus County) Hauer SSP2
- Today (2025)
- 138,622 people
- By 2030
- 136,886 · -1.3%
- By 2040
- 132,009 · -4.8%
- By 2050
- 125,196 · -9.7%
- By 2075
- 108,570 · -21.7%
- By 2100
- 84,454 · -39.1%
Race, ethnicity, and origin ACS 2023
- Neighborhood character
- Predominantly White (87%)
- Race & ethnicity
- White 87% Two or more races 8% Hispanic / Latino 6%
- Hispanic origin (detail)
- Mexican 2% Puerto Rican 3%
- Common ancestry
- Romanian 4% Lithuanian 4% Slovak 3%
- Foreign-born
- 5% · Canada
- Languages at home
- 95% English-only · Spanish 4%
Political lean MEDSL · Citrus
- 2024 margin
- Solid R (+45.9) · D 26.8% · R 72.6%
- 2008→2024 swing
- -29.8pp toward R · 2008: -16.1pp · 2024: -45.9pp
- All cycles
- 2024: R+45.9 2020: R+41.0 2016: R+39.7 2012: R+21.9 2008: R+16.1
Not yet ingested
- Civics
- —
Market trends
- HPI YoY
- ▼ -32.11%
- Current HPI
- 277.2576
- Rent YoY
- —
- Metro
- Homosassa Springs, FL
- State GDP YoY
- ▲ 3.28%
- F500 in state
- 36
Industry mix (Fortune 500 HQ in FL)
| Industry | F500 HQs | Revenue |
|---|---|---|
| Industrial Technology | 2 | $29B |
|
||
| Insurance | 2 | $17B |
|
||
| Retail | 1 | $60B |
|
||
| Technology Distribution | 1 | $58B |
|
||
| Homebuilding | 1 | $35B |
|
||
| Technology Manufacturing | 1 | $35B |
|
||
Price history
+587.5% since first listed4 events — show timeline
- 2026-06-02 Listed $110,000 RACC
- 2021-12-21 Sold (Public Records) $70,000 Public Records
- 1986-12-01 Sold (Public Records) $17,600 Public Records
- 1985-02-01 Sold (Public Records) $16,000 Public Records
Property tax history
+18.2%/yrLatest (2025): $465 · +16.7% YoY. Source: county tax records.
Cash-flow waterfall
monthlySold comps — $/sqft
last 12 mo · ≤1 miLoading sold comps…