 11-Plex
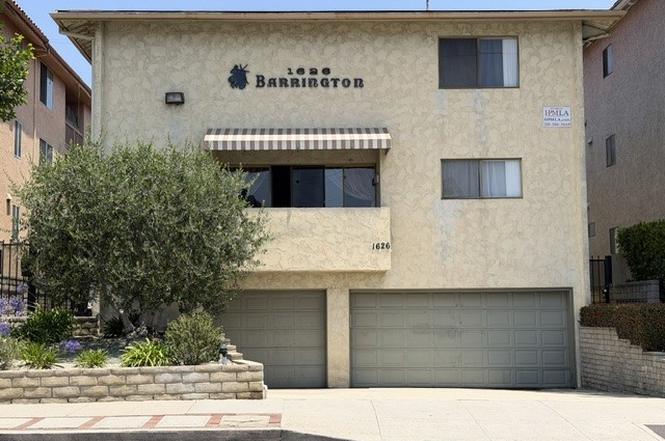
1626 S Barrington · Los Angeles, CA
Flood risk 8/10 · Major
- FEMA flood zone
- X (unshaded)
- Chance of flooding over 30 yrs
- 0.99%
- Est. flood insurance / yr
- $507 – $1,088
Fire risk 1/10 · Minimal
- Est. fire insurance / yr
- $659 – $1,223
Heat risk 6/10 · Moderate
- Hot days now (above 85°F)
- 7 days/yr
- Hot days in 30 yrs
- 21 days/yr
Wind risk 1/10 · Minimal
- Chance of severe wind over 30 yrs
- —
Air-quality risk 4/10 · Minor
- Unhealthy air days now
- 5 days/yr
- Unhealthy air days in 30 yrs
- 6 days/yr
Risk factors via First Street. Map © Google.
Why this score? — see what drove the B grade
The composite is a weighted blend of 9 inputs, each scored 0–100. Each bar is that input's sub-score; the figure is the points it added to the 100-point composite (weight × sub-score).
- Cash flow +30.0/30.0
- 1% rule +10.0/10.0
- DSCR +10.0/10.0
- ARV discount +8.0/15.0
- Appreciation +4.5/10.0
- Schools +3.6/10.0
- Livability +3.4/5.0
- Condition / age +2.5/5.0
- Rent growth +2.4/5.0
$2,950,000
🖨 Deal sheet (PDF) 📄 Offer letter ✓ Due diligence
Multi-family units
County records classify this as Multi-Family (5+ Unit). Listing-text estimate: 11 units. confirmed
5+ unit building — per-unit beds/baths from public records are typically unavailable; the breakdown below (if shown) is an estimate from the listing text.
Listing remarks
We are pleased to present 1626 S. Barrington Avenue, an exceptional 11-unit apartment building situated in one of West Los Angeles' most desirable and sought-after rental neighborhoods. This professionally managed asset reflects long-term ownership and pride of stewardship, making it an ideal addition to any multifamily investment portfolio. Constructed in 1969, the property features a well-balanced unit mix consisting of six one-bedroom units, three studio units, one two-bedroom unit, and a spacious townhouse-style front unit offering three bedrooms, three bathrooms, and in-unit laundry. This diverse configuration appeals to a broad tenant base and provides for minimal vacancy. The majorit
Key facts
- Gated parking
- Bike storage
- 6,352 sq ft lot
Tags
Property features AI
Finance
- Other: Number of buildings: 1; No ADU
- Financial info: Total building area listed as 7,900; Total number of units: 11; Gross scheduled income: $245,081; Gross income: $245,081; Net operating income: $150,861; Gross multiplier: 12; Operating expenses: $94,220; Other expenses: $4,294 (misc); Total expenses: $64,716; Expenses include insurance $11,460; maintenance $14,630; water/sewer $9,260; trash $6,874; pest control $1,335; fuel $1,063; Tenants pay electricity
- HOA & community: Community features include street lighting and sidewalks; Property is subject to rent control
Exterior
- Parking: Total 3 parking spaces; Assigned parking; Garage spaces: 3 (distribution includes 1, 1, and 1 for some unit types; additional listing indicates 6 garage spaces referenced for one unit type)
- Utilities: Public sewer; District/public water; Electricity available; One separate water meter, one separate gas meter, nine separate electric meters
- Home design: Attached multi-unit property; Two-story building; Flat roof
- Construction: Year built source: Assessor
- Exterior features: Block wall fencing; No pool
Interior
- Kitchen: No appliance details provided
- Bedrooms: One 1-bed units (total 6 units of this type); One 2-bed unit; One 3-bed unit
- Bathrooms: Multiple 1-bath units; One unit with 3 bathrooms (2 full, 1 half)
- Heating & cooling: Radiant heating; Wall/window cooling units (several wall AC units)
- Interior features: Two levels; Entry on level 1
- Laundry & utility: Community laundry
Neighborhood map
What this means for you Summary
Snapshot
- This is a 11 × 11-bed/12.5-bath units multifamily listed at $2.95M.
Deal economics
- At list price, monthly cash flow is $17k ($203k/yr) — positive. Per door: $2k/mo.
- The deal already cash-flows at list — no discount required.
- Meets the 1% rule at list price ($44k rent vs $2.95M).
- Cap rate 13.2% vs local median 2.1% in Los Angeles — top-decile yield for the area; either an underpriced asset or a hidden risk that comps aren't pricing in. Stress-test before assuming the spread holds.
Location & tenants
- Location reads 68/100 on livability (#273 in CA) — a middle-class / working-renter tenant base. Strengths: amenities A+, commute A+, employment B; Watch: health & safety C-, schools D+, crime F.
- Los Angeles Unified (urban): math 29% / reading 54% proficiency, ranked #223 of 517 in CA (top 43%) — families likely to look elsewhere, expect single-tenant / working-renter base with shorter leases; 67% free/reduced lunch — lower-income household profile, screen leases tightly.
- Market conditions: Rents soft (-0.4%/yr); 158 active listings in the ZIP; solid renter incomes; 19,697 units permitted in Los Angeles County in 2024 (9,426 in 5+ unit buildings).
- At $44,444/mo this rent would consume 513% of the median local household income ($104k/yr) (locally 4925% of renters already pay >50% of income on rent) — very limited rent-growth headroom before tenants either downsize or default.
Forward outlook
- Local home prices are declining (-1.0%/yr); year-one equity from $20k of loan paydown is wiped out by about $30k of value loss. Plan a longer hold.
- Los Angeles County population projected at +9% by 2050 — modest demand growth; plan on rents tracking national, not racing it.
- At projected returns (-1.0% appreciation + 0.0% rent growth), your $826k cash investment doubles in ~5 years — after that, you're playing with house money.
Negotiation context
- Only 4 days on market — expect competitive offers; lowballing is unlikely to land.
- Current owner paid $770k; list at $2.95M implies a 283% gain — meaningful room to come down on a strong offer.
Risks & watch-outs
- Watch-outs: flood insurance adds $66/mo.
- Climate carrying-cost: severe flood risk; extreme-heat days projected 7→21/yr by 2055 (HVAC capex compounding) — expect insurance premiums to compound above CPI over the hold.
Questions for the listing agent
- Can we see the unit-by-unit rent roll, current vacancy, and any below-market leases? What's the average tenancy length?
- What capital expenditures (roof, boiler, parking lot, exteriors) have been made in the last 5 years, and what's planned in the next 2?
- Built in 1969 — when were the roof, HVAC, electrical panel, plumbing, and water heater last replaced?
- What's the actual annual flood-insurance premium (NFIP or private), and is the property in a SFHA with mandatory coverage?
- Is there a deadline driving the sale (1031 exchange, divorce, estate, relocation)? That informs how much negotiation room exists.
- Schools are D-rated, which usually means shorter tenancies and higher turnover. Who's the typical renter profile here, and what's been the actual vacancy rate?
- Crime grade is F in this area — have there been break-ins, vandalism, or insurance claims at this property in the last 3 years? What carrier currently insures it and at what premium?
- What's the average days-on-market for RENTAL listings here right now (not sales)? A rising rental-DOM trend means longer vacancies and softer asking-rent achievability than the comps imply.
- What's the recent tenant-quality profile in this submarket — average credit score on applications, eviction rate, late-payment / NSF rate, and stable-employment percentage? A property-management company in the area should have these aggregated.
- How much new apartment / multifamily construction is in the pipeline within 1–3 miles? Heavy new supply (>2% of stock underway) typically softens rents 12–24 months out; light construction supports rent growth.
Investment metrics
- 1% rule
- 1.51% ✓
- Cap rate
- 13.22%
- Cash-on-cash
- 24.72%
- DSCR
- 2.10
- GRM
- 5.5
CMA / ARV
- ARV (on-the-fly)
- $2,986,200
- Comps found
- 2
Show comp detail 2 sales within ~0.75 mi
| Address | Dist | Beds/Ba | Sqft | Sold | Price | $/sf | Match |
|---|---|---|---|---|---|---|---|
| 1738 Colby Ave | 0.24mi | 10/12.0 (+1) | 7,055 (-11%) | 12mo | $2,550,000 | $361 | 56 |
| 11755 Nebraska Ave | 0.19mi | 10/10.0 (+1) | 7,014 (-11%) | 20mo | $2,650,000 | $378 | 43 |
Match score weights: distance 35% · size 25% · config 20% · recency 20%. Top-matched comps best support the ARV.
Projected returns pro-forma
-1.03% appreciation · 0.0% rent growth · sell at horizon
- IRR
- 19.8%
- Equity multiple
- 1.87×
- Total profit
- $722,439
- Equity at exit
- $707,620
- IRR
- 23.4%
- Equity multiple
- 3.12×
- Total profit
- $1,749,150
- Equity at exit
- $739,246
Cash invested: $826,000 (down + closing). Projections, not guarantees.
Landlord ↔ Tenant lean methodology
- Overall (CITY)
- 0 Strongly Tenant-Friendly
- State California
- 18 Strongly Tenant-Friendly · D+13
- County
- — inherits STATE
- City Los Angeles
- 0 Strongly Tenant-Friendly · D+22
ZIP-level market 90025
- Home prices YoY
- -0.3%
- Rents YoY
- -0.4%
- Active inventory
- 158
- Price-to-rent
- 60.8×
Monthly cashflow live
- Estimated rent
- $44,444 medium interval (Pro) →
- Mortgage (P&I)
- −$15,470
- Tax from tax record
- −$1,393 /mo · $16,710/yr
- Insurance
- −$1,229
- Flood insurance flood zone
- −$66 /mo · $798/yr
- HOA
- −$0
- Vacancy / Maint / Mgmt
- −$9,333
- Net cashflow
- $16,952
Break-even live
Sensitivity live
| Price | -10% $18,622 | -5% $17,787 | +0% $16,952 | +5% $16,118 | +10% $15,283 |
|---|---|---|---|---|---|
| Rent | -10% $13,441 | -5% $15,197 | +0% $16,952 | +5% $18,708 | +10% $20,464 |
| Rate | -1.0pp $18,438 | -0.5pp $17,703 | base $16,952 | +0.5pp $16,188 | +1.0pp $15,410 |
11-unit breakdown (identical units grouped — click to expand)
| Units | Beds | Baths | Est. rent |
|---|---|---|---|
| 11× units | 11 | 12.5 | $44,440 |
| #1 | 11 | 12.5 | $4,040 |
| #2 | 11 | 12.5 | $4,040 |
| #3 | 11 | 12.5 | $4,040 |
| #4 | 11 | 12.5 | $4,040 |
| #5 | 11 | 12.5 | $4,040 |
| #6 | 11 | 12.5 | $4,040 |
| #7 | 11 | 12.5 | $4,040 |
| #8 | 11 | 12.5 | $4,040 |
| #9 | 11 | 12.5 | $4,040 |
| #10 | 11 | 12.5 | $4,040 |
| #11 | 11 | 12.5 | $4,040 |
| Total (11 units) | $44,444 | ||
UW: 25.0% down · 7.5% · 30yr · 1.5% tax · 5.0% vac · 8.0% maint · 8.0% mgmt
Financing live
Cash to close
- Down payment
- $737,500
- Closing costs
- $88,500
- Reserves months
- —
- Total cash needed
- —
Loan-product check · same deal, 3 products live
Conventional
25% down · 7.5% · 30yr
- Down + closing
- —
- Monthly P&I
- —
- Monthly cashflow
- —
- DSCR
- —
- Eligible?
- —
Personal DTI + credit; lowest rate.
DSCR
20% down · 8.5% · 30yr
- Down + closing
- —
- Monthly P&I
- —
- Monthly cashflow
- —
- DSCR
- —
- Eligible?
- —
No personal income docs; deal must DSCR.
Hard money
10% down · 12.0% · 12mo
- Down + closing
- —
- Monthly P&I
- —
- Monthly cashflow
- —
- DSCR
- —
- Eligible?
- —
Short-term bridge; refi at stabilization.
Listing history 3 events
-
2026-06-21days on market $2,950,000 Active 4 DOM
-
2026-06-17remarks 699-char remark
-
2026-06-17$2,950,000 Active 1 DOM
ⓘ Source: listings_history table (triggers on properties + properties_extension) + one-shot
backfill from property_details.listing_events for pre-trigger history.
Tax reassessment forecast CA · Resets to sale price
- Current annual tax
- $16,710 · $1,393/mo
- Projected year-2 tax
- $22,420 · $1,868/mo
- Expected delta
- +$5,710/yr (+$476/mo · 34.2%)
ⓘ Screening estimate from a state-policy table — verify with the county assessor before closing.
Climate risk First Street
- Flood 8/10 Severe FEMA zone X (unshaded) · 99% chance over 30 yrs
- Wildfire 1/10 Low
- Heat 6/10 Major 7 d/yr ≥85°F today · 21 d/yr by 30 yrs out
- Wind 1/10 Low
- Air quality 4/10 Moderate 5 unhealthy d/yr today · 6 by 30 yrs out
Nearby sold comps map
Loading sold comps map…
Walkable amenities ~0.75 mi
Loading nearby amenities…
Taxation est. · year 1
- Rental income
- $533,328
- − Mortgage interest
- −$165,246
- − Property taxes
- −$16,710
- − Insurance
- −$15,548
- − Repairs & maintenance
- −$42,666
- − Management
- −$42,666
- − Depreciation
- −$85,818
- Taxable income
- $164,674
- Est. tax owed @ 24.0%
- −$39,522
- After-tax cash flow
- $163,908/yr
For passive investors: Depreciation is non-cash, so a rental often shows a tax loss while cash-flowing — sheltering income. Rental losses are passive: they offset passive income freely, and up to $25,000/yr can offset ordinary (W-2) income if you actively participate and your MAGI is under $100k (phasing out to $0 by $150k); unused losses carry forward. On sale, claimed depreciation is recaptured at up to 25%, and gains may owe capital-gains tax (a 1031 exchange can defer both). Figures are a year-1 estimate at your 24.0% rate — not tax advice; consult a CPA.
Schools (NCES district)
- District
- Los Angeles Unified
- NCES district ID
- 0622710
- Math proficiency
- 29% ▼ -4.00%
- Reading proficiency
- 54% ▲ 10.00%
- Median HH income
- $50,403
- Composite
- 35.67/100
- National rank
- #4875
- State rank
- #223 of 517 in CA
Livability — Los Angeles
- Score
- 68/100
- State rank
- #273
- US rank
- #9237
Category grades
Schools grade is shown separately in the Schools card above.
Census & demographics
- Census place
- Los Angeles, CA
- County
- Los Angeles County · 9,444,647 people
- City population
- 3,838,149
- Metro
- Los Angeles-Long Beach-Anaheim, CA
- Population (ZIP)
- 46,508
- Household income
- $103,894
- Rent vs Own
- Severe rent burden
- 4925.0
Population outlook (Los Angeles County) Hauer SSP2
- Today (2025)
- 10,940,515 people
- By 2030
- 11,256,481 · +2.9%
- By 2040
- 11,729,929 · +7.2%
- By 2050
- 11,948,407 · +9.2%
- By 2075
- 11,818,114 · +8.0%
- By 2100
- 10,842,928 · -0.9%
Race, ethnicity, and origin ACS 2023
- Neighborhood character
- Diverse neighborhood (Simpson 0.64)
- Race & ethnicity
- White 54% Asian 21% Hispanic / Latino 15% Two or more races 10% Black 4%
- Hispanic origin (detail)
- Mexican 10%
- Common ancestry
- Scotch-Irish 4% Italian 4% Lithuanian 3%
- Foreign-born
- 32% · Canada, China, South Korea
- Languages at home
- 61% English-only · Spanish 11% Other Indo-European 10% Chinese 5%
Political lean MEDSL · Los Angeles
- 2024 margin
- Solid D (+32.9) · D 64.8% · R 31.9% · Other 3.3%
- 2008→2024 swing
- -7.4pp toward R · 2008: 40.4pp · 2024: 32.9pp
- All cycles
- 2024: D+32.9 2020: D+44.2 2016: D+48.0 2012: D+40.0 2008: D+40.4
Not yet ingested
- Civics
- —
Market trends
- HPI YoY
- ▼ -1.03%
- Current HPI
- 312.7694
- Rent YoY
- ▼ -0.39%
- Metro
- Los Angeles-Long Beach-Anaheim, CA
- State GDP YoY
- ▲ 3.21%
- F500 in state
- 116
Industry mix (Fortune 500 HQ in CA)
| Industry | F500 HQs | Revenue |
|---|---|---|
| Technology | 27 | $1,492B |
|
||
| Financial Services | 3 | $174B |
|
||
| Retail | 3 | $44B |
|
||
| Insurance | 3 | $26B |
|
||
| Media / Entertainment | 2 | $115B |
|
||
| Pharmaceuticals / Biotech | 2 | $62B |
|
||
Price history
+283.1% since first listed2 events — show timeline
- 2026-06-17 Listed $2,950,000 CRMLS
- 1994-07-29 Sold (Public Records) $770,000 Public Records
Property tax history
+1.7%/yrLatest (2025): $16,710 · +1.6% YoY. Source: county tax records.
Cash-flow waterfall
monthlySold comps — $/sqft
last 12 mo · ≤1 miLoading sold comps…