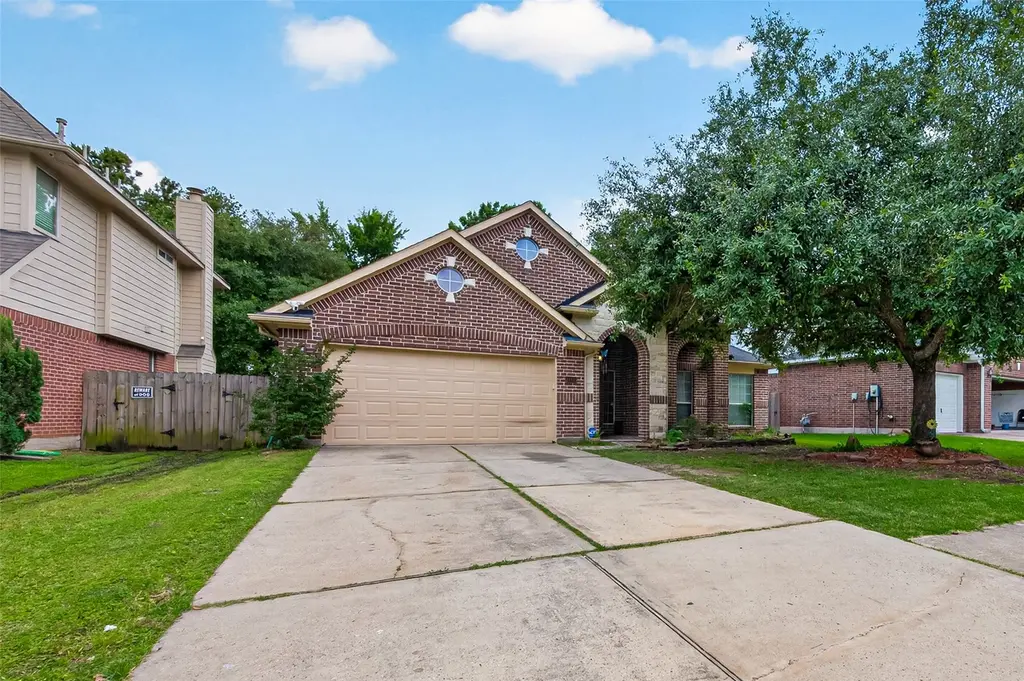
14415 Red Mulberry Ln · Houston, TX
Flood risk 1/10 · Minimal
- FEMA flood zone
- X (unshaded)
- Chance of flooding over 30 yrs
- 0.0%
- Est. flood insurance / yr
- $507 – $1,088
Fire risk 3/10 · Minor
- Est. fire insurance / yr
- $1,222 – $2,270
Heat risk 9/10 · Severe
- Hot days now (above 111°F)
- 7 days/yr
- Hot days in 30 yrs
- 24 days/yr
Wind risk 9/10 · Severe
- Chance of severe wind over 30 yrs
- 99.0%
Air-quality risk 3/10 · Minor
- Unhealthy air days now
- 2 days/yr
- Unhealthy air days in 30 yrs
- 3 days/yr
Risk factors via First Street. Map © Google.
Why this score? — see what drove the D+ grade
The composite is a weighted blend of 9 inputs, each scored 0–100. Each bar is that input's sub-score; the figure is the points it added to the 100-point composite (weight × sub-score).
- ARV discount +14.6/15.0
- Cash flow +10.5/30.0
- 1% rule +4.7/10.0
- Appreciation +4.2/10.0
- Schools +3.9/10.0
- Livability +3.7/5.0
- DSCR +3.0/10.0
- Rent growth +2.7/5.0
- Condition / age +2.5/5.0
$270,000
🖨 Deal sheet 📄 Offer letter ✓ Due diligence
Listing remarks
This 2,404 sq ft, 4-bedroom, 2-bathroom home offers a solid footprint in an established Houston community. The property is being sold as-is and presents an excellent opportunity for buyers looking to customize and add value. With some TLC and personal touches, this property has strong potential. Sold as-is at a price that reflects the opportunity.
Key facts
- 6,791 sq ft lot
- 2 garage spots
- Built 2002
Property features AI
Finance
- HOA & community: Community managed by Chaparral Management; Annual association fee; Community amenities: clubhouse, picnic area, playground
Exterior
- Parking: Attached garage (2 spaces)
- Security: Smoke detectors
- Utilities: Public water; Public sewer
- Home design: Residential property; Single-story (entry level: first floor)
- Construction: Built in 2002; Brick, cement siding, and stone exterior; Composition roof; Slab foundation
- Exterior features: Deck; Patio; Fully fenced backyard; Back yard fencing; Pond on lot; Subdivision setting
Interior
- Kitchen: Dishwasher; Gas range; Microwave; Oven
- Bedrooms: Primary bedroom on the first floor (approx. 14 x 17); Bedroom on the first floor (approx. 11 x 13); Bedroom on the first floor (approx. 11 x 11); Bedroom on the first floor (approx. 11 x 11)
- Flooring: Carpet; Concrete; Tile
- Bathrooms: 2 full bathrooms
- Heating & cooling: Central heating (gas); Central electric air conditioning
- Interior features: Breakfast bar; Crown molding; Double vanity; Pantry; Soaking tub; Separate shower; Ceiling fans; One fireplace
- Laundry & utility: Washer hookup; Gas dryer hookup
Neighborhood map
What this means for you Summary
Snapshot
- This is a 3-bed/1.5-bath single-family listed at $270k.
Deal economics
- At list price, monthly cash flow is $-137 ($-2k/yr) — negative.
- To cash-flow at today's rent, offer at most $246k (9.0% below list).
- To meet the 1% rule (rent ≥ 1% of price), the offer needs to be $263k (2.8% below list).
- Recommended offer: $246k (9.0% below list) — sets the bar for cash-flow.
- Cap rate 5.7% vs local median 3.2% in Houston — top-decile yield for the area; either an underpriced asset or a hidden risk that comps aren't pricing in. Stress-test before assuming the spread holds.
Location & tenants
- Location reads 74/100 on livability (#184 in TX, #4,771 nationally) — a middle-class / working-renter tenant base. Strengths: amenities A+, cost of living A+, housing A+; Watch: crime F.
- Humble ISD (urban): math 38% / reading 44% proficiency, ranked #262 of 826 in TX (top 32%) — families likely to look elsewhere, expect single-tenant / working-renter base with shorter leases.
- Zoned schools: Centennial El (math 43% / reading 47%, grade D-, #1,133 of 4,322 statewide, top 27%, 858 students, 38% FRL); Summer Creek H S (math 33% / reading 48%, grade F, #798 of 1,632 statewide, top 49%, 3,600 students, 45% FRL).
- Market conditions: Rents flat; 337 active listings in the ZIP; 6 comparable units currently listed for rent nearby; rentals leasing fast (median 5d on market — plan ~1-2 weeks tenant-placement turnaround); solid renter incomes; 29,883 units permitted in Harris County in 2024 (8,621 in 5+ unit buildings).
- This rent runs 33% of the median local income ($95k/yr) — at the standard rent-burdened threshold; future hikes will face affordability resistance.
Forward outlook
- Local home prices are declining (-1.6%/yr); year-one equity from $2k of loan paydown is wiped out by about $4k of value loss. Plan a longer hold.
- Harris County population projected at +47% by 2050 — long-run rental-demand tailwind backs the buy-and-hold thesis.
Negotiation context
- It's been on market 35 days — a 3% lower offer ($262k) is reasonable based on typical stale-listing flexibility.
- 6 sale attempts since 22y ago with the ask held roughly flat each time — persistent listings suggest the price (not the market) is what's stuck; bring a comps-based counter.
Risks & watch-outs
- Watch-outs: property tax is 2.7% of price.
- Climate carrying-cost: severe wind risk, 99% chance of damaging wind over 30y; extreme-heat days projected 7→24/yr by 2055 (HVAC capex compounding) — expect insurance premiums to compound above CPI over the hold.
Questions for the listing agent
- What do current leases actually rent for vs. the listed asking? Can we see a recent rent roll and the last 12 months of T-12 income?
- It's been on market 35 days. Have you received any prior offers? Is the seller open to a 9% concession, seller financing, or rate buy-down credit?
- Property tax is high relative to price — has the assessment been appealed recently, and will the sale trigger a re-assessment?
- What does the HOA fee cover, when was the last increase, and are there any pending special assessments or reserve-fund shortfalls?
- Is there a deadline driving the sale (1031 exchange, divorce, estate, relocation)? That informs how much negotiation room exists.
- Schools are D-rated, which usually means shorter tenancies and higher turnover. Who's the typical renter profile here, and what's been the actual vacancy rate?
- Crime grade is F in this area — have there been break-ins, vandalism, or insurance claims at this property in the last 3 years? What carrier currently insures it and at what premium?
- The area grade is low — what's the realistic commute time and amenity access for the typical tenant pool here? Any planned neighborhood developments (good or bad) we should know about?
- What's the average days-on-market for RENTAL listings here right now (not sales)? A rising rental-DOM trend means longer vacancies and softer asking-rent achievability than the comps imply.
- What's the recent tenant-quality profile in this submarket — average credit score on applications, eviction rate, late-payment / NSF rate, and stable-employment percentage? A property-management company in the area should have these aggregated.
- How much new for-sale + rental construction is in the pipeline within 1–3 miles? Heavy new supply typically softens prices + rents 12–24 months out; constrained supply supports both.
Investment metrics
- 1% rule
- 0.97% ✗
- Cap rate
- 5.68%
- Cash-on-cash
- -2.17%
- DSCR
- 0.90
- GRM
- 8.6
CMA / ARV
- ARV (median comp)
- $320,175
- List price
- $270,000
- Delta
- -15.67%
- Verdict
- UNDERPRICED
- Comps
- 20 within 1.0 mi
Show comp detail 12 sales within ~0.75 mi
| Address | Dist | Beds/Ba | Sqft | Sold | Price | $/sf | Match |
|---|---|---|---|---|---|---|---|
| 13203 Yaupon Holly Ln | 0.28mi | 3/2.0 | 2,360 (-2%) | 1mo | $299,900 | $127 | 81 |
| 14418 Gadwall Ct | 0.21mi | 3/2.0 | 2,308 (-4%) | 8mo | $300,000 | $130 | 75 |
| 14518 Red Tailed Hawk Ln | 0.34mi | 4/2.5 (+1) | 2,443 (+2%) | 1mo | $379,999 | $156 | 72 |
| 14510 Southern Magnolia Cir | 0.14mi | 4/2.0 (+1) | 2,247 (-6%) | 6mo | $345,000 | $154 | 70 |
| 13314 White Ibis Dr | 0.22mi | 4/2.5 (+1) | 2,627 (+9%) | 1mo | $343,953 | $131 | 65 |
| 13719 Brighton Park Dr | 0.41mi | 4/2.0 (+1) | 2,537 (+6%) | 1mo | $335,000 | $132 | 64 |
| 12710 Lady Jane | 0.52mi | 4/2.0 (+1) | 2,349 (-2%) | 5mo | $339,900 | $145 | 61 |
| 13714 Brighton Park Dr | 0.41mi | 4/2.0 (+1) | 2,258 (-6%) | 6mo | $250,000 | $111 | 59 |
| 14614 Oxwick Cir | 0.27mi | 4/2.0 (+1) | 2,128 (-12%) | 4mo | $304,999 | $143 | 58 |
| 12902 Chalfield Cir | 0.41mi | 4/2.5 (+1) | 2,674 (+11%) | 0mo | $365,000 | $136 | 53 |
| 14510 Kings Head Dr | 0.54mi | 4/2.5 (+1) | 2,477 (+3%) | 11mo | $375,000 | $151 | 52 |
| 14111 Blisswood Dr | 0.74mi | 4/3.0 (+1) | 2,737 (+14%) | 1mo | $395,000 | $144 | 31 |
Match score weights: distance 35% · size 25% · config 20% · recency 20%. Top-matched comps best support the ARV.
Projected returns pro-forma
-1.59% appreciation · 0.92% rent growth · sell at horizon
- IRR
- -13.6%
- Equity multiple
- 0.45×
- Total profit
- $-41,245
- Equity at exit
- $57,663
- IRR
- -9.2%
- Equity multiple
- 0.31×
- Total profit
- $-52,403
- Equity at exit
- $54,360
Cash invested: $75,600 (down + closing). Projections, not guarantees.
Landlord ↔ Tenant lean methodology
- Overall (STATE)
- 87 Strongly Landlord-Friendly
- State Texas
- 87 Strongly Landlord-Friendly · R+5
- County
- — inherits STATE
- City
- — inherits STATE
ZIP-level market 77044
- Home prices YoY
- -0.7%
- Rents YoY
- 0.9%
- Active inventory
- 337
- Price-to-rent
- 8.6×
Monthly cashflow live
- Estimated rent
- $2,625 high interval (Pro) →
- Mortgage (P&I)
- −$1,416
- Tax from tax record
- −$601 /mo · $7,208/yr
- Insurance
- −$112
- HOA
- −$82
- Vacancy / Maint / Mgmt
- −$551
- Net cashflow
- $-137
Break-even live
UW: 25.0% down · 7.5% · 30yr · 1.5% tax · 5.0% vac · 8.0% maint · 8.0% mgmt
Financing live
Cash to close
- Down payment
- $67,500
- Closing costs
- $8,100
- Reserves months
- —
- Total cash needed
- —
Loan-product check · same deal, 3 products live
Conventional
25% down · 7.5% · 30yr
- Down + closing
- —
- Monthly P&I
- —
- Monthly cashflow
- —
- DSCR
- —
- Eligible?
- —
Personal DTI + credit; lowest rate.
DSCR
20% down · 8.5% · 30yr
- Down + closing
- —
- Monthly P&I
- —
- Monthly cashflow
- —
- DSCR
- —
- Eligible?
- —
No personal income docs; deal must DSCR.
Hard money
10% down · 12.0% · 12mo
- Down + closing
- —
- Monthly P&I
- —
- Monthly cashflow
- —
- DSCR
- —
- Eligible?
- —
Short-term bridge; refi at stabilization.
Rent comps 6 comps
| Address | Beds | Baths | Sqft | Rent | $/sqft | DOM | Units | Dist |
|---|---|---|---|---|---|---|---|---|
| 14407 Jessica Falls Cir Houston, TX | 3.0 | 2.0 | 2554 | $2,600 | $1.02 | 44d | 1 | 0.18mi |
| 13606 Caney Springs Ln Houston, TX | 3.0 | 2.0 | 2502 | $2,415 | $0.97 | 21d | 1 | 0.59mi |
| 14419 Stonebury Trail Ln Houston, TX | 3.0 | 2.5 | 2675 | $2,571 | $0.96 | 1d | 1 | 0.75mi |
| 15410 Rosehill Summit Ln Houston, TX | 4.0 | 3.0 | 2631 | $5,000 | $1.90 | 1d | 1 | 0.97mi |
| 12731 Arcola Valley Ct Houston, TX | 4.0 | 3.0 | 2663 | $2,716 | $1.02 | 5d | 1 | 1.02mi |
| 14700 Chapman Woods Xing Unit 1 Houston, TX | 3.0 | 2.0 | 1758 | $1,340 | $0.76 | 1d | 1 | 1.32mi |
HOA detail
- Monthly dues
- $82 · $984/yr
Listing history 35 events
-
2026-06-18days on market $270,000 Active 35 DOM
-
2026-06-17days on market $270,000 Active 34 DOM
-
2026-06-16days on market $270,000 Active 33 DOM
-
2026-06-15days on market $270,000 Active 32 DOM
-
2026-06-13days on market $270,000 Active 30 DOM
-
2026-06-13days on market $270,000 Active 29 DOM
-
2026-06-09days on market $270,000 Active 26 DOM
-
2026-06-08days on market $270,000 Active 25 DOM
-
2026-06-07pricedays on market $270,000 Active 24 DOM
-
2026-06-04days on market $280,000 Active 21 DOM
-
2026-06-03days on market $280,000 Active 20 DOM
-
2026-06-02days on market $280,000 Active 19 DOM
-
2026-06-01days on market $280,000 Active 18 DOM
-
2026-05-31days on market $280,000 Active 17 DOM
-
2026-05-14$280,000 Active 349-char remark
-
2026-04-07historical
-
2026-03-19price $296,200
-
2026-03-19price $369,200
-
2026-03-12price $269,200
-
2026-03-12price $262,200
-
2026-02-05$324,999 Active
-
2026-01-16historical
-
2026-01-10$309,900 Active
-
2026-01-01historical
-
2025-10-17price $329,900
-
2025-09-04$335,000 Active
-
2022-10-11soldstatus Sold
-
2022-10-10soldstatus
-
2022-09-26status Pending
-
2022-08-10$314,000 Active
-
2022-07-21soldstatus
-
2005-04-14soldstatus
-
2005-02-21soldstatus
-
2005-01-31historical
-
2004-07-22$164,400
ⓘ Source: listings_history table (triggers on properties + properties_extension) + one-shot
backfill from property_details.listing_events for pre-trigger history.
Tax reassessment forecast TX · Resets to sale price
- Current annual tax
- $7,208 · $601/mo
- Projected year-2 tax
- $7,208 · $601/mo
- Expected delta
- $0/yr ($0/mo · 0.0%)
ⓘ Screening estimate from a state-policy table — verify with the county assessor before closing.
Climate risk First Street
- Flood 1/10 Low FEMA zone X (unshaded) · 0% chance over 30 yrs
- Wildfire 3/10 Moderate
- Heat 9/10 Extreme 7 d/yr ≥111°F today · 24 d/yr by 30 yrs out
- Wind 9/10 Extreme 99% chance of damaging wind over 30 yrs
- Air quality 3/10 Moderate 2 unhealthy d/yr today · 3 by 30 yrs out
Nearby sold comps map
Loading sold comps map…
Walkable amenities ~0.75 mi
Loading nearby amenities…
Taxation est. · year 1
- Rental income
- $31,505
- − Mortgage interest
- −$15,124
- − Property taxes
- −$7,208
- − Insurance
- −$1,350
- − Repairs & maintenance
- −$2,520
- − Management
- −$2,520
- − HOA
- −$984
- − Depreciation
- −$7,855
- Taxable loss
- −$6,056
- Est. tax savings @ 24.0%
- +$1,453
- After-tax cash flow
- $-190/yr
For passive investors: Depreciation is non-cash, so a rental often shows a tax loss while cash-flowing — sheltering income. Rental losses are passive: they offset passive income freely, and up to $25,000/yr can offset ordinary (W-2) income if you actively participate and your MAGI is under $100k (phasing out to $0 by $150k); unused losses carry forward. On sale, claimed depreciation is recaptured at up to 25%, and gains may owe capital-gains tax (a 1031 exchange can defer both). Figures are a year-1 estimate at your 24.0% rate — not tax advice; consult a CPA.
Schools (NCES district)
- District
- Humble ISD
- NCES district ID
- 4823910
- Math proficiency
- 38% ▼ -11.00%
- Reading proficiency
- 44% ▼ -7.00%
- Median HH income
- $83,946
- Composite
- 38.55/100
- National rank
- #4171
- State rank
- #262 of 826 in TX
Livability — Houston
- Score
- 74/100
- State rank
- #184
- US rank
- #4771
Category grades
Schools grade is shown separately in the Schools card above.
Census & demographics
- Census place
- Houston, TX
- County
- Harris County · 4,702,590 people
- City population
- 3,226,434
- Metro
- Houston-The Woodlands-Sugar Land, TX
- Population (ZIP)
- 58,347
- Household income
- $95,000
- Rent vs Own
- Severe rent burden
- 1332.0
Population outlook (Harris County) Hauer SSP2
- Today (2025)
- 5,571,493 people
- By 2030
- 6,089,821 · +9.3%
- By 2040
- 7,142,806 · +28.2%
- By 2050
- 8,185,864 · +46.9%
- By 2075
- 10,574,329 · +89.8%
- By 2100
- 12,109,958 · +117.4%
Race, ethnicity, and origin ACS 2023
- Neighborhood character
- Diverse neighborhood (Simpson 0.66)
- Race & ethnicity
- Hispanic / Latino 44% Black 32% White 19% Two or more races 18% Native American 2% Asian 1%
- Hispanic origin (detail)
- Mexican 36%
- Common ancestry
- Lithuanian 1% Romanian 1% Iranian 1%
- Foreign-born
- 18% · Canada
- Languages at home
- 61% English-only · Spanish 35% French/Haitian/Cajun 1% Other Indo-European 1%
Political lean MEDSL · Harris
- 2024 margin
- Lean D (+5.5) · D 52.0% · R 46.4% · Other 1.6%
- 2008→2024 swing
- +3.9pp toward D · 2008: 1.6pp · 2024: 5.5pp
- All cycles
- 2024: D+5.5 2020: D+13.3 2016: D+12.4 2012: D+0.1 2008: D+1.6
Not yet ingested
- Civics
- —
Market trends
- HPI YoY
- ▼ -1.59%
- Current HPI
- 215.5736
- Rent YoY
- ▲ 0.92%
- Metro
- Houston-The Woodlands-Sugar Land, TX
- State GDP YoY
- ▲ 3.95%
- F500 in state
- 110
Industry mix (Fortune 500 HQ in TX)
| Industry | F500 HQs | Revenue |
|---|---|---|
| Energy | 16 | $1,198B |
|
||
| Technology | 5 | $198B |
|
||
| Engineering / Construction | 4 | $72B |
|
||
| Energy Services | 3 | $60B |
|
||
| Utilities | 3 | $41B |
|
||
| Healthcare | 2 | $330B |
|
||
Price history
+64.2% since first listed22 events — show timeline
- 2026-06-04 Price Changed $270,000 HARMLS
- 2026-05-14 Listed $280,000 HARMLS
- 2026-04-07 Listing Removed — HARMLS
- 2026-03-19 Price Changed $296,200 HARMLS
- 2026-03-19 Price Changed $369,200 HARMLS
- 2026-03-12 Price Changed $269,200 HARMLS
- 2026-03-12 Price Changed $262,200 HARMLS
- 2026-02-05 Listed $324,999 HARMLS
- 2026-01-16 Listing Removed — HARMLS
- 2026-01-10 Listed $309,900 HARMLS
- 2026-01-01 Listing Removed — HARMLS
- 2025-10-17 Price Changed $329,900 HARMLS
- 2025-09-04 Listed $335,000 HARMLS
- 2022-10-11 Sold (MLS) — HARMLS
- 2022-10-10 Sold (Public Records) — Public Records
- 2022-09-26 Pending — HARMLS
- 2022-08-10 Listed $314,000 HARMLS
- 2022-07-21 Sold (Public Records) — Public Records
- 2005-04-14 Sold (Public Records) — Public Records
- 2005-02-21 Sold (Public Records) — Public Records
- 2005-01-31 Listing Removed — HARMLS
- 2004-07-22 Listed $164,400 HARMLS
Property tax history
+1.0%/yrLatest (2025): $7,208 · -1.9% YoY. Source: county tax records.
Cash-flow waterfall
monthlySold comps — $/sqft
last 12 mo · ≤1 miLoading sold comps…