 🏗️ New Construction
Clayton Rutledge 118 Duck River Estates Plan · Columbia, TN
Flood risk 8/10 · Major
- FEMA flood zone
- AE
- Chance of flooding over 30 yrs
- 0.99%
- Est. flood insurance / yr
- $435 – $905
Fire risk 2/10 · Minimal
- Est. fire insurance / yr
- $949 – $1,763
Heat risk 5/10 · Moderate
- Hot days now (above threshold)
- 7 days/yr
- Hot days in 30 yrs
- 19 days/yr
Wind risk No data
- Chance of severe wind over 30 yrs
- —
Air-quality risk 1/10 · Minimal
- Unhealthy air days now
- 0 days/yr
- Unhealthy air days in 30 yrs
- 0 days/yr
Risk factors via First Street. Map © Google.
Why this score? — see what drove the F grade
The composite is a weighted blend of 9 inputs, each scored 0–100. Each bar is that input's sub-score; the figure is the points it added to the 100-point composite (weight × sub-score).
- ARV discount +7.5/15.0
- Cash flow +4.7/30.0
- Condition / age +4.0/5.0
- Rent growth +3.7/5.0
- Livability +3.2/5.0
- Schools +1.8/10.0
- 1% rule +0.6/10.0
- DSCR +0.0/10.0
- Appreciation +0.0/10.0
$177,000
🖨 Deal sheet 📄 Offer letter ✓ Due diligence
Listing remarks
Come tour this 3-bedroom, 2-bath home featuring an open floor plan, spacious primary suite, 8x10 storage shed and much more!
Key facts
- Open floor plan
- Storage shed
- Listed 55 days
Tags
Property features AI
Finance
- Financial info: List price $177,000
Exterior
- Utilities: Electric heating; Central air conditioning
- Home design: Single-family plan (Clayton Rutledge 118)
- Construction: Living area approximately 1680
- Exterior features: Shake roof
Interior
- Bedrooms: 3 bedrooms
- Bathrooms: 2 bathrooms
- Heating & cooling: Electric heating; Central air conditioning
- Interior features: Plan: Clayton Rutledge 118 Duck River Estates
Neighborhood map
What this means for you Summary
Snapshot
- This is a 3-bed/2.0-bath manufactured listed at $177k. Condition is rated good.
Deal economics
- At list price, monthly cash flow is $-1k ($-12k/yr) — negative.
- The deal already cash-flows at list — no discount required.
- Meets the 1% rule at list price ($2k rent vs $177k).
- Recommended offer: $172k (3.0% below list) — sets the bar for market timing.
Location & tenants
- Location reads 63/100 on livability (#207 in TN) — a middle-class / working-renter tenant base. Strengths: cost of living A+, housing A+; Watch: employment C-, health & safety C-, schools F.
- Maury County (town): math 19% / reading 21% proficiency, ranked #108 of 139 in TN (top 78%) — low school quality limits family demand, transient renter base, plan for 1-2y turnover.
- Market conditions: Rents rising fast (+5.0%/yr); 1118 active listings in the ZIP; 5 comparable units currently listed for rent nearby; rentals leasing fast (median 13d on market — plan ~1-2 weeks tenant-placement turnaround); 1,650 units permitted in Maury County in 2024 (60 in 5+ unit buildings).
- This rent runs 38% of the median local income ($68k/yr) — at the standard rent-burdened threshold; future hikes will face affordability resistance.
Forward outlook
- Local home prices are declining (-3.0%/yr); year-one equity from $3k of loan paydown is wiped out by about $12k of value loss. Plan a longer hold.
- Maury County population projected at +34% by 2050 — long-run rental-demand tailwind backs the buy-and-hold thesis.
Negotiation context
- It's been on market 55 days — a 3% lower offer ($172k) is reasonable based on typical stale-listing flexibility.
Risks & watch-outs
- Watch-outs: property tax is 3.3% of price; flood insurance adds $56/mo.
- Climate carrying-cost: in FEMA flood zone AE (mandatory federal flood insurance); extreme-heat days projected 7→19/yr by 2055 (HVAC capex compounding) — expect insurance premiums to compound above CPI over the hold.
Questions for the listing agent
- What do current leases actually rent for vs. the listed asking? Can we see a recent rent roll and the last 12 months of T-12 income?
- It's been on market 55 days. Have you received any prior offers? Is the seller open to a 3% concession, seller financing, or rate buy-down credit?
- Property tax is high relative to price — has the assessment been appealed recently, and will the sale trigger a re-assessment?
- What's the actual annual flood-insurance premium (NFIP or private), and is the property in a SFHA with mandatory coverage?
- Is there a deadline driving the sale (1031 exchange, divorce, estate, relocation)? That informs how much negotiation room exists.
- Schools are F-rated, which usually means shorter tenancies and higher turnover. Who's the typical renter profile here, and what's been the actual vacancy rate?
- Crime grade is F in this area — have there been break-ins, vandalism, or insurance claims at this property in the last 3 years? What carrier currently insures it and at what premium?
- The area grade is low — what's the realistic commute time and amenity access for the typical tenant pool here? Any planned neighborhood developments (good or bad) we should know about?
- What's the average days-on-market for RENTAL listings here right now (not sales)? A rising rental-DOM trend means longer vacancies and softer asking-rent achievability than the comps imply.
- What's the recent tenant-quality profile in this submarket — average credit score on applications, eviction rate, late-payment / NSF rate, and stable-employment percentage? A property-management company in the area should have these aggregated.
- How much new for-sale + rental construction is in the pipeline within 1–3 miles? Heavy new supply typically softens prices + rents 12–24 months out; constrained supply supports both.
Investment metrics
- 1% rule
- 0.56% ✗
- Cap rate
- 3.32%
- Cash-on-cash
- -10.61%
- DSCR
- 0.53
- GRM
- 14.8
CMA / ARV
- ARV (median comp)
- $384,930
- List price
- $177,000
- Delta
- -54.02%
- Verdict
- UNDERPRICED
- Comps
- 2 within 2.0 mi
Projected returns pro-forma
-3.0% appreciation · 4.97% rent growth · sell at horizon
- IRR
- -34.6%
- Equity multiple
- -0.13×
- Total profit
- $-122,181
- Equity at exit
- $57,394
- IRR
- -34.0%
- Equity multiple
- -0.58×
- Total profit
- $-170,182
- Equity at exit
- $33,282
Cash invested: $107,780 (down + closing). Projections, not guarantees.
Landlord ↔ Tenant lean methodology
- Overall (STATE)
- 87 Strongly Landlord-Friendly
- State Tennessee
- 87 Strongly Landlord-Friendly · R+13
- County
- — inherits STATE
- City
- — inherits STATE
ZIP-level market 38401
- Home prices YoY
- -22.7%
- Rents YoY
- 5.0%
- Active inventory
- 1118
- Price-to-rent
- 6.8×
Monthly cashflow live
- Estimated rent
- $2,161 high interval (Pro) →
- Mortgage (P&I)
- −$2,019
- Tax est. 1.5%
- −$481 /mo · $5,774/yr
- Insurance
- −$160
- Flood insurance flood zone
- −$56 /mo · $670/yr
- HOA
- −$0
- Vacancy / Maint / Mgmt
- −$454
- Net cashflow
- $-1,009
Break-even live
UW: 25.0% down · 7.5% · 30yr · 1.5% tax · 5.0% vac · 8.0% maint · 8.0% mgmt
Financing live
Cash to close
- Down payment
- $96,232
- Closing costs
- $11,548
- Reserves months
- —
- Total cash needed
- —
Loan-product check · same deal, 3 products live
Conventional
25% down · 7.5% · 30yr
- Down + closing
- —
- Monthly P&I
- —
- Monthly cashflow
- —
- DSCR
- —
- Eligible?
- —
Personal DTI + credit; lowest rate.
DSCR
20% down · 8.5% · 30yr
- Down + closing
- —
- Monthly P&I
- —
- Monthly cashflow
- —
- DSCR
- —
- Eligible?
- —
No personal income docs; deal must DSCR.
Hard money
10% down · 12.0% · 12mo
- Down + closing
- —
- Monthly P&I
- —
- Monthly cashflow
- —
- DSCR
- —
- Eligible?
- —
Short-term bridge; refi at stabilization.
Rent comps 5 comps
| Address | Beds | Baths | Sqft | Rent | $/sqft | DOM | Units | Dist |
|---|---|---|---|---|---|---|---|---|
| 552 Nightengale Ridge Dr , TN | 3.0 | 2.5 | 2163 | $2,500 | $1.16 | 12d | 1 | 1.27mi |
| 1827 Goldsberry St Columbia, TN | 3.0 | 2.5 | 1503 | $1,795 | $1.19 | 16d | 1 | 1.28mi |
| 1422 Club House Dr Columbia, TN | 1.0–3.0 | 1.0–2.0 | 1039 | $1,799 | $1.73 | 1d | 20 | 1.40mi |
| 721 Poplar St Unit A Columbia, TN | 4.0 | 2.5 | 1491 | $2,500 | $1.68 | 43d | 1 | 1.44mi |
| 721 Poplar St Unit B Columbia, TN | 4.0 | 2.5 | 1491 | $2,500 | $1.68 | 3d | 1 | 1.44mi |
Listing history 14 events
-
2026-06-18days on market $177,000 Active 55 DOM
-
2026-06-17days on market $177,000 Active 54 DOM
-
2026-06-16days on market $177,000 Active 53 DOM
-
2026-06-15days on market $177,000 Active 52 DOM
-
2026-06-13days on market $177,000 Active 50 DOM
-
2026-06-13days on market $177,000 Active 49 DOM
-
2026-06-09days on market $177,000 Active 46 DOM
-
2026-06-08days on market $177,000 Active 45 DOM
-
2026-06-07days on market $177,000 Active 44 DOM
-
2026-06-03days on market $177,000 Active 40 DOM
-
2026-06-02days on market $177,000 Active 39 DOM
-
2026-06-01days on market $177,000 Active 38 DOM
-
2026-05-31days on market $177,000 Active 37 DOM
-
2026-04-24$177,000 Active 124-char remark
ⓘ Source: listings_history table (triggers on properties + properties_extension) + one-shot
backfill from property_details.listing_events for pre-trigger history.
Climate risk First Street
- Flood 8/10 Severe FEMA zone AE · 99% chance over 30 yrs
- Wildfire 2/10 Low
- Heat 5/10 Major
- Air quality 1/10 Low 0 unhealthy d/yr today · 0 by 30 yrs out
Nearby sold comps map
Loading sold comps map…
Walkable amenities ~0.75 mi
Loading nearby amenities…
Taxation est. · year 1
- Rental income
- $25,935
- − Mortgage interest
- −$21,562
- − Property taxes
- −$5,774
- − Insurance
- −$2,595
- − Repairs & maintenance
- −$2,075
- − Management
- −$2,075
- − Depreciation
- −$11,198
- Taxable loss
- −$19,344
- Est. tax savings @ 24.0%
- +$4,642
- After-tax cash flow
- $-7,461/yr
For passive investors: Depreciation is non-cash, so a rental often shows a tax loss while cash-flowing — sheltering income. Rental losses are passive: they offset passive income freely, and up to $25,000/yr can offset ordinary (W-2) income if you actively participate and your MAGI is under $100k (phasing out to $0 by $150k); unused losses carry forward. On sale, claimed depreciation is recaptured at up to 25%, and gains may owe capital-gains tax (a 1031 exchange can defer both). Figures are a year-1 estimate at your 24.0% rate — not tax advice; consult a CPA.
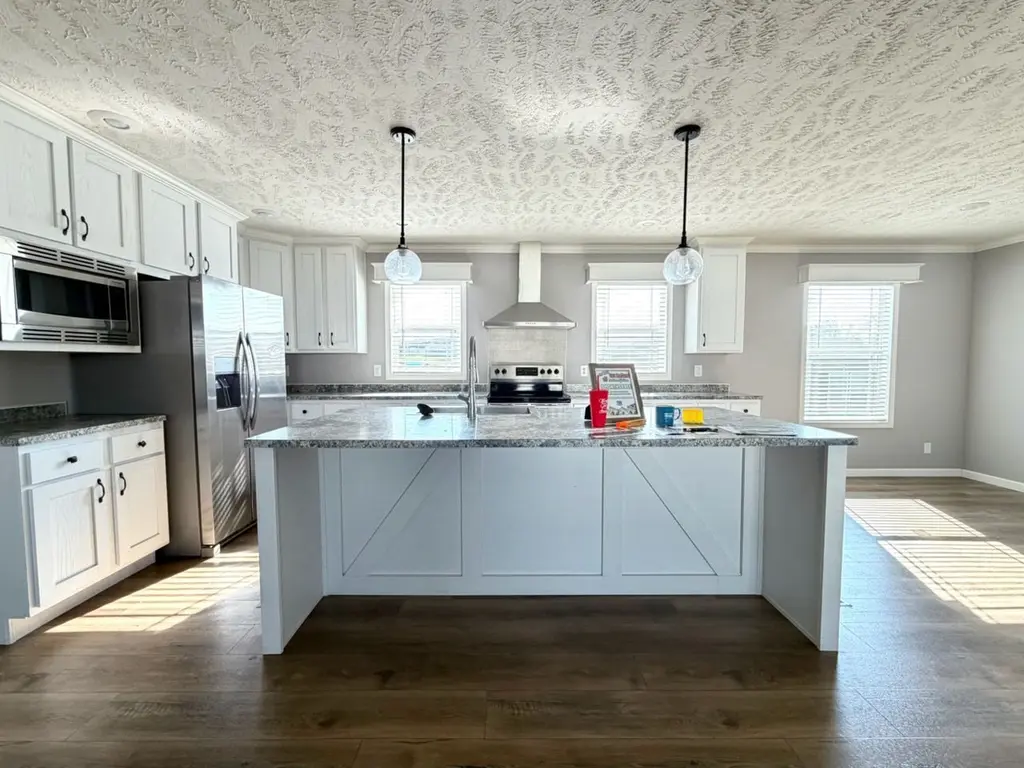
Condition & rehab AI · 12 photos
This 3-bedroom, 2-bath home features an open floor plan and is in excellent condition, ready for move-in.
Value-add opportunities
- Both Painting the ceiling — Enhances curb appeal and interior aesthetics
- Both Adding a backsplash in the kitchen — Improves functionality and aesthetics
- Both Upgrading the flooring in the bathrooms — Enhances functionality and aesthetics
- Both Upgrading the lighting fixtures — Enhances functionality and aesthetics
Renovation cost estimate screening
Value-add ROI direction
- Both Painting the ceiling — Enhances curb appeal and interior aesthetics ↑
- Both Adding a backsplash in the kitchen — Improves functionality and aesthetics ↑
- Both Upgrading the flooring in the bathrooms — Enhances functionality and aesthetics ↑
- Both Upgrading the lighting fixtures — Enhances functionality and aesthetics ↑
ⓘ Cost ranges are severity-bucket heuristics (US national rule-of-thumb). Get contractor quotes + a written scope before underwriting a rehab budget.
Schools (NCES district)
- District
- Maury County
- NCES district ID
- 4702760
- Math proficiency
- 19% ▼ -5.00%
- Reading proficiency
- 21% ▼ -4.00%
- Median HH income
- $47,668
- Composite
- 17.69/100
- National rank
- #9024
- State rank
- #108 of 139 in TN
Livability — Columbia
- Score
- 63/100
- State rank
- #207
- US rank
- #16090
Category grades
Schools grade is shown separately in the Schools card above.
Census & demographics
- Census place
- Columbia, TN
- County
- Maury County · 121,382 people
- City population
- 67,482
- Metro
- Nashville-Davidson--Murfreesboro--Franklin, TN
- Population (ZIP)
- 67,482
- Household income
- $68,475
- Rent vs Own
- Severe rent burden
- 2026.0
Population outlook (Maury County) Hauer SSP2
- Today (2025)
- 102,894 people
- By 2030
- 110,269 · +7.2%
- By 2040
- 124,426 · +20.9%
- By 2050
- 137,543 · +33.7%
- By 2075
- 167,438 · +62.7%
- By 2100
- 184,489 · +79.3%
Race, ethnicity, and origin ACS 2023
- Neighborhood character
- Predominantly White (74%)
- Race & ethnicity
- White 74% Black 12% Hispanic / Latino 9% Two or more races 7%
- Hispanic origin (detail)
- Mexican 7%
- Common ancestry
- Slovak 1% Serbian 1% Romanian 1%
- Foreign-born
- 4% · Canada
- Languages at home
- 94% English-only · Spanish 5%
Political lean MEDSL · Maury
- 2024 margin
- Solid R (+44.6) · D 27.1% · R 71.8% · Other 1.1%
- 2008→2024 swing
- -6.2pp toward R · 2008: -38.4pp · 2024: -44.6pp
- All cycles
- 2024: R+44.6 2020: R+36.5 2016: R+39.2 2012: R+26.9 2008: R+38.4
Not yet ingested
- Civics
- —
Market trends
- HPI YoY
- ▼ -100.75%
- Current HPI
- 343.0362
- Rent YoY
- ▲ 4.97%
- Metro
- Nashville-Davidson--Murfreesboro--Franklin, TN
- State GDP YoY
- ▲ 2.78%
- F500 in state
- 22
Industry mix (Fortune 500 HQ in TN)
| Industry | F500 HQs | Revenue |
|---|---|---|
| Healthcare | 3 | $91B |
|
||
| Retail | 3 | $72B |
|
||
| Transportation / Logistics | 1 | $88B |
|
||
| Paper / Packaging | 1 | $19B |
|
||
| Insurance | 1 | $13B |
|
||
| Energy | 1 | $12B |
|
||
Cash-flow waterfall
monthlySold comps — $/sqft
last 12 mo · ≤1 miLoading sold comps…