 Duplex
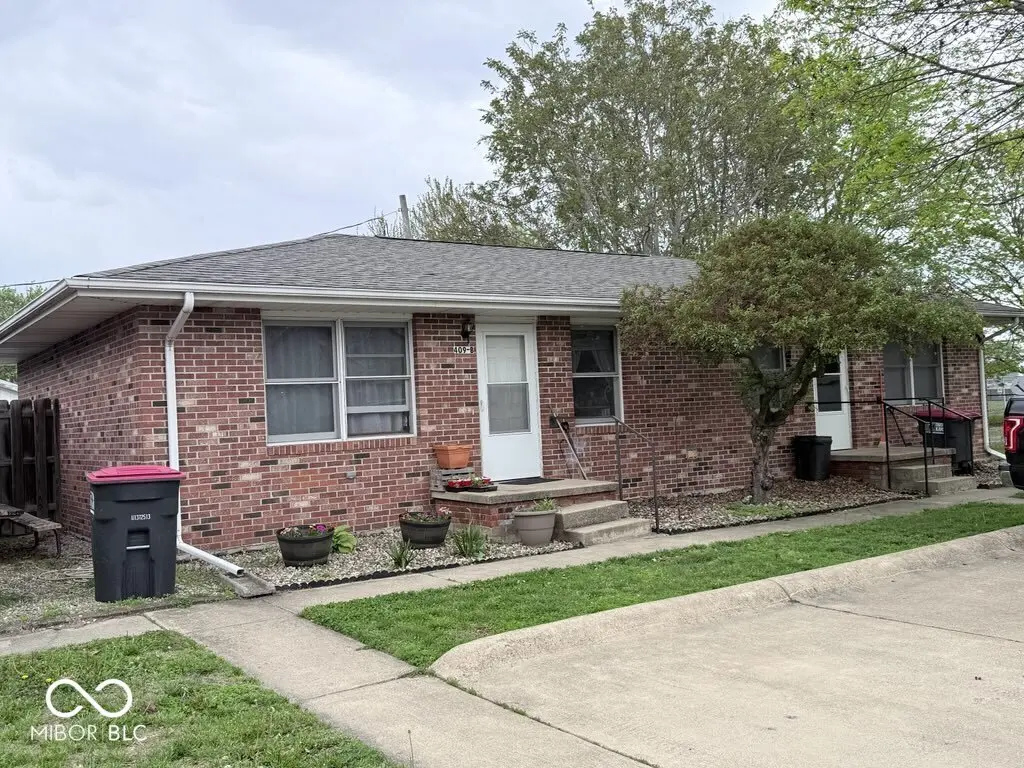
409 S South St · Brookston, IN
Flood risk 1/10 · Minimal
- FEMA flood zone
- X (unshaded)
- Chance of flooding over 30 yrs
- 0.0%
- Est. flood insurance / yr
- $507 – $1,088
Fire risk 1/10 · Minimal
- Est. fire insurance / yr
- $717 – $1,331
Heat risk 3/10 · Minor
- Hot days now (above 101°F)
- 7 days/yr
- Hot days in 30 yrs
- 17 days/yr
Wind risk 2/10 · Minimal
- Chance of severe wind over 30 yrs
- —
Air-quality risk 2/10 · Minimal
- Unhealthy air days now
- 1 days/yr
- Unhealthy air days in 30 yrs
- 2 days/yr
Risk factors via First Street. Map © Google.
Why this score? — see what drove the D- grade
The composite is a weighted blend of 9 inputs, each scored 0–100. Each bar is that input's sub-score; the figure is the points it added to the 100-point composite (weight × sub-score).
- Cash flow +11.9/30.0
- ARV discount +7.5/15.0
- Schools +4.3/10.0
- Livability +3.6/5.0
- DSCR +3.5/10.0
- 1% rule +3.4/10.0
- Rent growth +2.5/5.0
- Condition / age +2.2/5.0
- Appreciation +0.0/10.0
$189,000
🖨 Deal sheet (PDF) 📄 Offer letter ✓ Due diligence
Multi-family units
County records classify this as Multi-Family (2-4 Unit). Listing-text estimate: 2 units. confirmed
Listing remarks
Great investment opportunity! This well-maintained duplex features two units, each offering 1 bedroom, 1 full bath, a comfortable living room, and an eat-in kitchen. Both units include private exterior storage spaces, providing added convenience for tenants. Current leases in place through April 2027 offer immediate rental income and stability for investors. A solid addition to any portfolio with built-in cash flow potential.
Key facts
- 6,098 sq ft lot
- 4 parking spots
- Built 1995
Tags
Property features AI
Exterior
- Parking: 4 open parking spaces
- Utilities: Public water; Public sewer
- Home design: Duplex residential income property; One story
- Construction: Brick construction
- Exterior features: Level lot; Lot approximately 60 x 100 (0.14 acre); Pets allowed
Interior
- Kitchen: Dishwasher; Disposal; Range; Refrigerator
- Flooring: Vinyl
- Bathrooms: 2 full bathrooms; 2 main-level bathrooms
- Heating & cooling: Central air conditioning; Forced air heating (natural gas)
- Interior features: Eat-in kitchen; Crawl space basement
- Laundry & utility: Washer and dryer included; Washer hookup
Neighborhood map
What this means for you Summary
Snapshot
- This is a 2 × 1-bed/1.0-bath units multifamily listed at $189k. Condition is rated fair.
Deal economics
- At list price, monthly cash flow is $-48 ($-581/yr) — negative. Per door: $-24/mo.
- To cash-flow at today's rent, offer at most $182k (3.7% below list).
- To meet the 1% rule (rent ≥ 1% of price), the offer needs to be $159k (15.8% below list).
- Recommended offer: $159k (15.8% below list) — sets the bar for 1% rule.
Location & tenants
- Location reads 71/100 on livability (#130 in IN) — a middle-class / working-renter tenant base. Strengths: crime A+, cost of living A+, housing A+; Watch: amenities F, commute F, health & safety F.
- Frontier School Corporation (rural): math 48% / reading 51% proficiency, ranked #52 of 301 in IN (top 17%) — families likely to look elsewhere, expect single-tenant / working-renter base with shorter leases.
- Zoned schools: Frontier Elementary (math 57% / reading 52%, grade C, #197 of 994 statewide, top 22%, 380 students, 39% FRL); Frontier Jr-Sr High School (math 37% / reading 52%, grade F, #169 of 369 statewide, top 51%, 291 students, 35% FRL).
- Market conditions: 22 active listings in the ZIP; 47 units permitted in White County in 2024 (0 in 5+ unit buildings).
Forward outlook
- Local home prices are declining (-3.0%/yr); year-one equity from $1k of loan paydown is wiped out by about $6k of value loss. Plan a longer hold.
- White County population projected at -19% by 2050 — secular population decline; favor cash flow + early exit over multi-decade hold.
Negotiation context
- It's been on market 54 days — a 3% lower offer ($183k) is reasonable based on typical stale-listing flexibility.
- 2 sale attempts; this cycle's ask has dropped $21k (10%) from the opening price — seller is motivated, your offer sets the floor, not the list.
Questions for the listing agent
- What do current leases actually rent for vs. the listed asking? Can we see a recent rent roll and the last 12 months of T-12 income?
- It's been on market 54 days. Have you received any prior offers? Is the seller open to a 16% concession, seller financing, or rate buy-down credit?
- Can we see the unit-by-unit rent roll, current vacancy, and any below-market leases? What's the average tenancy length?
- What capital expenditures (roof, boiler, parking lot, exteriors) have been made in the last 5 years, and what's planned in the next 2?
- Have any recent inspections been done? Can we get a copy of the seller's disclosures and any deferred-maintenance estimates?
- Is there a deadline driving the sale (1031 exchange, divorce, estate, relocation)? That informs how much negotiation room exists.
- Schools are B-rated — typically a magnet for longer-tenancy family renters. What's the average tenant stay here, and is there a school-zone premium baked into asking?
- The area grade is low — what's the realistic commute time and amenity access for the typical tenant pool here? Any planned neighborhood developments (good or bad) we should know about?
- What's the average days-on-market for RENTAL listings here right now (not sales)? A rising rental-DOM trend means longer vacancies and softer asking-rent achievability than the comps imply.
- What's the recent tenant-quality profile in this submarket — average credit score on applications, eviction rate, late-payment / NSF rate, and stable-employment percentage? A property-management company in the area should have these aggregated.
- How much new apartment / multifamily construction is in the pipeline within 1–3 miles? Heavy new supply (>2% of stock underway) typically softens rents 12–24 months out; light construction supports rent growth.
Investment metrics
- 1% rule
- 0.84% ✗
- Cap rate
- 5.99%
- Cash-on-cash
- -1.10%
- DSCR
- 0.95
- GRM
- 9.9
CMA / ARV
No comps found within radius.
Projected returns pro-forma
-3.0% appreciation · 3.0% rent growth · sell at horizon
- IRR
- -18.1%
- Equity multiple
- 0.36×
- Total profit
- $-33,688
- Equity at exit
- $28,181
- IRR
- -10.3%
- Equity multiple
- 0.37×
- Total profit
- $-33,212
- Equity at exit
- $16,341
Cash invested: $52,920 (down + closing). Projections, not guarantees.
Landlord ↔ Tenant lean methodology
- Overall (STATE)
- 90 Strongly Landlord-Friendly
- State Indiana
- 90 Strongly Landlord-Friendly · R+11
- County
- — inherits STATE
- City
- — inherits STATE
ZIP-level market 47923
- Home prices YoY
- -16.6%
- Active inventory
- 22
- Price-to-rent
- 19.8×
Monthly cashflow live
- Estimated rent
- $1,592 medium interval (Pro) →
- Mortgage (P&I)
- −$991
- Tax est. 1.5%
- −$236 /mo · $2,835/yr
- Insurance
- −$79
- HOA
- −$0
- Vacancy / Maint / Mgmt
- −$334
- Net cashflow
- $-48
Break-even live
Sensitivity live
| Price | -10% $82 | -5% $17 | +0% $-48 | +5% $-114 | +10% $-179 |
|---|---|---|---|---|---|
| Rent | -10% $-174 | -5% $-111 | +0% $-48 | +5% $14 | +10% $77 |
| Rate | -1.0pp $47 | -0.5pp $0 | base $-48 | +0.5pp $-97 | +1.0pp $-147 |
2-unit breakdown (identical units grouped — click to expand)
| Units | Beds | Baths | Est. rent |
|---|---|---|---|
| 2× units | 1 | 1 | $1,592 |
| #1 | 1 | 1 | $796 |
| #2 | 1 | 1 | $796 |
| Total (2 units) | $1,592 | ||
UW: 25.0% down · 7.5% · 30yr · 1.5% tax · 5.0% vac · 8.0% maint · 8.0% mgmt
Financing live
Cash to close
- Down payment
- $47,250
- Closing costs
- $5,670
- Reserves months
- —
- Total cash needed
- —
Loan-product check · same deal, 3 products live
Conventional
25% down · 7.5% · 30yr
- Down + closing
- —
- Monthly P&I
- —
- Monthly cashflow
- —
- DSCR
- —
- Eligible?
- —
Personal DTI + credit; lowest rate.
DSCR
20% down · 8.5% · 30yr
- Down + closing
- —
- Monthly P&I
- —
- Monthly cashflow
- —
- DSCR
- —
- Eligible?
- —
No personal income docs; deal must DSCR.
Hard money
10% down · 12.0% · 12mo
- Down + closing
- —
- Monthly P&I
- —
- Monthly cashflow
- —
- DSCR
- —
- Eligible?
- —
Short-term bridge; refi at stabilization.
Listing history 18 events
-
2026-06-22days on market $189,000 Active 54 DOM
-
2026-06-19days on market $189,000 Active 52 DOM
-
2026-06-18days on market $189,000 Active 51 DOM
-
2026-06-17days on market $189,000 Active 50 DOM
-
2026-06-16days on market $189,000 Active 49 DOM
-
2026-06-15days on market $189,000 Active 48 DOM
-
2026-06-14days on market $189,000 Active 46 DOM
-
2026-06-13days on market $189,000 Active 45 DOM
-
2026-06-10days on market $189,000 Active 43 DOM
-
2026-06-09days on market $189,000 Active 42 DOM
-
2026-06-08days on market $189,000 Active 41 DOM
-
2026-06-07pricedays on market $189,000 Active 40 DOM
-
2026-06-02days on market $209,900 Active 35 DOM
-
2026-06-01days on market $209,900 Active 34 DOM
-
2026-05-31days on market $209,900 Active 33 DOM
-
2026-05-30days on market $209,900 Active 32 DOM
-
2026-04-28$209,900 Active 429-char remark
-
2026-04-28$209,900 Active 429-char remark
ⓘ Source: listings_history table (triggers on properties + properties_extension) + one-shot
backfill from property_details.listing_events for pre-trigger history.
Climate risk First Street
- Flood 1/10 Low FEMA zone X (unshaded) · 0% chance over 30 yrs
- Wildfire 1/10 Low
- Heat 3/10 Moderate 7 d/yr ≥101°F today · 17 d/yr by 30 yrs out
- Wind 2/10 Low
- Air quality 2/10 Low 1 unhealthy d/yr today · 2 by 30 yrs out
Nearby sold comps map
Loading sold comps map…
Walkable amenities ~0.75 mi
Loading nearby amenities…
Taxation est. · year 1
- Rental income
- $19,104
- − Mortgage interest
- −$10,587
- − Property taxes
- −$2,835
- − Insurance
- −$945
- − Repairs & maintenance
- −$1,528
- − Management
- −$1,528
- − Depreciation
- −$5,498
- Taxable loss
- −$3,818
- Est. tax savings @ 24.0%
- +$916
- After-tax cash flow
- $335/yr
For passive investors: Depreciation is non-cash, so a rental often shows a tax loss while cash-flowing — sheltering income. Rental losses are passive: they offset passive income freely, and up to $25,000/yr can offset ordinary (W-2) income if you actively participate and your MAGI is under $100k (phasing out to $0 by $150k); unused losses carry forward. On sale, claimed depreciation is recaptured at up to 25%, and gains may owe capital-gains tax (a 1031 exchange can defer both). Figures are a year-1 estimate at your 24.0% rate — not tax advice; consult a CPA.
Condition & rehab AI · 1 photo
This well-maintained but slightly dated duplex requires moderate repairs and updates to enhance its resale and rental value.
Repairs flagged
- Moderate Brick siding — Weathered and discolored
- Moderate Exterior paint — Needs touch-up
Value-add opportunities
- Both Paint exterior and landscaping — Enhances curb appeal and resale value
- Both Replace HVAC system — Improves comfort and energy efficiency
- Both Replace windows — Enhances energy efficiency and curb appeal
Renovation cost estimate screening
| Repair item | Severity | Est. cost |
|---|---|---|
| Brick siding · Weathered and discolored | Moderate | $3,000–15,000 |
| Exterior paint · Needs touch-up | Moderate | $3,000–15,000 |
| Total estimated repair cost · 2 items | $6,000–30,000 |
Value-add ROI direction
- Both Paint exterior and landscaping — Enhances curb appeal and resale value ↑
- Both Replace HVAC system — Improves comfort and energy efficiency ↑
- Both Replace windows — Enhances energy efficiency and curb appeal ↑
ⓘ Cost ranges are severity-bucket heuristics (US national rule-of-thumb). Get contractor quotes + a written scope before underwriting a rehab budget.
Schools (NCES district)
- District
- Frontier School Corporation
- NCES district ID
- 1803810
- Math proficiency
- 48% ▼ -5.00%
- Reading proficiency
- 51% ▼ -9.00%
- Median HH income
- $57,969
- Composite
- 43.13/100
- National rank
- #3079
- State rank
- #52 of 301 in IN
Livability — Brookston
- Score
- 71/100
- State rank
- #130
- US rank
- #6722
Category grades
Schools grade is shown separately in the Schools card above.
Census & demographics
- Census place
- Brookston, IN
- Population (ZIP)
- 3,550
Population outlook (White County) Hauer SSP2
- Today (2025)
- 23,006 people
- By 2030
- 22,204 · -3.5%
- By 2040
- 20,441 · -11.1%
- By 2050
- 18,711 · -18.7%
- By 2075
- 14,989 · -34.8%
- By 2100
- 10,896 · -52.6%
Race, ethnicity, and origin ACS 2023
- Neighborhood character
- Predominantly White (94%)
- Race & ethnicity
- White 94% Two or more races 4% Hispanic / Latino 2%
- Common ancestry
- Iranian 2% Italian 2% Romanian 2%
- Foreign-born
- 2% · Canada
- Languages at home
- 97% English-only · Spanish 2%
Political lean MEDSL · White
- 2024 margin
- Solid R (+45.0) · D 26.4% · R 71.4% · Other 2.2%
- 2008→2024 swing
- -36.7pp toward R · 2008: -8.3pp · 2024: -45.0pp
- All cycles
- 2024: R+45.0 2020: R+44.1 2016: R+42.9 2012: R+23.6 2008: R+8.3
Not yet ingested
- Civics
- —
Market trends
- HPI YoY
- ▼ -47.62%
- Current HPI
- 238.3085
- Rent YoY
- —
- Metro
- —
- State GDP YoY
- ▲ 2.90%
- F500 in state
- 18
Industry mix (Fortune 500 HQ in IN)
| Industry | F500 HQs | Revenue |
|---|---|---|
| Industrial Machinery | 2 | $37B |
|
||
| Healthcare | 1 | $177B |
|
||
| Pharmaceuticals | 1 | $45B |
|
||
| Metals / Steel | 1 | $18B |
|
||
| Agriculture | 1 | $17B |
|
||
| Packaging | 1 | $12B |
|
||
Price history
-10.0% since first listed4 events — show timeline
- 2026-06-04 Price Changed $189,000 MIBOR as Distributed by MLS Grid
- 2026-06-04 Price Changed $189,000 IRMLS
- 2026-04-28 Listed $209,900 IRMLS
- 2026-04-28 Listed $209,900 MIBOR as Distributed by MLS Grid
Cash-flow waterfall
monthlySold comps — $/sqft
last 12 mo · ≤1 miLoading sold comps…