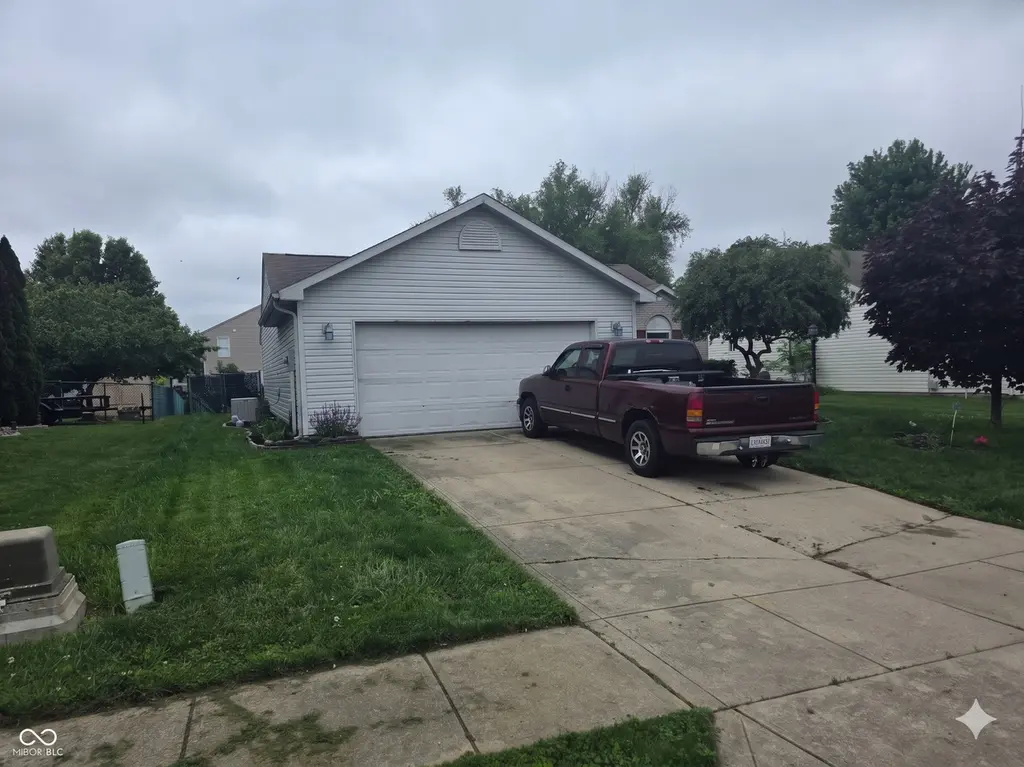
1701 Crimson Ln · Lebanon, IN
Flood risk 1/10 · Minimal
- FEMA flood zone
- X (unshaded)
- Chance of flooding over 30 yrs
- 0.0%
- Est. flood insurance / yr
- $507 – $1,088
Fire risk 1/10 · Minimal
- Est. fire insurance / yr
- $717 – $1,331
Heat risk 3/10 · Minor
- Hot days now (above 102°F)
- 7 days/yr
- Hot days in 30 yrs
- 18 days/yr
Wind risk 2/10 · Minimal
- Chance of severe wind over 30 yrs
- 0.0%
Air-quality risk 2/10 · Minimal
- Unhealthy air days now
- 1 days/yr
- Unhealthy air days in 30 yrs
- 2 days/yr
Risk factors via First Street. Map © Google.
Why this score? — see what drove the C+ grade
The composite is a weighted blend of 9 inputs, each scored 0–100. Each bar is that input's sub-score; the figure is the points it added to the 100-point composite (weight × sub-score).
- Cash flow +24.5/30.0
- ARV discount +15.0/15.0
- DSCR +7.9/10.0
- 1% rule +5.6/10.0
- Schools +3.7/10.0
- Livability +3.3/5.0
- Rent growth +2.5/5.0
- Condition / age +2.5/5.0
- Appreciation +0.0/10.0
$199,000
🖨 Deal sheet 📄 Offer letter ✓ Due diligence
Listing remarks
ATTENTION INVESTORS & DIY BUYERS! Looking for a project with massive upside and the ultimate financial head start? This 3-bedroom ranch comes out of the gate with a 4-YEAR-OLD ROOF, completely knocking out the absolute biggest structural expense before you even open the front door! Built in 2000, this home offers fantastic bones and a total blank canvas, leaving you plenty of room to update, modernize, and maximize your return on investment. Top Highlights & Equity Builders:The Ultimate Head Start: A 4-year-old roof means a major capital expenditure is already bypassed, letting you channel 100% of your renovation budget into the interior transformation. Smart, Functional Layout:
Key facts
- 2 car carport
- 4 year old roof
- 8,102 sq ft lot
Tags
Property features AI
Exterior
- Parking: Attached 2-car garage (approximately 440 sq ft)
- Utilities: Public water; Municipal sewer connected; Municipal solid waste service
- Home design: Single-family residence; One story
- Construction: Vinyl siding; Slab foundation
- Exterior features: Approximately 0.19-acre lot
Interior
- Kitchen: Electric oven; Microwave; Dishwasher; Garbage disposal
- Bedrooms: 3 bedrooms (all on the main level)
- Bathrooms: 2 full bathrooms (both on the main level)
- Heating & cooling: Natural gas heating; Central air conditioning
- Interior features: Attic access
- Laundry & utility: Main-level laundry
Neighborhood map
What this means for you Summary
Snapshot
- This is a 3-bed/2.0-bath single-family listed at $199k.
Deal economics
- At list price, monthly cash flow is $408 ($5k/yr) — positive.
- The deal already cash-flows at list — no discount required.
- Meets the 1% rule at list price ($2k rent vs $199k).
- Cap rate 8.8% vs local median 3.5% in Lebanon — top-decile yield for the area; either an underpriced asset or a hidden risk that comps aren't pricing in. Stress-test before assuming the spread holds.
Location & tenants
- Location reads 66/100 on livability (#296 in IN) — a middle-class / working-renter tenant base. Strengths: cost of living A+, housing A+; Watch: schools C-, amenities F, commute F.
- Lebanon Community School Corporation (town): math 41% / reading 44% proficiency, ranked #115 of 301 in IN (top 38%) — families likely to look elsewhere, expect single-tenant / working-renter base with shorter leases.
- Market conditions: 183 active listings in the ZIP; 6 comparable units currently listed for rent nearby; rentals at typical pace (median 15d on market — plan ~3-4 weeks tenant-placement turnaround); 898 units permitted in Boone County in 2024 (0 in 5+ unit buildings).
- This rent runs 37% of the median local income ($69k/yr) — at the standard rent-burdened threshold; future hikes will face affordability resistance.
Forward outlook
- Local home prices are declining (-3.0%/yr); year-one equity from $1k of loan paydown is wiped out by about $6k of value loss. Plan a longer hold.
- Boone County population projected at +46% by 2050 — long-run rental-demand tailwind backs the buy-and-hold thesis.
Negotiation context
- Only 2 days on market — expect competitive offers; lowballing is unlikely to land.
Questions for the listing agent
- Is there a deadline driving the sale (1031 exchange, divorce, estate, relocation)? That informs how much negotiation room exists.
- What's the average days-on-market for RENTAL listings here right now (not sales)? A rising rental-DOM trend means longer vacancies and softer asking-rent achievability than the comps imply.
- What's the recent tenant-quality profile in this submarket — average credit score on applications, eviction rate, late-payment / NSF rate, and stable-employment percentage? A property-management company in the area should have these aggregated.
- How much new for-sale + rental construction is in the pipeline within 1–3 miles? Heavy new supply typically softens prices + rents 12–24 months out; constrained supply supports both.
Investment metrics
- 1% rule
- 1.06% ✓
- Cap rate
- 8.75%
- Cash-on-cash
- 8.78%
- DSCR
- 1.39
- GRM
- 7.9
CMA / ARV
- ARV (on-the-fly)
- $240,196
- Comps found
- 12
Show comp detail 12 sales within ~0.75 mi
| Address | Dist | Beds/Ba | Sqft | Sold | Price | $/sf | Match |
|---|---|---|---|---|---|---|---|
| 1701 Crimson Ln | 0.00mi | 3/2.0 | 1,166 (0%) | 0mo | $199,000 | $171 | 100 |
| 2121 Jason Dr | 0.42mi | 3/2.0 | 1,216 (+4%) | 1mo | $250,000 | $206 | 73 |
| 1428 Elizabeth Dr | 0.31mi | 3/2.0 | 1,066 (-9%) | 1mo | $247,000 | $232 | 70 |
| 1505 Elizabeth Dr | 0.31mi | 3/1.0 | 1,084 (-7%) | 1mo | $231,000 | $213 | 69 |
| 2114 Hannah Ct | 0.14mi | 3/2.5 | 1,326 (+14%) | 2mo | $275,000 | $207 | 67 |
| 1423 Ashley Dr | 0.24mi | 3/2.0 | 1,023 (-12%) | 3mo | $250,000 | $244 | 66 |
| 2009 Jason Dr | 0.44mi | 3/2.0 | 1,296 (+11%) | 3mo | $225,000 | $174 | 58 |
| 1311 Geri Dr | 0.48mi | 3/1.5 | 1,014 (-13%) | 2mo | $199,000 | $196 | 52 |
| 1611 Garfield St | 0.75mi | 3/1.0 | 1,104 (-5%) | 0mo | $249,000 | $226 | 52 |
| 1010 Maple Dr W | 0.55mi | 3/2.0 | 1,304 (+12%) | 3mo | $260,000 | $199 | 52 |
| 1409 Geri Dr | 0.48mi | 2/1.0 (-1) | 1,014 (-13%) | 1mo | $170,000 | $168 | 46 |
| 1020 Syracuse Dr | 0.58mi | 4/1.0 (+1) | 1,056 (-9%) | 4mo | $172,500 | $163 | 45 |
Match score weights: distance 35% · size 25% · config 20% · recency 20%. Top-matched comps best support the ARV.
Projected returns pro-forma
-3.0% appreciation · 3.0% rent growth · sell at horizon
- IRR
- -3.0%
- Equity multiple
- 0.89×
- Total profit
- $-6,320
- Equity at exit
- $29,672
- IRR
- 6.7%
- Equity multiple
- 1.50×
- Total profit
- $27,769
- Equity at exit
- $17,206
Cash invested: $55,720 (down + closing). Projections, not guarantees.
Landlord ↔ Tenant lean methodology
- Overall (STATE)
- 90 Strongly Landlord-Friendly
- State Indiana
- 90 Strongly Landlord-Friendly · R+11
- County
- — inherits STATE
- City
- — inherits STATE
ZIP-level market 46052
- Active inventory
- 183
- Price-to-rent
- 7.9×
Monthly cashflow live
- Estimated rent
- $2,109 high interval (Pro) →
- Mortgage (P&I)
- −$1,044
- Tax from tax record
- −$132 /mo · $1,584/yr
- Insurance
- −$83
- HOA
- −$0
- Vacancy / Maint / Mgmt
- −$443
- Net cashflow
- $408
Break-even live
UW: 25.0% down · 7.5% · 30yr · 1.5% tax · 5.0% vac · 8.0% maint · 8.0% mgmt
Financing live
Cash to close
- Down payment
- $49,750
- Closing costs
- $5,970
- Reserves months
- —
- Total cash needed
- —
Loan-product check · same deal, 3 products live
Conventional
25% down · 7.5% · 30yr
- Down + closing
- —
- Monthly P&I
- —
- Monthly cashflow
- —
- DSCR
- —
- Eligible?
- —
Personal DTI + credit; lowest rate.
DSCR
20% down · 8.5% · 30yr
- Down + closing
- —
- Monthly P&I
- —
- Monthly cashflow
- —
- DSCR
- —
- Eligible?
- —
No personal income docs; deal must DSCR.
Hard money
10% down · 12.0% · 12mo
- Down + closing
- —
- Monthly P&I
- —
- Monthly cashflow
- —
- DSCR
- —
- Eligible?
- —
Short-term bridge; refi at stabilization.
Rent comps 6 comps
| Address | Beds | Baths | Sqft | Rent | $/sqft | DOM | Units | Dist |
|---|---|---|---|---|---|---|---|---|
| 1704 Crimson Ln Lebanon, IN | 3.0 | 2.0 | 1110 | $2,000 | $1.80 | 17d | 1 | 0.03mi |
| 2102 Yosemite Dr Lebanon, IN | 3.0 | 2.0 | 1400 | $2,300 | $1.64 | 4d | 1 | 0.46mi |
| 2102 Yosemite Dr Lebanon, IN | 3.0 | 2.0 | 1400 | $2,300 | $1.64 | 14d | 1 | 0.46mi |
| 830 Campbell St Lebanon, IN | 2.0–4.0 | 2.0 | 1728 | $1,604 | $0.93 | 1d | 1 | 0.77mi |
| 806 Harney Dr Lebanon, IN | 3.0 | 1.0 | 1170 | $2,500 | $2.14 | 17d | 1 | 0.86mi |
| 721 Crown Pointe Dr Lebanon, IN | 2.0–3.0 | 1.0–2.0 | 991 | $1,413 | $1.43 | 1d | 5 | 1.03mi |
Listing history 1 events
-
2026-05-23$199,000 Active
ⓘ Source: listings_history table (triggers on properties + properties_extension) + one-shot
backfill from property_details.listing_events for pre-trigger history.
Tax reassessment forecast IN · Partial reset (capped growth)
- Current annual tax
- $1,584 · $132/mo
- Projected year-2 tax
- $1,638 · $136/mo
- Expected delta
- +$54/yr (+$4/mo · 3.4%)
ⓘ Screening estimate from a state-policy table — verify with the county assessor before closing.
Climate risk First Street
- Flood 1/10 Low FEMA zone X (unshaded) · 0% chance over 30 yrs
- Wildfire 1/10 Low
- Heat 3/10 Moderate 7 d/yr ≥102°F today · 18 d/yr by 30 yrs out
- Wind 2/10 Low 0% chance of damaging wind over 30 yrs
- Air quality 2/10 Low 1 unhealthy d/yr today · 2 by 30 yrs out
Nearby sold comps map
Loading sold comps map…
Walkable amenities ~0.75 mi
Loading nearby amenities…
Taxation est. · year 1
- Rental income
- $25,309
- − Mortgage interest
- −$11,147
- − Property taxes
- −$1,584
- − Insurance
- −$995
- − Repairs & maintenance
- −$2,025
- − Management
- −$2,025
- − Depreciation
- −$5,789
- Taxable income
- $1,744
- Est. tax owed @ 24.0%
- −$419
- After-tax cash flow
- $4,474/yr
For passive investors: Depreciation is non-cash, so a rental often shows a tax loss while cash-flowing — sheltering income. Rental losses are passive: they offset passive income freely, and up to $25,000/yr can offset ordinary (W-2) income if you actively participate and your MAGI is under $100k (phasing out to $0 by $150k); unused losses carry forward. On sale, claimed depreciation is recaptured at up to 25%, and gains may owe capital-gains tax (a 1031 exchange can defer both). Figures are a year-1 estimate at your 24.0% rate — not tax advice; consult a CPA.
Schools (NCES district)
- District
- Lebanon Community School Corporation
- NCES district ID
- 1805790
- Math proficiency
- 41% ▼ -11.00%
- Reading proficiency
- 44% ▼ -5.00%
- Median HH income
- $52,178
- Composite
- 36.77/100
- National rank
- #4571
- State rank
- #115 of 301 in IN
Livability — Lebanon
- Score
- 66/100
- State rank
- #296
- US rank
- #11943
Category grades
Schools grade is shown separately in the Schools card above.
Census & demographics
- Census place
- Lebanon, IN
- County
- Boone County · 69,822 people
- City population
- 23,553
- Metro
- Indianapolis-Carmel-Anderson, IN
- Population (ZIP)
- 23,553
- Household income
- $68,930
- Rent vs Own
- Severe rent burden
- 235.0
Population outlook (Boone County) Hauer SSP2
- Today (2025)
- 77,877 people
- By 2030
- 85,185 · +9.4%
- By 2040
- 99,753 · +28.1%
- By 2050
- 113,572 · +45.8%
- By 2075
- 145,674 · +87.1%
- By 2100
- 161,165 · +106.9%
Race, ethnicity, and origin ACS 2023
- Neighborhood character
- Predominantly White (91%)
- Race & ethnicity
- White 91% Two or more races 6% Hispanic / Latino 6% Black 1%
- Hispanic origin (detail)
- Mexican 4%
- Common ancestry
- Serbian 4% Slovak 2% Italian 2%
- Foreign-born
- 3% · Canada, Jamaica
- Languages at home
- 95% English-only · Spanish 4%
Political lean MEDSL · Boone
- 2024 margin
- R (+16.0) · D 41.0% · R 57.0% · Other 2.0%
- 2008→2024 swing
- +9.8pp toward D · 2008: -25.8pp · 2024: -16.0pp
- All cycles
- 2024: R+16.0 2020: R+18.4 2016: R+29.5 2012: R+37.8 2008: R+25.8
Not yet ingested
- Civics
- —
Market trends
- HPI YoY
- ▼ -188.54%
- Current HPI
- 229.2844
- Rent YoY
- —
- Metro
- Indianapolis-Carmel-Anderson, IN
- State GDP YoY
- ▲ 2.90%
- F500 in state
- 18
Industry mix (Fortune 500 HQ in IN)
| Industry | F500 HQs | Revenue |
|---|---|---|
| Industrial Machinery | 2 | $37B |
|
||
| Healthcare | 1 | $177B |
|
||
| Pharmaceuticals | 1 | $45B |
|
||
| Metals / Steel | 1 | $18B |
|
||
| Agriculture | 1 | $17B |
|
||
| Packaging | 1 | $12B |
|
||
Price history
1 event — show timeline
- 2026-05-23 Listed $199,000 MIBOR as Distributed by MLS Grid
Property tax history
+7.2%/yrLatest (2025): $1,584 · -11.3% YoY. Source: county tax records.
Cash-flow waterfall
monthlySold comps — $/sqft
last 12 mo · ≤1 miLoading sold comps…