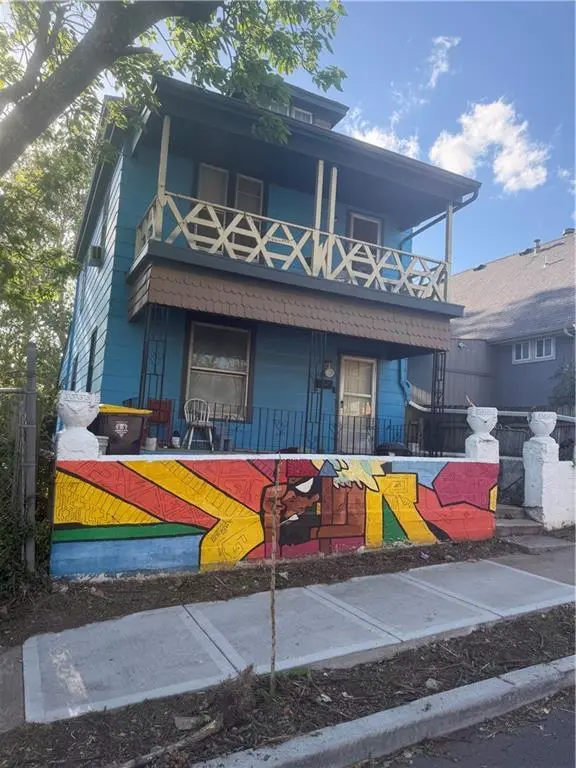
2336 Belleview Ave · Kansas City, MO
Flood risk 5/10 · Moderate
- FEMA flood zone
- X (unshaded)
- Chance of flooding over 30 yrs
- 0.24%
- Est. flood insurance / yr
- $473 – $860
Fire risk 1/10 · Minimal
- Est. fire insurance / yr
- $1,054 – $1,958
Heat risk 5/10 · Moderate
- Hot days now (above 106°F)
- 7 days/yr
- Hot days in 30 yrs
- 17 days/yr
Wind risk 2/10 · Minimal
- Chance of severe wind over 30 yrs
- —
Air-quality risk 3/10 · Minor
- Unhealthy air days now
- 2 days/yr
- Unhealthy air days in 30 yrs
- 3 days/yr
Risk factors via First Street. Map © Google.
Why this score? — see what drove the C- grade
The composite is a weighted blend of 9 inputs, each scored 0–100. Each bar is that input's sub-score; the figure is the points it added to the 100-point composite (weight × sub-score).
- Cash flow +20.9/30.0
- ARV discount +7.5/15.0
- DSCR +6.7/10.0
- 1% rule +5.5/10.0
- Livability +3.9/5.0
- Rent growth +2.6/5.0
- Condition / age +2.5/5.0
- Schools +1.5/10.0
- Appreciation +0.0/10.0
$220,000
🖨 Deal sheet (PDF) 📄 Offer letter ✓ Due diligence
Key facts
- 3,287 sq ft lot
- Built 1880
- Listed 15 days
Property features AI
Finance
- Financial info: Annual tax listed (amount provided)
Exterior
- Parking: Other parking
- Utilities: Public water
- Home design: Single-family residence; Residential property; Approximately 2,000 square feet living area; Age: 101+ years
- Construction: Wood siding; Composition roof
- Exterior features: Lot approximately 3,287 square feet; Flood plain status: unknown; Public water
Interior
- Bedrooms: 3 bedrooms
- Bathrooms: 1 full bathroom; 1 half bathroom
- Heating & cooling: Natural gas heating; Window air conditioning units
- Interior features: 2.5-story floor plan; Basement (other)
Neighborhood map
What this means for you Summary
Snapshot
- This is a 3-bed/1.5-bath single-family listed at $220k.
Deal economics
- At list price, monthly cash flow is $308 ($4k/yr) — positive.
- The deal already cash-flows at list — no discount required.
- Meets the 1% rule at list price ($2k rent vs $220k).
- Recommended offer: $217k (1.5% below list) — sets the bar for market timing.
- Cap rate 8.0% vs local median 3.9% in Kansas City — top-decile yield for the area; either an underpriced asset or a hidden risk that comps aren't pricing in. Stress-test before assuming the spread holds.
Location & tenants
- Location reads 78/100 on livability (#28 in MO, #2,671 nationally) — a middle-class / working-renter tenant base. Strengths: amenities A+, commute A+, cost of living A+; Watch: schools C-, crime F.
- Kansas City 33 (urban): math 12% / reading 24% proficiency, ranked #308 of 324 in MO (top 95%) — low school quality limits family demand, transient renter base, plan for 1-2y turnover; 75% free/reduced lunch — lower-income household profile, screen leases tightly.
- Market conditions: Rents flat; 97 active listings in the ZIP; 38 comparable units currently listed for rent nearby; rentals at typical pace (median 16d on market — plan ~3-4 weeks tenant-placement turnaround); solid renter incomes; 4,002 units permitted in Jackson County in 2024 (2,271 in 5+ unit buildings).
- This rent runs 34% of the median local income ($81k/yr) — at the standard rent-burdened threshold; future hikes will face affordability resistance.
Forward outlook
- Local home prices are declining (-3.0%/yr); year-one equity from $2k of loan paydown is wiped out by about $7k of value loss. Plan a longer hold.
- Jackson County population projected at +4% by 2050 — modest demand growth; plan on rents tracking national, not racing it.
Negotiation context
- It's been on market 16 days — a 2% lower offer ($217k) is reasonable based on typical stale-listing flexibility.
Risks & watch-outs
- Watch-outs: built in 1880 — expect roof / HVAC / electrical / plumbing capex.
- Climate carrying-cost: moderate flood risk; extreme-heat days projected 7→17/yr by 2055 (HVAC capex compounding) — expect insurance premiums to compound above CPI over the hold.
Questions for the listing agent
- Built in 1880 — when were the roof, HVAC, electrical panel, plumbing, and water heater last replaced?
- Is there a deadline driving the sale (1031 exchange, divorce, estate, relocation)? That informs how much negotiation room exists.
- Crime grade is F in this area — have there been break-ins, vandalism, or insurance claims at this property in the last 3 years? What carrier currently insures it and at what premium?
- What's the average days-on-market for RENTAL listings here right now (not sales)? A rising rental-DOM trend means longer vacancies and softer asking-rent achievability than the comps imply.
- What's the recent tenant-quality profile in this submarket — average credit score on applications, eviction rate, late-payment / NSF rate, and stable-employment percentage? A property-management company in the area should have these aggregated.
- How much new for-sale + rental construction is in the pipeline within 1–3 miles? Heavy new supply typically softens prices + rents 12–24 months out; constrained supply supports both.
Investment metrics
- 1% rule
- 1.05% ✓
- Cap rate
- 7.97%
- Cash-on-cash
- 6.00%
- DSCR
- 1.27
- GRM
- 7.9
CMA / ARV
- ARV (median comp)
- $464,646
- List price
- $220,000
- Delta
- -52.65%
- Verdict
- UNDERPRICED
- Comps
- 20 within 1.0 mi
Show comp detail 12 sales within ~0.75 mi
| Address | Dist | Beds/Ba | Sqft | Sold | Price | $/sf | Match |
|---|---|---|---|---|---|---|---|
| 2128 Summit St | 0.19mi | 3/2.5 | 2,016 (+8%) | 3mo | $249,900 | $124 | 72 |
| 1812 Mercier St | 0.46mi | 3/2.5 | 1,815 (-3%) | 1mo | $625,000 | $344 | 68 |
| 1203 W 20th Ter | 0.30mi | 3/1.5 | 1,606 (-14%) | 2mo | $325,000 | $202 | 61 |
| 2104 Holly St | 0.26mi | 3/2.5 | 1,746 (-7%) | 15mo | $650,000 | $372 | 60 |
| 2648 Madison Ave | 0.40mi | 3/2.0 | 2,000 (+7%) | 18mo | $220,000 | $110 | 54 |
| 1741 Holly St | 0.52mi | 3/2.5 | 1,978 (+6%) | 12mo | $400,000 | $202 | 53 |
| 2635 Belleview Ave | 0.37mi | 4/3.0 (+1) | 1,728 (-8%) | 14mo | $310,000 | $179 | 47 |
| 1630 Jefferson St | 0.71mi | 3/1.5 | 1,788 (-5%) | 21mo | $550,000 | $308 | 41 |
| 1613 Madison St | 0.74mi | 2/1.5 (-1) | 1,784 (-5%) | 13mo | $650,000 | $364 | 41 |
| 1715 Belleview Ave | 0.55mi | 2/1.0 (-1) | 2,104 (+12%) | 18mo | $485,000 | $231 | 32 |
| 2804 Summit St | 0.56mi | 4/2.5 (+1) | 1,612 (-14%) | 23mo | $220,000 | $136 | 22 |
| 2922 Summit St | 0.72mi | 2/2.5 (-1) | 2,140 (+14%) | 19mo | $249,500 | $117 | 18 |
Match score weights: distance 35% · size 25% · config 20% · recency 20%. Top-matched comps best support the ARV.
Projected returns pro-forma
-3.0% appreciation · 0.44% rent growth · sell at horizon
- IRR
- -10.0%
- Equity multiple
- 0.65×
- Total profit
- $-21,813
- Equity at exit
- $32,803
- IRR
- -4.5%
- Equity multiple
- 0.74×
- Total profit
- $-16,257
- Equity at exit
- $19,022
Cash invested: $61,600 (down + closing). Projections, not guarantees.
Landlord ↔ Tenant lean methodology
- Overall (STATE)
- 81 Strongly Landlord-Friendly
- State Missouri
- 81 Strongly Landlord-Friendly · R+10
- County
- — inherits STATE
- City
- — inherits STATE
ZIP-level market 64108
- Home prices YoY
- -25.2%
- Rents YoY
- 0.4%
- Active inventory
- 97
- Price-to-rent
- 7.9×
Monthly cashflow live
- Estimated rent
- $2,314 high interval (Pro) →
- Mortgage (P&I)
- −$1,154
- Tax est. 1.5%
- −$275 /mo · $3,300/yr
- Insurance
- −$92
- HOA
- −$0
- Vacancy / Maint / Mgmt
- −$486
- Net cashflow
- $308
Break-even live
Sensitivity live
| Price | -10% $460 | -5% $384 | +0% $308 | +5% $232 | +10% $156 |
|---|---|---|---|---|---|
| Rent | -10% $125 | -5% $217 | +0% $308 | +5% $399 | +10% $491 |
| Rate | -1.0pp $419 | -0.5pp $364 | base $308 | +0.5pp $251 | +1.0pp $193 |
UW: 25.0% down · 7.5% · 30yr · 1.5% tax · 5.0% vac · 8.0% maint · 8.0% mgmt
Financing live
Cash to close
- Down payment
- $55,000
- Closing costs
- $6,600
- Reserves months
- —
- Total cash needed
- —
Loan-product check · same deal, 3 products live
Conventional
25% down · 7.5% · 30yr
- Down + closing
- —
- Monthly P&I
- —
- Monthly cashflow
- —
- DSCR
- —
- Eligible?
- —
Personal DTI + credit; lowest rate.
DSCR
20% down · 8.5% · 30yr
- Down + closing
- —
- Monthly P&I
- —
- Monthly cashflow
- —
- DSCR
- —
- Eligible?
- —
No personal income docs; deal must DSCR.
Hard money
10% down · 12.0% · 12mo
- Down + closing
- —
- Monthly P&I
- —
- Monthly cashflow
- —
- DSCR
- —
- Eligible?
- —
Short-term bridge; refi at stabilization.
Rent comps 38 comps
| Address | Beds | Baths | Sqft | Rent | $/sqft | DOM | Units | Dist |
|---|---|---|---|---|---|---|---|---|
| 601 Avenida Cesar E Chavez Kansas City, MO | 1.0–2.0 | 1.0–2.0 | 933 | $2,260 | $2.42 | 3d | 15 | 0.23mi |
| 360 W Pershing Rd Unit 330 Kansas City, MO | 2.0 | 2.0 | 1612 | $2,695 | $1.67 | 44d | 1 | 0.36mi |
| 1936 Summit St Kansas City, MO | 1.0–2.0 | 1.0 | 1234 | $1,805 | $1.46 | 44d | 1 | 0.36mi |
| 2630 Madison Ave Unit 2 Kansas City, MO | 2.0 | 1.0 | 1500 | $1,850 | $1.23 | 44d | 1 | 0.39mi |
| 382 W 22nd St Kansas City, MO | 2.0 | 2.0 | 1501 | $2,019 | $1.35 | 44d | 1 | 0.39mi |
| 382 W 22nd St Kansas City, MO | 2.0 | 2.0 | 1350 | $1,869 | $1.38 | 17d | 1 | 0.39mi |
| 2645 Madison Ave Unit 6 Kansas City, MO | 3.0 | 2.0 | 1500 | $2,300 | $1.53 | 44d | 1 | 0.43mi |
| 2121 Central St Kansas City, MO | 1.0–2.0 | 1.0–2.0 | 1815 | $3,095 | $1.71 | 3d | 3 | 0.48mi |
| 311 W 22nd St Kansas City, MO | 3.0 | 1.0–2.0 | 1009 | $4,340 | $4.30 | 3d | 60 | 0.49mi |
| 217 W Pershing Rd Kansas City, MO | 2.0 | 2.0 | 1423 | $2,807 | $1.97 | 5d | 1 | 0.50mi |
| 117 W 20th St Kansas City, MO | 1.0–2.0 | 1.0–2.0 | 1130 | $5,416 | $4.79 | 11d | 1 | 0.61mi |
| 2910 Belleview Ave Kansas City, MO | 4.0 | 2.5 | 2100 | $2,800 | $1.33 | 20d | 1 | 0.73mi |
| 104 E 28 Ter Kansas City, MO | 1.0–2.0 | 1.0–2.5 | 1087 | $2,699 | $2.48 | 4d | 12 | 0.95mi |
| 128 E 29th St Kansas City, MO | 2.0 | 2.5 | 1375 | $2,749 | $2.00 | 44d | 1 | 0.99mi |
| 2980 Baltimore Ave Kansas City, MO | 2.0 | 2.0 | 1225 | $2,354 | $1.92 | 44d | 5 | 1.00mi |
| 2705 McGee Trfy Kansas City, MO | 3.0 | 1.0–2.0 | 1000 | $2,881 | $2.88 | 2d | 13 | 1.00mi |
| 1477 Main St Kansas City, MO | 2.0 | 1.0–2.5 | 1177 | $7,180 | $6.10 | 2d | 15 | 1.05mi |
| 3040 Baltimore Ave Kansas City, MO | 2.0 | 1.0–2.0 | 1363 | $5,999 | $4.40 | 2d | 75 | 1.05mi |
| 106 W 14th St Kansas City, MO | 1.0–2.0 | 1.0–2.0 | 1046 | $3,792 | $3.63 | 2d | 27 | 1.06mi |
| 1200 Washington St Kansas City, MO | 1.0–2.0 | 1.0–2.0 | 1011 | $2,257 | $2.23 | 44d | 17 | 1.07mi |
| 1200 Washington St Kansas City, MO | 1.0–2.0 | 1.0–2.0 | 1093 | $2,324 | $2.13 | 4d | 16 | 1.07mi |
| 2523 Charlotte St Kansas City, MO | 3.0 | 3.0 | 1500 | $2,050 | $1.37 | 44d | 1 | 1.19mi |
| 1050 Jefferson St Kansas City, MO | 1.0–2.0 | 1.0–2.0 | 1166 | $2,558 | $2.19 | 44d | 17 | 1.19mi |
| 1050 Jefferson St Kansas City, MO | 1.0–2.0 | 1.0–2.0 | 1166 | $2,683 | $2.30 | 4d | 17 | 1.19mi |
| 2715 Holmes St Kansas City, MO | 3.0 | 2.0 | 1848 | $2,095 | $1.13 | 17d | 1 | 1.20mi |
| 106 W 11th St Kansas City, MO | 2.0 | 1.0–2.0 | 838 | $2,528 | $3.01 | 3d | 28 | 1.26mi |
| 2915 Cherry St Kansas City, MO | 1.0–2.0 | 1.0–2.0 | 995 | $1,625 | $1.63 | 44d | 7 | 1.26mi |
| 934 Broadway Blvd Kansas City, MO | 2.0 | 2.0 | 1950 | $2,231 | $1.14 | 44d | 1 | 1.28mi |
| 1125 Grand Blvd Kansas City, MO | 2.0 | 1.0–2.5 | 1315 | $4,283 | $3.26 | 3d | 36 | 1.33mi |
| 1004 Baltimore Ave Kansas City, MO | 1.0–2.0 | 1.0–2.0 | 1015 | $1,750 | $1.72 | 2d | 8 | 1.33mi |
| 3420 Broadway Blvd Kansas City, MO | 1.0–3.0 | 1.0–2.0 | 1043 | $2,160 | $2.07 | 24d | 2 | 1.35mi |
| 2901 Charlotte St Kansas City, MO | 2.0 | 1.0 | 1700 | $1,700 | $1.00 | 13d | 1 | 1.36mi |
| 1103 Grand Blvd Kansas City, MO | 1.0–2.0 | 1.0–2.0 | 1061 | $1,650 | $1.56 | 24d | 6 | 1.37mi |
| 218 W 34th St Kansas City, MO | 3.0 | 2.5 | 1300 | $1,859 | $1.43 | 15d | 1 | 1.37mi |
| 3336 Wyoming St Kansas City, MO | 4.0 | 2.0 | 1812 | $2,699 | $1.49 | 11d | 1 | 1.38mi |
| 2501 Troost Ave Kansas City, MO | 2.0 | 1.0–2.0 | 984 | $2,679 | $2.72 | 44d | 15 | 1.39mi |
| 911 Main St Kansas City, MO | 2.0 | 1.0–2.0 | 1018 | $3,675 | $3.61 | 2d | 18 | 1.44mi |
| 701 Broadway Blvd Kansas City, MO | 2.0 | 1.0–2.0 | 1059 | $2,522 | $2.38 | 3d | 12 | 1.45mi |
Listing history 16 events
-
2026-06-21days on market $220,000 Active 16 DOM
-
2026-06-18days on market $220,000 Active 13 DOM
-
2026-06-17days on market $220,000 Active 12 DOM
-
2026-06-16days on market $220,000 Active 11 DOM
-
2026-06-15days on market $220,000 Active 10 DOM
-
2026-06-13days on market $220,000 Active 8 DOM
-
2026-06-09days on market $220,000 Active 4 DOM
-
2026-06-08days on market $220,000 Active 3 DOM
-
2026-06-07statusdays on market $220,000 Active 2 DOM
-
2026-06-05days on market $220,000 Coming Soon 27 DOM
-
2026-06-03days on market $220,000 Coming Soon 26 DOM
-
2026-06-02days on market $220,000 Coming Soon 25 DOM
-
2026-06-01days on market $220,000 Coming Soon 24 DOM
-
2026-05-31days on market $220,000 Coming Soon 23 DOM
-
2026-05-08historical $220,000
-
1983-01-01soldstatus
ⓘ Source: listings_history table (triggers on properties + properties_extension) + one-shot
backfill from property_details.listing_events for pre-trigger history.
Climate risk First Street
- Flood 5/10 Major FEMA zone X (unshaded) · 24% chance over 30 yrs
- Wildfire 1/10 Low
- Heat 5/10 Major 7 d/yr ≥106°F today · 17 d/yr by 30 yrs out
- Wind 2/10 Low
- Air quality 3/10 Moderate 2 unhealthy d/yr today · 3 by 30 yrs out
Nearby sold comps map
Loading sold comps map…
Walkable amenities ~0.75 mi
Loading nearby amenities…
Taxation est. · year 1
- Rental income
- $27,772
- − Mortgage interest
- −$12,323
- − Property taxes
- −$3,300
- − Insurance
- −$1,100
- − Repairs & maintenance
- −$2,222
- − Management
- −$2,222
- − Depreciation
- −$6,400
- Taxable income
- $205
- Est. tax owed @ 24.0%
- −$49
- After-tax cash flow
- $3,646/yr
For passive investors: Depreciation is non-cash, so a rental often shows a tax loss while cash-flowing — sheltering income. Rental losses are passive: they offset passive income freely, and up to $25,000/yr can offset ordinary (W-2) income if you actively participate and your MAGI is under $100k (phasing out to $0 by $150k); unused losses carry forward. On sale, claimed depreciation is recaptured at up to 25%, and gains may owe capital-gains tax (a 1031 exchange can defer both). Figures are a year-1 estimate at your 24.0% rate — not tax advice; consult a CPA.
Schools (NCES district)
- District
- Kansas City 33
- NCES district ID
- 2916400
- Math proficiency
- 12% ▼ -8.00%
- Reading proficiency
- 24% ▬ 0.00%
- Median HH income
- $35,227
- Composite
- 14.8/100
- National rank
- #9387
- State rank
- #308 of 324 in MO
Livability — Kansas City
- Score
- 78/100
- State rank
- #28
- US rank
- #2671
Category grades
Schools grade is shown separately in the Schools card above.
Census & demographics
- Census place
- Kansas City, MO
- County
- Jackson County · 687,798 people
- City population
- 439,467
- Metro
- Kansas City, MO-KS
- Population (ZIP)
- 10,495
- Household income
- $80,551
- Rent vs Own
- Severe rent burden
- 864.0
Population outlook (Jackson County) Hauer SSP2
- Today (2025)
- 719,589 people
- By 2030
- 731,456 · +1.6%
- By 2040
- 746,689 · +3.8%
- By 2050
- 749,289 · +4.1%
- By 2075
- 736,227 · +2.3%
- By 2100
- 668,210 · -7.1%
Race, ethnicity, and origin ACS 2023
- Neighborhood character
- Diverse neighborhood (Simpson 0.65)
- Race & ethnicity
- White 50% Black 26% Hispanic / Latino 17% Two or more races 12% Asian 3%
- Hispanic origin (detail)
- Mexican 15%
- Common ancestry
- Italian 2% Lithuanian 2% Slovak 1%
- Foreign-born
- 6% · Canada
- Languages at home
- 88% English-only · Spanish 9% Arabic 1% French/Haitian/Cajun 1%
Political lean MEDSL · Jackson
- 2024 margin
- D (+19.3) · D 58.9% · R 39.5% · Other 1.6%
- 2008→2024 swing
- -6.1pp toward R · 2008: 25.4pp · 2024: 19.3pp
- All cycles
- 2024: D+19.3 2020: D+22.0 2016: D+16.6 2012: D+19.0 2008: D+25.4
Not yet ingested
- Civics
- —
Market trends
- HPI YoY
- ▼ -91.93%
- Current HPI
- 273.3599
- Rent YoY
- ▲ 0.44%
- Metro
- Kansas City, MO-KS
- State GDP YoY
- ▲ 1.84%
- F500 in state
- 20
Industry mix (Fortune 500 HQ in MO)
| Industry | F500 HQs | Revenue |
|---|---|---|
| Healthcare | 1 | $163B |
|
||
| Insurance | 1 | $21B |
|
||
| Industrial Technology | 1 | $17B |
|
||
| Retail | 1 | $16B |
|
||
| Industrial Distribution | 1 | $10B |
|
||
| Utilities | 1 | $9B |
|
||
Price history
+0.0% since first listed3 events — show timeline
- 2026-06-06 Listed $220,000 Heartland MLS as Distributed by MLS Grid
- 2026-05-08 Coming Soon $220,000 Heartland MLS as Distributed by MLS Grid
- 1983-01-01 Sold (Public Records) — Public Records
Property tax history
-8.1%/yrLatest (2025): $302 · +6.3% YoY. Source: county tax records.
Cash-flow waterfall
monthlySold comps — $/sqft
last 12 mo · ≤1 miLoading sold comps…