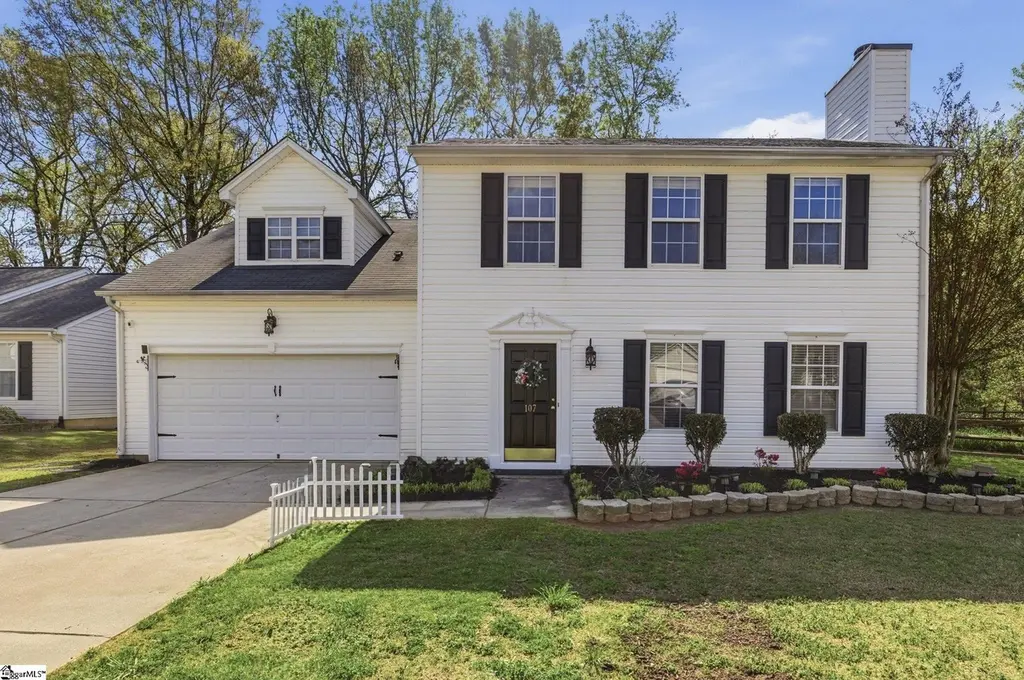
107 Buckhead Ln · Simpsonville, SC
Flood risk 1/10 · Minimal
- FEMA flood zone
- X (unshaded)
- Chance of flooding over 30 yrs
- 0.0%
- Est. flood insurance / yr
- $507 – $1,088
Fire risk 2/10 · Minimal
- Est. fire insurance / yr
- $783 – $1,453
Heat risk 6/10 · Moderate
- Hot days now (above 103°F)
- 7 days/yr
- Hot days in 30 yrs
- 17 days/yr
Wind risk 2/10 · Minimal
- Chance of severe wind over 30 yrs
- 2.0%
Air-quality risk 4/10 · Minor
- Unhealthy air days now
- 4 days/yr
- Unhealthy air days in 30 yrs
- 5 days/yr
Risk factors via First Street. Map © Google.
Why this score? — see what drove the D- grade
The composite is a weighted blend of 9 inputs, each scored 0–100. Each bar is that input's sub-score; the figure is the points it added to the 100-point composite (weight × sub-score).
- ARV discount +10.5/15.0
- Cash flow +8.0/30.0
- Livability +4.4/5.0
- Schools +4.2/10.0
- Rent growth +3.5/5.0
- Condition / age +2.5/5.0
- DSCR +2.1/10.0
- 1% rule +1.5/10.0
- Appreciation +0.0/10.0
$315,000
🖨 Deal sheet (PDF) 📄 Offer letter ✓ Due diligence
Listing remarks
Located in the highly sought-after Stonebridge subdivision in Simpsonville?s Hwy 14 area, this move-in ready home checks all the boxes, just minutes from downtown Simpsonville and Greenville. Featuring 3 bedrooms plus a versatile bonus room, this layout offers flexibility for a home office, playroom, or guest space. Bright, updated interiors flow through the living area, formal dining, and eat-in kitchen. Step outside to a private, fenced backyard with patio, perfect for entertaining or unwinding. Homes in Stonebridge don?t last, schedule your showing today!
Key facts
- 0.3 acre lot
- 2 garage spots
- Community pool
Property features AI
Finance
- HOA & community: Homeowners association present; HOA covers pool, street lights and by-laws; Community amenities include pool, common areas and some sidewalks
Exterior
- Parking: Attached 2-car garage with door opener; Paved concrete driveway
- Utilities: Public water; Electric water heater; Public sewer; Public garbage pickup; Attached garage (electrified); Central forced air cooling
- Home design: Two-story residential home; Built in 2001; Storage includes attic, garage and an outbuilding with electricity; Slab foundation; Vinyl siding; Composition shingle roof
- Construction: Vinyl siding construction; Composition shingle roof; Slab foundation; Year built: 2001
- Exterior features: Patio; Tilt-out windows; Fenced yard; Level lot with some trees; Sidewalks; Underground utilities; Located on a cul-de-sac
Interior
- Kitchen: Dishwasher; Disposal; Refrigerator; Electric cooktop; Electric oven; Electric freestanding range; Built-in microwave; Pantry
- Bedrooms: Primary bedroom on 2nd level with full bath, tub/shower and walk-in closet (14 x 14); Second bedroom (12 x 11); Third bedroom (12 x 13); Fourth bedroom (16 x 13)
- Flooring: Carpet; Luxury vinyl tile/plank
- Bathrooms: 2 full baths; 1 half bath
- Heating & cooling: Electric heating; Central forced cooling
- Interior features: Attic stairs (disappearing); Cable available; Ceiling fans; Smoke detector; Some window treatments; Laminate countertops; Pantry closet; Gas log fireplace (1)
- Laundry & utility: Laundry on 2nd floor in closet-style room; Washer connection; Electric dryer hookup
Neighborhood map
What this means for you Summary
Snapshot
- This is a 3-bed/2.0-bath single-family listed at $315k.
Deal economics
- At list price, monthly cash flow is $-318 ($-4k/yr) — negative.
- To cash-flow at today's rent, offer at most $259k (17.9% below list).
- To meet the 1% rule (rent ≥ 1% of price), the offer needs to be $205k (34.9% below list).
- Recommended offer: $205k (34.9% below list) — sets the bar for 1% rule.
- Cap rate 5.1% vs local median 3.9% in Simpsonville — top-decile yield for the area; either an underpriced asset or a hidden risk that comps aren't pricing in. Stress-test before assuming the spread holds.
Location & tenants
- Location reads 87/100 on livability (#1 in SC, #295 nationally) — a professional / high-income tenant draw. Strengths: commute A+, housing A+, health & safety A+.
- Greenville 01 (suburban): math 44% / reading 54% proficiency, ranked #10 of 80 in SC (top 12%) — families likely to look elsewhere, expect single-tenant / working-renter base with shorter leases.
- Zoned schools: Simpsonville Elementary (math 52% / reading 52%, grade C-, #145 of 597 statewide, top 26%, 744 students, 71% FRL) — zoned schools average 71% FRL vs 42% district-wide (28 pts higher); higher-poverty schools than district average — tighter screening recommended.
- Market conditions: Rents rising fast (+4.1%/yr); 531 active listings in the ZIP; 3 comparable units currently listed for rent nearby; rentals at typical pace (median 16d on market — plan ~3-4 weeks tenant-placement turnaround); high-income renter base; 5,595 units permitted in Greenville County in 2024 (566 in 5+ unit buildings).
Forward outlook
- Local home prices are declining (-3.0%/yr); year-one equity from $2k of loan paydown is wiped out by about $9k of value loss. Plan a longer hold.
- Greenville County population projected at +34% by 2050 — long-run rental-demand tailwind backs the buy-and-hold thesis.
Negotiation context
- It's been on market 79 days — a 6% lower offer ($296k) is reasonable based on typical stale-listing flexibility.
Risks & watch-outs
- Climate carrying-cost: extreme-heat days projected 7→17/yr by 2055 (HVAC capex compounding) — expect insurance premiums to compound above CPI over the hold.
Questions for the listing agent
- What do current leases actually rent for vs. the listed asking? Can we see a recent rent roll and the last 12 months of T-12 income?
- It's been on market 79 days. Have you received any prior offers? Is the seller open to a 35% concession, seller financing, or rate buy-down credit?
- What does the HOA fee cover, when was the last increase, and are there any pending special assessments or reserve-fund shortfalls?
- Why hasn't it sold? Are there any deal-killer items the seller is aware of (foundation, flood, title, zoning, code violations)?
- Is there a deadline driving the sale (1031 exchange, divorce, estate, relocation)? That informs how much negotiation room exists.
- Schools are B-rated — typically a magnet for longer-tenancy family renters. What's the average tenant stay here, and is there a school-zone premium baked into asking?
- The area grade is low — what's the realistic commute time and amenity access for the typical tenant pool here? Any planned neighborhood developments (good or bad) we should know about?
- What's the average days-on-market for RENTAL listings here right now (not sales)? A rising rental-DOM trend means longer vacancies and softer asking-rent achievability than the comps imply.
- What's the recent tenant-quality profile in this submarket — average credit score on applications, eviction rate, late-payment / NSF rate, and stable-employment percentage? A property-management company in the area should have these aggregated.
- How much new for-sale + rental construction is in the pipeline within 1–3 miles? Heavy new supply typically softens prices + rents 12–24 months out; constrained supply supports both.
Investment metrics
- 1% rule
- 0.65% ✗
- Cap rate
- 5.08%
- Cash-on-cash
- -4.33%
- DSCR
- 0.81
- GRM
- 12.8
CMA / ARV
- ARV (on-the-fly)
- $337,688
- Comps found
- 12
Show comp detail 12 sales within ~0.75 mi
| Address | Dist | Beds/Ba | Sqft | Sold | Price | $/sf | Match |
|---|---|---|---|---|---|---|---|
| 116 Colewood Pl | 0.25mi | 3/2.0 | 1,802 (+2%) | 9mo | $357,500 | $198 | 78 |
| 236 Applehill Way | 0.09mi | 3/2.0 | 1,580 (-11%) | 1mo | $338,200 | $214 | 77 |
| 30 Brookhaven Way | 0.23mi | 3/2.0 | 1,634 (-8%) | 4mo | $325,000 | $199 | 73 |
| 107 Sedgebrook Dr | 0.17mi | 3/2.0 | 1,576 (-11%) | 3mo | $335,000 | $213 | 72 |
| 239 Applehill Way | 0.12mi | 3/2.0 | 1,601 (-9%) | 10mo | $302,500 | $189 | 70 |
| 240 Applehill Way | 0.09mi | 3/2.0 | 1,980 (+12%) | 7mo | $358,500 | $181 | 70 |
| 209 Brookmere Rd | 0.53mi | 3/2.0 | 1,713 (-3%) | 2mo | $254,000 | $148 | 68 |
| 10 Lost Tree Ln | 0.52mi | 3/2.0 | 1,834 (+4%) | 9mo | $350,000 | $191 | 62 |
| 4 Cloverdale Ct | 0.51mi | 4/2.0 (+1) | 1,808 (+2%) | 8mo | $215,000 | $119 | 61 |
| 114 Woodcliff Ct | 0.59mi | 3/2.0 | 1,876 (+6%) | 10mo | $280,000 | $149 | 54 |
| 108 Acacia Dr | 0.44mi | 3/2.0 | 1,535 (-13%) | 7mo | $290,000 | $189 | 52 |
| 110 Arlen Ave | 0.74mi | 3/2.5 | 1,856 (+5%) | 10mo | $499,900 | $269 | 47 |
Match score weights: distance 35% · size 25% · config 20% · recency 20%. Top-matched comps best support the ARV.
Projected returns pro-forma
-3.0% appreciation · 4.09% rent growth · sell at horizon
- IRR
- -22.6%
- Equity multiple
- 0.22×
- Total profit
- $-69,165
- Equity at exit
- $46,968
- IRR
- -14.8%
- Equity multiple
- 0.12×
- Total profit
- $-77,278
- Equity at exit
- $27,235
Cash invested: $88,200 (down + closing). Projections, not guarantees.
Landlord ↔ Tenant lean methodology
- Overall (STATE)
- 90 Strongly Landlord-Friendly
- State South Carolina
- 90 Strongly Landlord-Friendly · R+6
- County
- — inherits STATE
- City
- — inherits STATE
ZIP-level market 29681
- Rents YoY
- 4.1%
- Active inventory
- 531
- Price-to-rent
- 12.8×
Monthly cashflow live
- Estimated rent
- $2,050 medium interval (Pro) →
- Mortgage (P&I)
- −$1,652
- Tax from tax record
- −$116 /mo · $1,397/yr
- Insurance
- −$131
- HOA
- −$38
- Vacancy / Maint / Mgmt
- −$430
- Net cashflow
- $-318
Break-even live
Sensitivity live
| Price | -10% $-140 | -5% $-229 | +0% $-318 | +5% $-408 | +10% $-497 |
|---|---|---|---|---|---|
| Rent | -10% $-480 | -5% $-399 | +0% $-318 | +5% $-237 | +10% $-156 |
| Rate | -1.0pp $-160 | -0.5pp $-238 | base $-318 | +0.5pp $-400 | +1.0pp $-483 |
UW: 25.0% down · 7.5% · 30yr · 1.5% tax · 5.0% vac · 8.0% maint · 8.0% mgmt
Financing live
Cash to close
- Down payment
- $78,750
- Closing costs
- $9,450
- Reserves months
- —
- Total cash needed
- —
Loan-product check · same deal, 3 products live
Conventional
25% down · 7.5% · 30yr
- Down + closing
- —
- Monthly P&I
- —
- Monthly cashflow
- —
- DSCR
- —
- Eligible?
- —
Personal DTI + credit; lowest rate.
DSCR
20% down · 8.5% · 30yr
- Down + closing
- —
- Monthly P&I
- —
- Monthly cashflow
- —
- DSCR
- —
- Eligible?
- —
No personal income docs; deal must DSCR.
Hard money
10% down · 12.0% · 12mo
- Down + closing
- —
- Monthly P&I
- —
- Monthly cashflow
- —
- DSCR
- —
- Eligible?
- —
Short-term bridge; refi at stabilization.
Rent comps 3 comps
| Address | Beds | Baths | Sqft | Rent | $/sqft | DOM | Units | Dist |
|---|---|---|---|---|---|---|---|---|
| 202 Newgate Dr Simpsonville, SC | 4.0 | 2.0 | 1656 | $1,795 | $1.08 | 16d | 1 | 0.56mi |
| 103 Jones Ave Unit B Simpsonville, SC | 2.0 | 1.5 | 1360 | $1,700 | $1.25 | 25d | 1 | 1.19mi |
| 1316 NE Main St Simpsonville, SC | 2.0–4.0 | 2.5 | 1612 | $2,377 | $1.47 | 4d | 31 | 1.27mi |
HOA detail
- Monthly dues
- $38 · $456/yr
Listing history 19 events
-
2026-06-22pricedays on market $315,000 Active 79 DOM
-
2026-06-18days on market $329,000 Active 76 DOM
-
2026-06-17days on market $329,000 Active 75 DOM
-
2026-06-16days on market $329,000 Active 74 DOM
-
2026-06-15days on market $329,000 Active 73 DOM
-
2026-06-13days on market $329,000 Active 71 DOM
-
2026-06-13days on market $329,000 Active 70 DOM
-
2026-06-10days on market $329,000 Active 68 DOM
-
2026-06-09days on market $329,000 Active 67 DOM
-
2026-06-08days on market $329,000 Active 66 DOM
-
2026-06-07days on market $329,000 Active 65 DOM
-
2026-06-03days on market $329,000 Active 61 DOM
-
2026-06-03days on market $329,000 Active 60 DOM
-
2026-06-01days on market $329,000 Active 59 DOM
-
2026-05-31days on market $329,000 Active 58 DOM
-
2026-05-14price $334,000
-
2026-05-12price $339,000
-
2026-05-11price $334,000
-
2026-04-03$339,000 Active
ⓘ Source: listings_history table (triggers on properties + properties_extension) + one-shot
backfill from property_details.listing_events for pre-trigger history.
Tax reassessment forecast SC · Resets to sale price
- Current annual tax
- $1,397 · $116/mo
- Projected year-2 tax
- $1,796 · $150/mo
- Expected delta
- +$399/yr (+$33/mo · 28.5%)
ⓘ Screening estimate from a state-policy table — verify with the county assessor before closing.
Climate risk First Street
- Flood 1/10 Low FEMA zone X (unshaded) · 0% chance over 30 yrs
- Wildfire 2/10 Low
- Heat 6/10 Major 7 d/yr ≥103°F today · 17 d/yr by 30 yrs out
- Wind 2/10 Low 2% chance of damaging wind over 30 yrs
- Air quality 4/10 Moderate 4 unhealthy d/yr today · 5 by 30 yrs out
Nearby sold comps map
Loading sold comps map…
Walkable amenities ~0.75 mi
Loading nearby amenities…
Taxation est. · year 1
- Rental income
- $24,595
- − Mortgage interest
- −$17,645
- − Property taxes
- −$1,397
- − Insurance
- −$1,575
- − Repairs & maintenance
- −$1,968
- − Management
- −$1,968
- − HOA
- −$456
- − Depreciation
- −$9,164
- Taxable loss
- −$9,577
- Est. tax savings @ 24.0%
- +$2,298
- After-tax cash flow
- $-1,522/yr
For passive investors: Depreciation is non-cash, so a rental often shows a tax loss while cash-flowing — sheltering income. Rental losses are passive: they offset passive income freely, and up to $25,000/yr can offset ordinary (W-2) income if you actively participate and your MAGI is under $100k (phasing out to $0 by $150k); unused losses carry forward. On sale, claimed depreciation is recaptured at up to 25%, and gains may owe capital-gains tax (a 1031 exchange can defer both). Figures are a year-1 estimate at your 24.0% rate — not tax advice; consult a CPA.
Schools (NCES district)
- District
- Greenville 01
- NCES district ID
- 4502310
- Math proficiency
- 44% ▼ -10.00%
- Reading proficiency
- 54% ▼ -2.00%
- Median HH income
- $49,596
- Composite
- 41.88/100
- National rank
- #3370
- State rank
- #10 of 80 in SC
Livability — Simpsonville
- Score
- 87/100
- State rank
- #1
- US rank
- #295
Category grades
Schools grade is shown separately in the Schools card above.
Census & demographics
- Census place
- Simpsonville, SC
- County
- Greenville County · 573,815 people
- City population
- 104,420
- Metro
- Greenville-Anderson, SC
- Population (ZIP)
- 68,650
- Household income
- $114,986
- Rent vs Own
- Severe rent burden
- 865.0
Population outlook (Greenville County) Hauer SSP2
- Today (2025)
- 574,580 people
- By 2030
- 615,615 · +7.1%
- By 2040
- 695,373 · +21.0%
- By 2050
- 769,367 · +33.9%
- By 2075
- 933,296 · +62.4%
- By 2100
- 1,029,196 · +79.1%
Race, ethnicity, and origin ACS 2023
- Neighborhood character
- Predominantly White (71%)
- Race & ethnicity
- White 71% Black 12% Hispanic / Latino 8% Two or more races 8% Asian 4%
- Hispanic origin (detail)
- Mexican 2% Puerto Rican 1%
- Common ancestry
- Romanian 3% Italian 3% Slovak 3%
- Foreign-born
- 8% · Canada, Jamaica, South Korea
- Languages at home
- 89% English-only · Spanish 6% Other Indo-European 1% Other Asian/Pacific 1%
Political lean MEDSL · Greenville
- 2024 margin
- Strong R (+22.2) · D 38.0% · R 60.2% · Other 1.8%
- 2008→2024 swing
- +1.7pp toward D · 2008: -23.9pp · 2024: -22.2pp
- All cycles
- 2024: R+22.2 2020: R+18.2 2016: R+24.7 2012: R+27.8 2008: R+23.9
Not yet ingested
- Civics
- —
Market trends
- HPI YoY
- ▼ -144.64%
- Current HPI
- 226.5252
- Rent YoY
- ▲ 4.09%
- Metro
- Greenville-Anderson, SC
- State GDP YoY
- ▲ 4.51%
- F500 in state
- 2
Industry mix (Fortune 500 HQ in SC)
| Industry | F500 HQs | Revenue |
|---|---|---|
| Packaging | 1 | $7B |
|
||
Price history
-1.5% since first listed4 events — show timeline
- 2026-05-14 Price Changed $334,000 Greater Greenville MLS
- 2026-05-12 Price Changed $339,000 Greater Greenville MLS
- 2026-05-11 Price Changed $334,000 Greater Greenville MLS
- 2026-04-03 Listed $339,000 Greater Greenville MLS
Property tax history
+2.2%/yrLatest (2025): $1,397 · +3.8% YoY. Source: county tax records.
Cash-flow waterfall
monthlySold comps — $/sqft
last 12 mo · ≤1 miLoading sold comps…