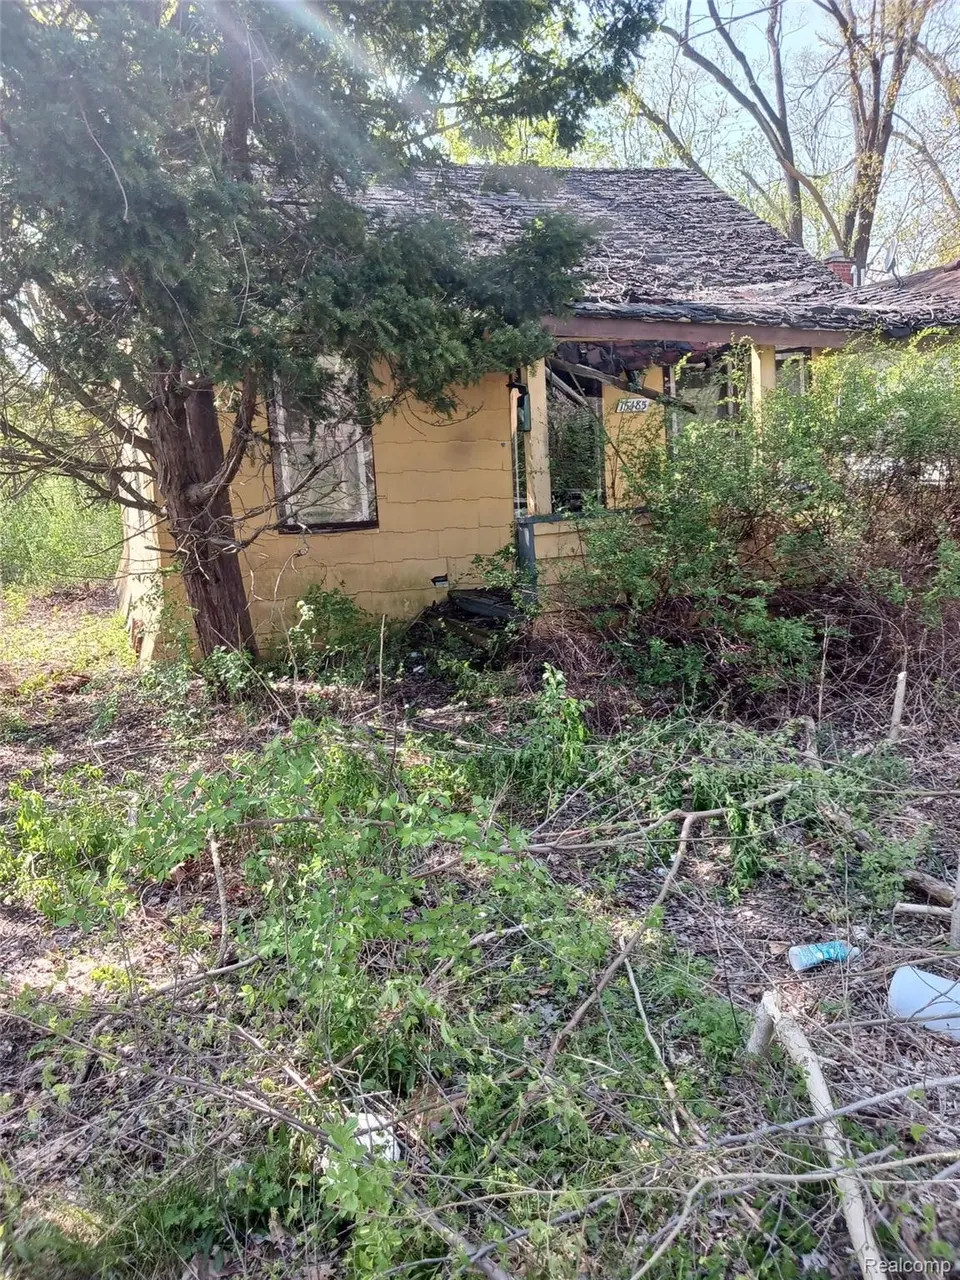
15485 Grayfield St · Detroit, MI
Flood risk 1/10 · Minimal
- FEMA flood zone
- X (unshaded)
- Chance of flooding over 30 yrs
- 0.0%
- Est. flood insurance / yr
- $507 – $1,088
Fire risk 1/10 · Minimal
- Est. fire insurance / yr
- $784 – $1,456
Heat risk 3/10 · Minor
- Hot days now (above 98°F)
- 7 days/yr
- Hot days in 30 yrs
- 14 days/yr
Wind risk 2/10 · Minimal
- Chance of severe wind over 30 yrs
- —
Air-quality risk 3/10 · Minor
- Unhealthy air days now
- 2 days/yr
- Unhealthy air days in 30 yrs
- 3 days/yr
Risk factors via First Street. Map © Google.
Why this score? — see what drove the D grade
The composite is a weighted blend of 9 inputs, each scored 0–100. Each bar is that input's sub-score; the figure is the points it added to the 100-point composite (weight × sub-score).
- Cash flow +15.0/30.0
- ARV discount +7.5/15.0
- 1% rule +5.0/10.0
- DSCR +5.0/10.0
- Livability +3.7/5.0
- Rent growth +2.5/5.0
- Condition / age +2.5/5.0
- Schools +1.3/10.0
- Appreciation +0.0/10.0
$12,000
🖨 Deal sheet (PDF) 📄 Offer letter ✓ Due diligence
Listing remarks MLS
Opportunity for investors, rehabbers, or buyers looking for a renovation project in the Brightmoor area. This property requires a full rehab Located in an area experiencing ongoing investment and redevelopment, this property has strong potential for value-add improvements. Property Highlights: Full rehab required Investment opportunity Located in an area with active renovation activity Potential for rental or resale after improvements Opportunity For: Fix & flip investors Buy-and-hold investors Rental property portfolio expansion Buyer to verify all information.
Key facts
- Potential for rental
- 3,920 sq ft lot
- Built 1923
Tags
Property features AI
Finance
- Other: Pets not allowed
- Financial info: Annual tax amount listed
Exterior
- Parking: Covered parking (no garage)
- Utilities: Public water; Public sewer
- Home design: Single family residence; Residential property; One story; Ground-level entry; Lot dimensions approximately 34 x 120 (0.09 acres); Subdivision: B E TAYLORS BRIGHTMOOR WOLFRAM; Facing information not provided
- Construction: Asphalt construction material
- Exterior features: Exterior lighting; Cleared lot
Interior
- Kitchen: No appliances included
- Bathrooms: 1 full bathroom
- Heating & cooling: Central air conditioning; Natural gas heating; Wall furnace
- Interior features: Other interior features; Crawl space basement; 5 total rooms
Neighborhood map
What this means for you Summary
Snapshot
- This is a 3-bed/1.0-bath single-family listed at $12k.
Deal economics
- At list price, monthly cash flow is $776 ($9k/yr) — positive.
- The deal already cash-flows at list — no discount required.
- Meets the 1% rule at list price ($1k rent vs $12k).
- Recommended offer: $12k (3.0% below list) — sets the bar for market timing.
- Cap rate 83.9% vs local median 10.0% in Detroit — top-decile yield for the area; either an underpriced asset or a hidden risk that comps aren't pricing in. Stress-test before assuming the spread holds.
Location & tenants
- Location reads 73/100 on livability (#218 in MI) — a middle-class / working-renter tenant base. Strengths: amenities A+, commute A+, cost of living A+; Watch: schools F, crime F, employment F.
- Detroit Public Schools Community District (urban): math 10% / reading 24% proficiency, ranked #499 of 540 in MI (top 92%) — low school quality limits family demand, transient renter base, plan for 1-2y turnover; 90% free/reduced lunch — lower-income household profile, screen leases tightly.
- Market conditions: 161 active listings in the ZIP; 23 comparable units currently listed for rent nearby; rentals lingering (median 45d on market — plan ~5-8 weeks vacancy on turnover, expect pricing pressure); 83% of comp listings sitting > 30 days — soft ceiling on asking rent; lower-income renter base — watch delinquency; 2,639 units permitted in Wayne County in 2024 (1,216 in 5+ unit buildings).
Forward outlook
- Local home prices are declining (-3.0%/yr); year-one equity from $83 of loan paydown is wiped out by about $360 of value loss. Plan a longer hold.
- Wayne County population projected at -17% by 2050 — secular population decline; favor cash flow + early exit over multi-decade hold.
- At projected returns (-3.0% appreciation + 3.0% rent growth), your $3k cash investment doubles in ~1 year — after that, you're playing with house money.
Negotiation context
- It's been on market 57 days — a 3% lower offer ($12k) is reasonable based on typical stale-listing flexibility.
- 2 sale attempts; this cycle's ask has dropped $3k (20%) from the opening price — seller is motivated, your offer sets the floor, not the list.
Risks & watch-outs
- Watch-outs: built in 1923 — expect roof / HVAC / electrical / plumbing capex.
Questions for the listing agent
- It's been on market 57 days. Have you received any prior offers? Is the seller open to a 3% concession, seller financing, or rate buy-down credit?
- Built in 1923 — when were the roof, HVAC, electrical panel, plumbing, and water heater last replaced?
- Is there a deadline driving the sale (1031 exchange, divorce, estate, relocation)? That informs how much negotiation room exists.
- Schools are F-rated, which usually means shorter tenancies and higher turnover. Who's the typical renter profile here, and what's been the actual vacancy rate?
- Crime grade is F in this area — have there been break-ins, vandalism, or insurance claims at this property in the last 3 years? What carrier currently insures it and at what premium?
- The area grade is low — what's the realistic commute time and amenity access for the typical tenant pool here? Any planned neighborhood developments (good or bad) we should know about?
- What's the average days-on-market for RENTAL listings here right now (not sales)? A rising rental-DOM trend means longer vacancies and softer asking-rent achievability than the comps imply.
- What's the recent tenant-quality profile in this submarket — average credit score on applications, eviction rate, late-payment / NSF rate, and stable-employment percentage? A property-management company in the area should have these aggregated.
- How much new for-sale + rental construction is in the pipeline within 1–3 miles? Heavy new supply typically softens prices + rents 12–24 months out; constrained supply supports both.
Investment metrics
- 1% rule
- 9.06% ✓
- Cap rate
- 83.90%
- Cash-on-cash
- 277.18%
- DSCR
- 13.33
- GRM
- 0.9
CMA / ARV
- ARV (median comp)
- $26,697
- List price
- $12,000
- Delta
- -55.05%
- Verdict
- UNDERPRICED
- Comps
- 20 within 1.0 mi
Show comp detail 12 sales within ~0.75 mi
| Address | Dist | Beds/Ba | Sqft | Sold | Price | $/sf | Match |
|---|---|---|---|---|---|---|---|
| 15853 Beaverland St | 0.28mi | 3/1.0 | 727 (+0%) | 12mo | $60,000 | $83 | 76 |
| 16105 Chatham St | 0.43mi | 3/1.0 | 704 (-3%) | 21mo | $35,000 | $50 | 58 |
| 15341 Bramell St | 0.28mi | 2/1.0 (-1) | 644 (-11%) | 8mo | $12,000 | $19 | 57 |
| 15361 Grayfield St | 0.12mi | 2/2.0 (-1) | 815 (+13%) | 11mo | $30,000 | $37 | 56 |
| 24354 Puritan | 0.64mi | 2/1.0 (-1) | 736 (+2%) | 9mo | $72,150 | $98 | 55 |
| 15777 Chatham | 0.34mi | 2/1.0 (-1) | 696 (-4%) | 21mo | $10,000 | $14 | 55 |
| 24478 Pilgrim | 0.68mi | 2/1.0 (-1) | 704 (-3%) | 7mo | $95,000 | $135 | 53 |
| 16548 Woodbine St | 0.65mi | 2/1.0 (-1) | 720 (-1%) | 14mo | $88,000 | $122 | 52 |
| 16746 Bramell St | 0.67mi | 2/1.0 (-1) | 755 (+4%) | 7mo | $30,000 | $40 | 51 |
| 15847 W Parkway St | 0.25mi | 2/1.0 (-1) | 800 (+10%) | 21mo | $28,000 | $35 | 48 |
| 14889 Dacosta St | 0.63mi | 2/1.0 (-1) | 665 (-8%) | 8mo | $24,999 | $38 | 45 |
| 16205 Lenore | 0.70mi | 2/1.0 (-1) | 690 (-5%) | 20mo | $91,000 | $132 | 38 |
Match score weights: distance 35% · size 25% · config 20% · recency 20%. Top-matched comps best support the ARV.
Projected returns pro-forma
-3.0% appreciation · 3.0% rent growth · sell at horizon
- IRR
- —
- Equity multiple
- 15.14×
- Total profit
- $47,503
- Equity at exit
- $1,789
- IRR
- —
- Equity multiple
- 32.27×
- Total profit
- $105,082
- Equity at exit
- $1,038
Cash invested: $3,360 (down + closing). Projections, not guarantees.
Landlord ↔ Tenant lean methodology
- Overall (STATE)
- 62 Landlord-Friendly
- State Michigan
- 62 Landlord-Friendly · EVEN
- County
- — inherits STATE
- City
- — inherits STATE
ZIP-level market 48223
- Active inventory
- 161
- Price-to-rent
- 0.9×
Monthly cashflow live
- Estimated rent
- $1,087 high interval (Pro) →
- Mortgage (P&I)
- −$63
- Tax est. 1.5%
- −$15 /mo · $180/yr
- Insurance
- −$5
- HOA
- −$0
- Vacancy / Maint / Mgmt
- −$228
- Net cashflow
- $776
Break-even live
Sensitivity live
| Price | -10% $784 | -5% $780 | +0% $776 | +5% $772 | +10% $768 |
|---|---|---|---|---|---|
| Rent | -10% $690 | -5% $733 | +0% $776 | +5% $819 | +10% $862 |
| Rate | -1.0pp $782 | -0.5pp $779 | base $776 | +0.5pp $773 | +1.0pp $770 |
UW: 25.0% down · 7.5% · 30yr · 1.5% tax · 5.0% vac · 8.0% maint · 8.0% mgmt
Financing live
Cash to close
- Down payment
- $3,000
- Closing costs
- $360
- Reserves months
- —
- Total cash needed
- —
Loan-product check · same deal, 3 products live
Conventional
25% down · 7.5% · 30yr
- Down + closing
- —
- Monthly P&I
- —
- Monthly cashflow
- —
- DSCR
- —
- Eligible?
- —
Personal DTI + credit; lowest rate.
DSCR
20% down · 8.5% · 30yr
- Down + closing
- —
- Monthly P&I
- —
- Monthly cashflow
- —
- DSCR
- —
- Eligible?
- —
No personal income docs; deal must DSCR.
Hard money
10% down · 12.0% · 12mo
- Down + closing
- —
- Monthly P&I
- —
- Monthly cashflow
- —
- DSCR
- —
- Eligible?
- —
Short-term bridge; refi at stabilization.
Rent comps 23 comps
| Address | Beds | Baths | Sqft | Rent | $/sqft | DOM | Units | Dist |
|---|---|---|---|---|---|---|---|---|
| 16581 Wormer St Detroit, MI | 2.0 | 1.0 | 720 | $1,100 | $1.53 | 45d | 1 | 0.76mi |
| 16700 Lahser Rd Apt 18 Detroit, MI | 2.0 | 1.0 | 750 | $900 | $1.20 | 45d | 1 | 0.85mi |
| 14245 Riverview St Detroit, MI | 2.0 | 1.0 | 750 | $985 | $1.31 | 45d | 1 | 0.99mi |
| 14180 Riverview St Unit 101 Detroit, MI | 2.0 | 1.0 | 750 | $975 | $1.30 | 45d | 1 | 1.03mi |
| 14075 Riverview St Detroit, MI | 1.0–2.0 | 1.0 | 925 | $1,250 | $1.35 | 45d | 1 | 1.03mi |
| 14176 Riverview St Unit 120 Detroit, MI | 2.0 | 1.0 | 750 | $975 | $1.30 | 45d | 1 | 1.05mi |
| 14088 Riverview St Unit 108 Detroit, MI | 2.0 | 1.0 | 750 | $900 | $1.20 | 45d | 1 | 1.14mi |
| 14088 Riverview St Unit 208 Detroit, MI | 2.0 | 1.0 | 750 | $985 | $1.31 | 45d | 1 | 1.14mi |
| 14088 Riverview St Unit 207 Detroit, MI | 2.0 | 1.0 | 750 | $975 | $1.30 | 45d | 1 | 1.14mi |
| 23636 Schoolcraft Rd Apt 212 Detroit, MI | 2.0 | 1.0 | 750 | $985 | $1.31 | 45d | 1 | 1.17mi |
| 23636 Schoolcraft Rd Unit 109 Detroit, MI | 2.0 | 1.0 | 750 | $975 | $1.30 | 45d | 1 | 1.17mi |
| 23648 Schoolcraft Rd Detroit, MI | 2.0 | 1.0 | 750 | $1,050 | $1.40 | 45d | 1 | 1.18mi |
| 23838 Schoolcraft Rd Unit 209 Detroit, MI | 2.0 | 1.0 | 750 | $985 | $1.31 | 45d | 1 | 1.19mi |
| 23838 Schoolcraft Rd Unit 109 Detroit, MI | 2.0 | 1.0 | 750 | $845 | $1.13 | 45d | 1 | 1.19mi |
| 23838 Schoolcraft Rd Unit 212 Detroit, MI | 2.0 | 1.0 | 750 | $900 | $1.20 | 45d | 1 | 1.19mi |
| 23842 Schoolcraft Rd Detroit, MI | 2.0 | 1.0 | 750 | $975 | $1.30 | 45d | 1 | 1.21mi |
| 23850 Schoolcraft Rd Detroit, MI | 2.0 | 1.0 | 750 | $975 | $1.30 | 45d | 1 | 1.21mi |
| 17274 Bentler St Detroit, MI | 2.0 | 1.0 | 700 | $850 | $1.21 | 45d | 2 | 1.29mi |
| 17274 Bentler St Detroit, MI | 2.0 | 1.0 | 700 | $838 | $1.20 | 25d | 2 | 1.29mi |
| 17274 Bentler St #46 Detroit, MI | 2.0 | 1.0 | 700 | $850 | $1.21 | 18d | 1 | 1.29mi |
| 17270 Bentler St Detroit, MI | 2.0 | 1.0 | 650 | $850 | $1.31 | 45d | 1 | 1.30mi |
| 16194 Fielding St Unit 2 Detroit, MI | 2.0 | 1.0 | 750 | $950 | $1.27 | 16d | 1 | 1.41mi |
| 18025 Bentler St Detroit, MI | 3.0 | 1.0 | 728 | $1,250 | $1.72 | 25d | 1 | 1.47mi |
Listing history 17 events
-
2026-06-21days on market $12,000 Active 57 DOM
-
2026-06-18days on market $12,000 Active 54 DOM
-
2026-06-17days on market $12,000 Active 53 DOM
-
2026-06-15days on market $12,000 Active 51 DOM
-
2026-06-13days on market $12,000 Active 49 DOM
-
2026-06-13days on market $12,000 Active 48 DOM
-
2026-06-09days on market $12,000 Active 45 DOM
-
2026-06-08days on market $12,000 Active 44 DOM
-
2026-06-07days on market $12,000 Active 43 DOM
-
2026-06-04days on market $12,000 Active 40 DOM
-
2026-06-03days on market $12,000 Active 39 DOM
-
2026-06-02days on market $12,000 Active 38 DOM
-
2026-06-01days on market $12,000 Active 37 DOM
-
2026-05-31days on market $12,000 Active 36 DOM
-
2026-04-26$15,000 Active 577-char remark
-
2026-04-25$15,000 Active 574-char remark
Show marketing remark (574 chars)
Opportunity for investors, rehabbers, or buyers looking for a renovation project in the Brightmoor area. This property requires a full rehab Located in an area experiencing ongoing investment and redevelopment, this property has strong potential for value-add improvements. Property Highlights: Full rehab required Investment opportunity Located in an area with active renovation activity Potential for rental or resale after improvements Opportunity For: Fix & flip investors Buy-and-hold investors Rental property portfolio expansion Buyer to verify all information.
-
1995-05-22soldstatus $40,000
ⓘ Source: listings_history table (triggers on properties + properties_extension) + one-shot
backfill from property_details.listing_events for pre-trigger history.
Climate risk First Street
- Flood 1/10 Low FEMA zone X (unshaded) · 0% chance over 30 yrs
- Wildfire 1/10 Low
- Heat 3/10 Moderate 7 d/yr ≥98°F today · 14 d/yr by 30 yrs out
- Wind 2/10 Low
- Air quality 3/10 Moderate 2 unhealthy d/yr today · 3 by 30 yrs out
Nearby sold comps map
Loading sold comps map…
Walkable amenities ~0.75 mi
Loading nearby amenities…
Taxation est. · year 1
- Rental income
- $13,049
- − Mortgage interest
- −$672
- − Property taxes
- −$180
- − Insurance
- −$60
- − Repairs & maintenance
- −$1,044
- − Management
- −$1,044
- − Depreciation
- −$349
- Taxable income
- $9,700
- Est. tax owed @ 24.0%
- −$2,328
- After-tax cash flow
- $6,985/yr
For passive investors: Depreciation is non-cash, so a rental often shows a tax loss while cash-flowing — sheltering income. Rental losses are passive: they offset passive income freely, and up to $25,000/yr can offset ordinary (W-2) income if you actively participate and your MAGI is under $100k (phasing out to $0 by $150k); unused losses carry forward. On sale, claimed depreciation is recaptured at up to 25%, and gains may owe capital-gains tax (a 1031 exchange can defer both). Figures are a year-1 estimate at your 24.0% rate — not tax advice; consult a CPA.
Schools (NCES district)
- District
- Detroit Public Schools Community District
- NCES district ID
- 2601103
- Math proficiency
- 10% ▼ -2.00%
- Reading proficiency
- 24% ▲ 6.00%
- Median HH income
- $25,815
- Composite
- 13.06/100
- National rank
- #9564
- State rank
- #499 of 540 in MI
Livability — Detroit
- Score
- 73/100
- State rank
- #218
- US rank
- #5427
Category grades
Schools grade is shown separately in the Schools card above.
Census & demographics
- Census place
- Detroit, MI
- County
- Wayne County · 1,562,939 people
- City population
- 572,865
- Metro
- Detroit-Warren-Dearborn, MI
- Population (ZIP)
- 22,622
- Household income
- $44,512
- Rent vs Own
- Severe rent burden
- 1151.0
Population outlook (Wayne County) Hauer SSP2
- Today (2025)
- 1,675,273 people
- By 2030
- 1,620,300 · -3.3%
- By 2040
- 1,502,341 · -10.3%
- By 2050
- 1,384,039 · -17.4%
- By 2075
- 1,124,592 · -32.9%
- By 2100
- 881,193 · -47.4%
Race, ethnicity, and origin ACS 2023
- Neighborhood character
- Predominantly Black (86%)
- Race & ethnicity
- Black 86% White 7% Two or more races 5% Hispanic / Latino 2%
- Common ancestry
- Romanian 1% Iranian 1%
- Foreign-born
- 1% · Canada
- Languages at home
- 97% English-only · Spanish 2%
Political lean MEDSL · Wayne
- 2024 margin
- Strong D (+29.0) · D 62.7% · R 33.7% · Other 3.6%
- 2008→2024 swing
- -20.5pp toward R · 2008: 49.5pp · 2024: 29.0pp
- All cycles
- 2024: D+29.0 2020: D+38.1 2016: D+37.3 2012: D+46.9 2008: D+49.5
Not yet ingested
- Civics
- —
Market trends
- HPI YoY
- ▼ -303.41%
- Current HPI
- 138.2779
- Rent YoY
- —
- Metro
- Detroit-Warren-Dearborn, MI
- State GDP YoY
- ▲ 1.37%
- F500 in state
- 28
Industry mix (Fortune 500 HQ in MI)
| Industry | F500 HQs | Revenue |
|---|---|---|
| Automotive Parts | 3 | $48B |
|
||
| Automotive | 2 | $372B |
|
||
| Chemicals | 1 | $45B |
|
||
| Automotive Retail | 1 | $29B |
|
||
| Healthcare / Medical Devices | 1 | $23B |
|
||
| Automotive Technology | 1 | $20B |
|
||
Price history
-70.0% since first listed5 events — show timeline
- 2026-05-26 Price Changed $12,000 MiRealSource-MiMLS
- 2026-05-26 Price Changed $12,000 REALCOMP
- 2026-04-26 Listed $15,000 REALCOMP
- 2026-04-25 Listed $15,000 MiRealSource-MiMLS
- 1995-05-22 Sold (Public Records) $40,000 Public Records
Property tax history
+6.6%/yrLatest (2025): $1,392 · +1.6% YoY. Source: county tax records.
Cash-flow waterfall
monthlySold comps — $/sqft
last 12 mo · ≤1 miLoading sold comps…